. 2023 Feb 6;14(1):375.
doi: 10.1038/s41467-023-36025-x.

Intrinsic macroscale oscillatory modes driving long range functional connectivity in female rat brains detected by ultrafast fMRI

Affiliations

Intrinsic macroscale oscillatory modes driving long range functional connectivity in female rat brains detected by ultrafast fMRI

Joana Cabral et al. Nat Commun. .

Abstract

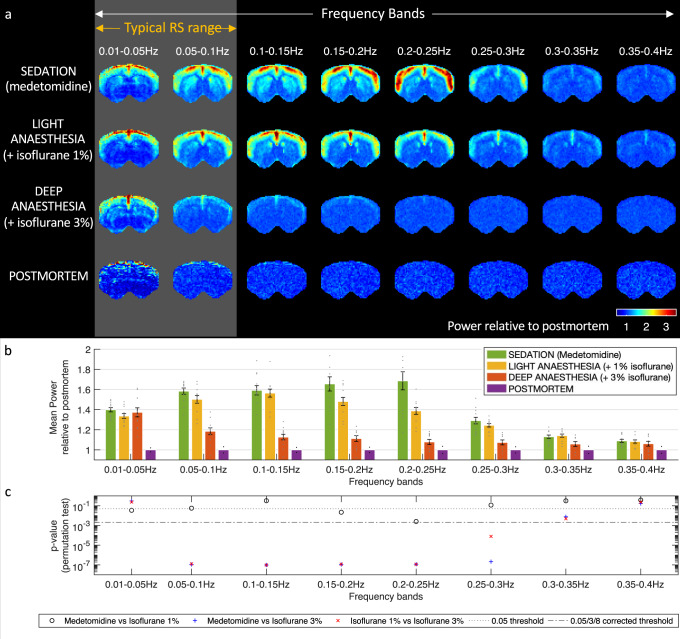
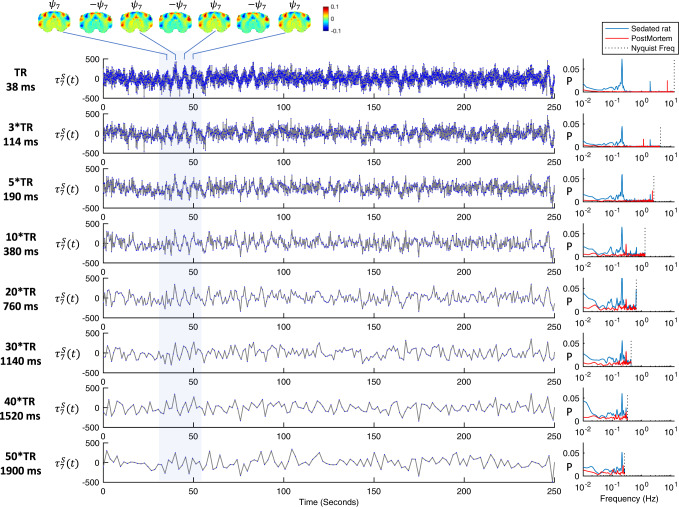
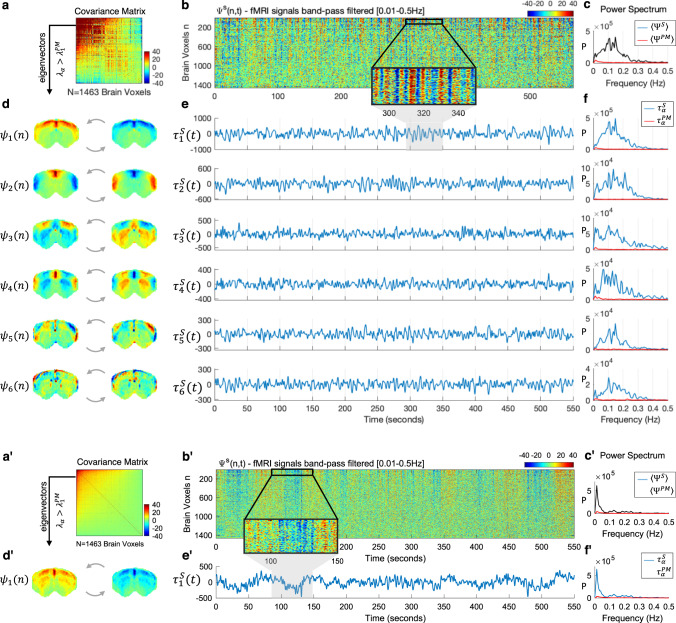
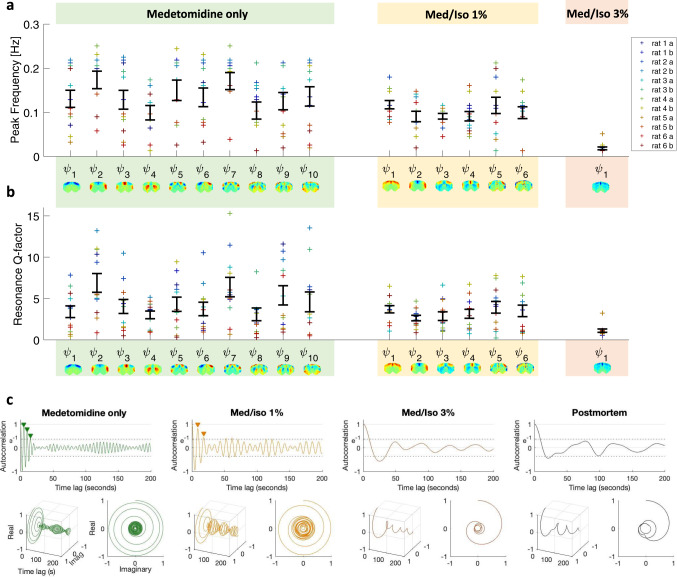
Spontaneous fluctuations in functional magnetic resonance imaging (fMRI) signals correlate across distant brain areas, shaping functionally relevant intrinsic networks. However, the generative mechanism of fMRI signal correlations, and in particular the link with locally-detected ultra-slow oscillations, are not fully understood. To investigate this link, we record ultrafast ultrahigh field fMRI signals (9.4 Tesla, temporal resolution = 38 milliseconds) from female rats across three anesthesia conditions. Power at frequencies extending up to 0.3 Hz is detected consistently across rat brains and is modulated by anesthesia level. Principal component analysis reveals a repertoire of modes, in which transient oscillations organize with fixed phase relationships across distinct cortical and subcortical structures. Oscillatory modes are found to vary between conditions, resonating at faster frequencies under medetomidine sedation and reducing both in number, frequency, and duration with the addition of isoflurane. Peaking in power within clear anatomical boundaries, these oscillatory modes point to an emergent systemic property. This work provides additional insight into the origin of oscillations detected in fMRI and the organizing principles underpinning spontaneous long-range functional connectivity.


Conflict of interest statement

The authors declare no competing interests.

Figures

Fig. 1
Fig. 1. Static and dynamic resting-state functional connectivity analysis in band-pass filtered fMRI signals.
a Correlation matrix of the fMRI signals in all voxels within the brain mask, bandpass filtered in a range typically considered in resting-state studies, i.e., 0.01–0.1 Hz (no nuisance regressor nor spatial smoothing applied). Each line/column in the matrix corresponds to the correlation map of each voxel. b Seed-based correlation maps are represented for three different seeds (white asterisks), where each voxel is colored according to its degree of correlation with the seed. A voxel contralateral to each seed is represented by a black circle. All color bars are truncated between −0.8 and 0.8. c Filtered fMRI signals were recorded in each seed (red) and corresponding contralateral voxel (black). Colored shades represent the sliding window correlation (SWC) using a 30-s window, showing that the correlation is not constant but fluctuates between transients of long-range phase locking. The same figure obtained from a postmortem scan is reported in Supplementary Fig. S2.
Fig. 2
Fig. 2. Spectral power of fMRI signals differs significantly between anesthesia conditions.
a Spatial maps of spectral power in 8 non-overlapping frequency bands, averaged across the s = 12 fMRI scans recorded under each anesthesia conditions and normalized by the mean power in sPM = 2 postmortem scans. fMRI recordings were recorded from n = 6 genetically similar female rats, each scanned twice in 3 anesthesia conditions (with isoflurane at 0%, 1%, and 3%. b Power in 8 frequency bands averaged across all brain voxels relative to the mean power in 2 postmortem scans. Dots correspond to the mean power in each scan and error bars represent the mean ± standard error across the s = 12 scans. c Two-sided p-values obtained from 10,000 t-tests on randomly permuted data comparing the power in s = 12 scans over the 3 anesthesia conditions and in each of 8 non-overlapping frequency bands, reported with respect to the standard threshold of 0.05 and the Bonferroni-corrected threshold of 0.0021. RS resting-state. p-values are reported in Supplementary Fig. 3. Source data are provided as a Source Data file and Source Codes are provided in Supplementary Material.
Fig. 3
Fig. 3. Spatial, temporal, and spectral signatures of the principal components in medetomidine-sedated rats.
a The NxN covariance matrix of fMRI signals (filtered within the range where significant spectral power was detected in the cortex, i.e., between 0.01 and 0.3 Hz) averaged across the 12 sedated rat scans. b Carpet plot of the fMRI signals in all brain voxels, n, over time, t, represented by the wave function ΨS(n,t), here shown for a representative scan S of a sedated rat in the frequency range [0.01–0.5 Hz]. Voxels are sorted according to the elements in the largest magnitude eigenvector ψ1. Values correspond to fMRI signal change with respect to the mean in each voxel. A zoom into the first 100 voxels over 60 s is inserted to illustrate oscillations in the signals. c Power spectrum of the mean fMRI signal across voxels for: (black) the scan shown in b and (red) a scan performed postmortem (PM). d The 10 principal components ψα obtained as the eigenvectors from (a) with eigenvalue λα above PM baseline are scaled by 1 (left) and −1 (right) to illustrate the activity pattern when the temporal signature oscillates between positive and negative values. e Temporal signature associated with each of the 10 principal components given by ταS(t)=ψαnΨsn,t for the same scan shown in (b). Clear oscillations with fluctuating amplitude can be observed. f Power spectra of the temporal signatures from e (blue) and in a postmortem scan (red). See Supplementary Movie 2 to observe the behavior of each principal component over time.
Fig. 4
Fig. 4. Recorded signals are reconstructed as the linear superposition of 10 condition-specific principal components with scan-specific temporal signatures.
This image is a still frame from Supplementary Movie 3. (Left) fMRI signals in N = 1463 brain voxels band-pass filtered between 0.01 and 0.3 Hz recorded from a representative rat under medetomidine only. Middle) Each of the 10 spatially defined principal modes of covariance is scaled over time by its corresponding temporal signature in scan S to illustrate the standing wave dynamics. (Right) The signals recorded in scan S are reconstructed as the linear sum of the 10 principal components multiplied by their corresponding temporal signature in scan S. To account for differences in power across components, colorbar limits are set to ±4 standard deviations of the corresponding temporal signatures.
Fig. 5
Fig. 5. Effect of the sampling rate in the power spectrum given a fixed scan duration.
Left: The unfiltered temporal signal τ7S(t) associated with the 7th principal component detected in ultrafast fMRI signals from medetomidine-sedated rats (Time of Repetition, TR = 38 milliseconds, ms) is downsampled by considering only one in every 3, 5, 10, 20, 30, 40 and 50 frames (corresponding to intervals of 114, 190, 380, 760, 1140, 1520 and 1900 ms between frames). Plots are shown for 250 s from a representative scan S (same as Fig. 3). Right: The power spectral density (PSD) of the sampled signals computed for scan S (blue) and for a scan performed postmortem (red). For each downsampling factor, both PSD (red and blue) are normalized by the total power in the postmortem scan. PSDs are computed over the entire scan duration of 590 s.
Fig. 6
Fig. 6. The addition of isoflurane at 1% and 3% concentrations alters the spatial, temporal, and spectral signatures of principal components.
a, a’ The N × N covariance matrix of fMRI signals band-pass filtered between 0.01 and 0.3 Hz, averaged across 12 scans after the addition of isoflurane at 1% (top) and 3% (bottom) concentrations. b, b’ Carpet plot of the fMRI signals recorded in all brain voxels, n, over time, t, represented by the wave function ΨS(n,t), here shown for two scans S of the same rat from Fig. 3 in the frequency range [0.01–0.5 Hz]. Voxels are sorted according to the elements in the largest magnitude eigenvector ψ1. Values correspond to fMRI signal change with respect to the mean in each voxel. A zoom into the first 100 voxels over 60 s is inserted to illustrate oscillations in the signals. c, c’ Power spectrum of the mean fMRI signal across voxels. d, d’ The principal components detected with eigenvalue above baseline, are scaled by 1 (left) and −1 (right) to illustrate the activity pattern when the temporal signature oscillates between positive and negative values. e, e’ Temporal signature associated with each of the supra-threshold principal components given by ταS(t)=ψαnΨsn,t for the same scan shown in (b). f, f’ Power spectra of the temporal signatures from (e).
Fig. 7
Fig. 7. Principal components oscillate at higher frequencies and with less damping under medetomidine.
The temporal signatures associated with the principal components detected in each condition are characterized in terms of peak frequency (a) and Q-factor (b) for each of the s = 12 scans in each condition (2 scans per rat). Error bars represent the mean ± standard error across scans. c To illustrate the stability of the oscillations, the autocorrelation functions of the temporal signatures τ1S associated with the first principal component in each condition are reported. Examples are shown for 3 scans from the same rat and from a postmortem scan. As can be seen, the autocorrelation function under medetomidine exhibits 3 oscillations before the amplitude decays to 1/e (~37%), 2 cycles after adding isoflurane at 1% and no complete cycle under deep anesthesia, similar to what is observed in the postmortem scan.
Fig. 8
Fig. 8. Stochastic resonance of standing waves drives transient long-range correlations in simulated signals.
The spatial configurations and temporal signatures of the principal components align with the hypothesis that they represent standing waves, whose phenomenology is inherently associated with resonance phenomena. To model the dynamics emerging from the transient resonance of standing waves in the presence of background noise, for each of the spatial patterns detected in medetomidine-sedated rats (a), we simulate a temporal signature as the behavior of an underdamped oscillator perturbed with gaussian white noise (b). c Multiplying each N × 1 spatial pattern by the corresponding 1 × T temporal signature results in an N × T spatiotemporal pattern for each mode. The linear sum of these spatiotemporal patterns represents the superposition of a repertoire of standing waves resonating transiently in the presence of noise. d Still frames of the simulated dynamics obtained at distinct time points reveal the multiplicity of patterns that can be generated over time. e To demonstrate that this scenario generates patterns of long-range functional connectivity, we compute the correlation matrix of the simulated signals, as performed initially on empirical fMRI data (Fig. 1). f The seed correlation maps obtained from the simulated signals reveal correlation patterns visually similar to the ones detected from real fMRI recordings. Source Code is provided with this work.
Fig. 9
Fig. 9. Mechanistic model for the spontaneous resonance of standing waves driving the activation of functional brain networks.
a Like the response of spring, the temporal signature of brain modes can be approximated by a damped oscillator. Despite the lower temporal resolution inherent to multi-slice acquisitions hindering the detection of resonant behavior, the consistency of spatial patterns reinforces the hypothesis that the damped oscillatory response of functional networks extends to the whole-brain level, here represented by the first 5 eigenvectors of the average covariance matrices across 6 whole-brain scans (from 3 different rats). b Diagram illustrating a mechanistic scenario for brain activity, where each functional network is represented by a spatial pattern ψαresponding to perturbation with a damped harmonic motion.

References

    1. Fox MD, Raichle ME. Spontaneous fluctuations in brain activity observed with functional magnetic resonance imaging. Nat. Rev. Neurosci. 2007;8:700–711. doi: 10.1038/nrn2201. - DOI - PubMed
    1. Biswal BB, et al. Toward discovery science of human brain function. Proc. Natl Acad. Sci. USA. 2010;107:4734–4739. doi: 10.1073/pnas.0911855107. - DOI - PMC - PubMed
    1. Stam CJ. Modern network science of neurological disorders. Nat. Rev. Neurosci. 2014;15:683–695. doi: 10.1038/nrn3801. - DOI - PubMed
    1. Fornito A, Zalesky A, Breakspear M. The connectomics of brain disorders. Nat. Rev. Neurosci. 2015;16:159–172. doi: 10.1038/nrn3901. - DOI - PubMed
    1. Gozzi, A. & Zerbi, V. Modelling brain dysconnectivity in rodents. Biol. Psychiatry10.1016/j.biopsych.2022.09.008 (2022) in press. - PubMed

Publication types