. 2023 Feb 6;14(1):603.
doi: 10.1038/s41467-023-36186-9.

LSD1/PRMT6-targeting gene therapy to attenuate androgen receptor toxic gain-of-function ameliorates spinobulbar muscular atrophy phenotypes in flies and mice

Affiliations

LSD1/PRMT6-targeting gene therapy to attenuate androgen receptor toxic gain-of-function ameliorates spinobulbar muscular atrophy phenotypes in flies and mice

Ramachandran Prakasam et al. Nat Commun. .

Abstract

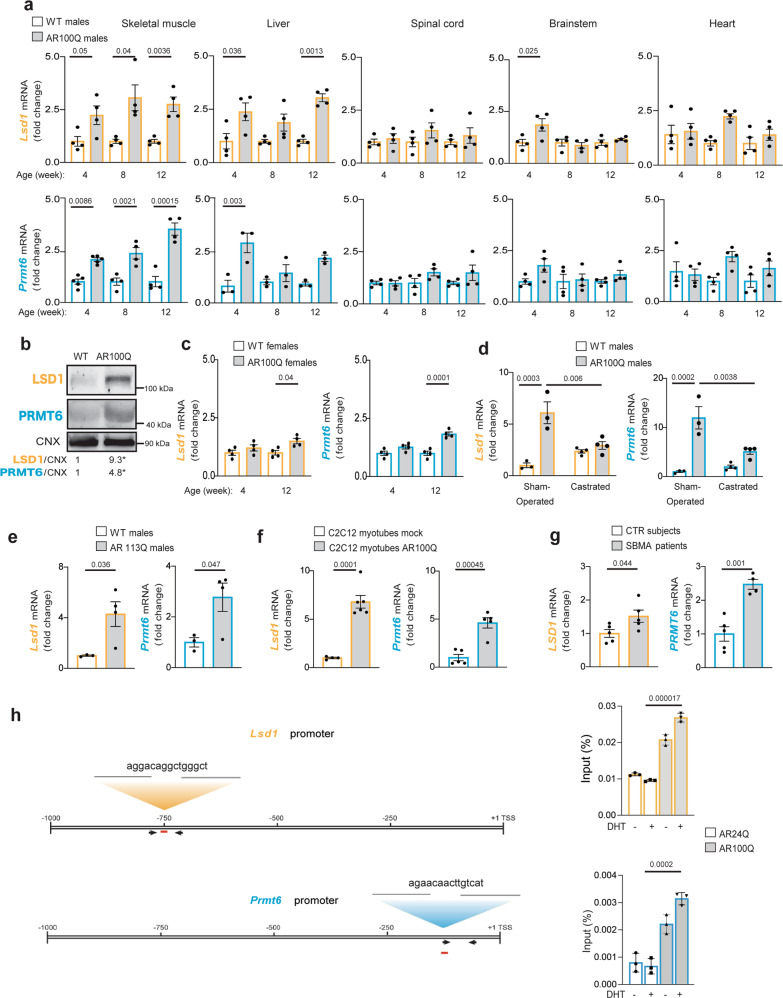
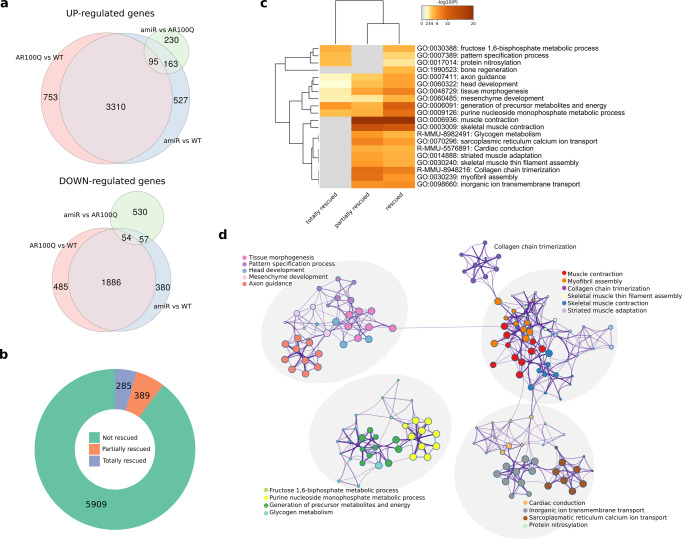
Spinobulbar muscular atrophy (SBMA) is caused by CAG expansions in the androgen receptor gene. Androgen binding to polyQ-expanded androgen receptor triggers SBMA through a combination of toxic gain-of-function and loss-of-function mechanisms. Leveraging cell lines, mice, and patient-derived specimens, we show that androgen receptor co-regulators lysine-specific demethylase 1 (LSD1) and protein arginine methyltransferase 6 (PRMT6) are overexpressed in an androgen-dependent manner specifically in the skeletal muscle of SBMA patients and mice. LSD1 and PRMT6 cooperatively and synergistically transactivate androgen receptor, and their effect is enhanced by expanded polyQ. Pharmacological and genetic silencing of LSD1 and PRMT6 attenuates polyQ-expanded androgen receptor transactivation in SBMA cells and suppresses toxicity in SBMA flies, and a preclinical approach based on miRNA-mediated silencing of LSD1 and PRMT6 attenuates disease manifestations in SBMA mice. These observations suggest that targeting overexpressed co-regulators can attenuate androgen receptor toxic gain-of-function without exacerbating loss-of-function, highlighting a potential therapeutic strategy for patients with SBMA.


Conflict of interest statement

M.P., M.B., G.R., and A.C. are named as co-inventors on the patent application Italian Priority N. 102022000026595 “New inhibitors of epigenetic regulators/nuovi inibitori di regolatori epigenetici”. The other authors declare no competing interests.

Figures

Fig. 1
Fig. 1. Early and persistent androgen-dependent overexpression of LSD1 and PRMT6 in the skeletal muscle of SBMA mice and patients.
a RT-PCR analysis of Lsd1 and Prmt6 transcript levels in the indicated tissues of WT and AR100Q mice (mice/genotype/age: LSD1 n = 4; PRMT6: skeletal muscle n = 5 at 4 weeks, n = 4 at 8–12 weeks; liver: n = 3; heart, brainstem and spinal cord: n = 4). b Western blots of LSD1 and PRMT6 levels in the quadriceps muscle of 12-week-old WT and AR100Q mice (n = 4 mice/genotype). *p = 0.048 LSD1, and p = 0.023 PRMT6. LSD1 and PRMT6 were detected with specific antibodies, and calnexin (CNX) was used as loading control. c RT-PCR analysis of Lsd1 and Prmt6 transcript levels in the quadriceps muscle of female WT and AR100Q mice (n = 4 mice/genotype). d RT-PCR analysis of Lsd1 and Prmt6 transcript levels in the extensor digitorum longus muscle of sham-operated and surgically castrated 8-week-old male AR100Q mice (n = 3 WT and AR100Q sham-operated mice and n = 4 WT and AR100Q castrated mice). e RT-PCR analysis of Lsd1 and Prmt6 transcript levels in the quadriceps muscle of 24-week-old male WT and knock-in mice expressing AR113Q (n = 3 WT and 4 knock-in mice). f RT-PCR analysis of Lsd1 and Prmt6 transcript levels in C2C12 myoblasts stably transduced with empty lentiviral vector (mock) or vector expressing AR100Q and differentiated to myotubes in presence of DHT (10 nM, 10 days, LSD1 expression n = 4 biological replicates mock, and n = 6 biological replicates AR100Q; PRMT6 n = 5 biological replicates). g RT-PCR analysis of LSD1 and PRMT6 transcript levels of quadriceps muscle biopsies of control (CTR) subjects and SBMA patients (n = 5 participants/genotype). h (Left) Schematic of putative androgen-responsive elements in the promoter of Lsd1 and Prmt6. (Right) Chromatin-immunoprecipitation assays of AR occupancy at androgen-responsive elements (red bar) in C2C12 myoblasts expressing AR24Q or AR100Q treated with vehicle or DHT (10 nM, 12 h). Shown is one experiment representative of three technical replicates. Graphs show mean ± SEM; two-way ANOVA followed by Tukey HSD tests (a, c, d), or two-tailed Student t-test (b, eh). Source data are provided as a Source data file.
Fig. 2
Fig. 2. LSD1 is a co-activator of polyQ-expanded AR.
a Proximity ligation assays (PLA) in MN1 cells expressing AR24Q or AR100Q treated with vehicle or DHT (10 nM, 16 h). Nuclei were detected with DAPI. Scale bar = 17 µm. Graphs show quantification of nuclei from three biological replicates (AR24Q AR/LSD1 vehicle: n = 26; AR24Q AR/LSD1 DHT: n = 43; AR24Q AR/PRMT6 vehicle: n = 20; AR24Q AR/PRMT6 DHT: n = 8; AR100Q AR/LSD1 vehicle: n = 76; AR100Q AR/LSD1 DHT: n = 61; AR100Q AR/PRMT6 vehicle: n = 66; AR100Q AR/PRMT6 DHT: n = 43). b Transcriptional assays in HEK293T cells expressing AR24Q or AR65Q alone (mock) or together with LSD1 treated with vehicle or DHT (10 nM, 16 h; n = 4 biological replicates). c Transcriptional assays in MN1 cells expressing AR65Q alone (mock) or together with the indicated LSD1 isoforms treated with vehicle or DHT (10 nM, 16 h; n = 3 biological replicates). d (Top) Western blots of LSD1 levels in HEK293T cells expressing Cas9 with or without specific guides to silence LSD1 (n = 7 biological replicates). *** g1 p = 0.00016, g2 p = 0.00017, g3 p = 0.00016. (Bottom) Transcriptional assays in Cas9 and g1, g2, g2 + 3 cells expressing AR24Q or AR65Q treated with DHT (10 nM, 16 h; n = 3 biological replicates). e (Top) Western blots of LSD1 levels in MN1 cells expressing Cas9 with or without a specific guide (g4) to silence Lsd1 (n = 5 biological replicates). ** g4 in AR24Q cells p = 0.0065, ** g4 in AR100Q cells p = 0.0054. (Bottom) Transcriptional assays in Cas9 and g4 cells expressing AR24Q or AR100Q and treated with DHT (10 nM, 16 h; n = 3 biological replicates). LSD1, PRMT6, and AR were detected with specific antibodies, and β-Tub was used as loading control. Graphs show mean ± SEM; two-tailed Student t-test (a, e—transcriptional assays), or two-way (b, c, e—Western blot), or one-way (d) ANOVA followed by Tukey HSD tests. Source data are provided as a Source data file.
Fig. 3
Fig. 3. LSD1 requires the AR AF-2 surface and its catalytic activity to transactivate AR.
a Scheme of AR and LSD1 modular domains and specific motifs. Numbers refer to AR NM_000044 and LSD1 NM_001009999. NTD, amino-terminal domain; DBD, DNA-binding domain; LBD, ligand-binding domain; AOD, amine oxidase domain; CTD, carboxy-terminal domain. b Transcriptional assay in HEK293T cells expressing AR55Q or the AF-2 mutant AR55Q-E897K, alone (mock) or with LSD1. Cells were treated with DHT (10 nM, 16 h; n = 3 biological replicates). c (Left) Transcriptional assay in HEK293T cells expressing AR65Q alone (mock) or with either LSD1 or LSD1-LXXAA. Cells were treated with DHT (10 nM, 16 h; n = 6 biological replicates mock, n = 3 biological replicates LSD1 and LSD1-LXXAA). (Right) Western blot of LSD1 and LSD1-LXXAA expression in HEK293T cells. Shown is one representative image of three biological replicates. d Transcriptional assay in HEK293T cells expressing AR65Q alone (mock) or with either LSD1 or the catalytic inactive mutant LSD1-K685A. Cells were treated with DHT (10 nM, 16 h; n = 3 biological replicates). e Transcriptional assay in HEK293T cells expressing AR65Q treated with DHT only or together with SP-2509 (100 nM) or TCP (10 μM) for 16 h (n = 3 biological replicates). f Western blot of H3K4me2 in C2C12 cells differentiated to myotubes for 10 days in the presence of DHT (10 nM). H3K4me2 was detected with a specific antibody that recognize the H3 modified K residue. H3 antibody was used as loading control (n = 4 biological replicates). Graphs show mean ± SEM; two-way (b), one-way (c, d, e) ANOVA followed by Tukey HSD tests, or two-tailed Student t-test (f). Source data are provided as a Source data file.
Fig. 4
Fig. 4. LSD1 and PRMT6 synergistically transactivate normal and polyQ-expanded AR.
a Proximity ligation assays analysis in MN1 cells expressing AR24Q or AR100Q and vectors for Lsd1 and Prmt6 silencing. Cells were treated with DHT (10 nM, 16 h). Scale bar = 17 µm. Graphs show quantification of nuclei from three independent experiments (AR24Q cells: P6/LSD1 vehicle n = 12, DHT n = 22; AR/LSD1 Cas9 scrambled n = 169, Cas9 shPrmt6 n = 198; AR/PRMT6 Cas9 scrambled n = 184, Cas9 g2 n = 237. AR100Q cells: P6/LSD1 vehicle n = 79, DHT n = 116; AR/LSD1 Cas9 scrambled n = 302, Cas9 shPrmt6 n = 190; AR/PRMT6 Cas9 scrambled n = 202, Cas9 g2 n = 164. b Western blots of MN1 cells transduced with lentiviral vectors for Lsd1 and Prmt6 silencing (n = 3 biological replicates). LSD1 g2 **p = 0.0036, g2/sh#1 *p = 0.048, g2/sh#2 **p = 0.0071. PRMT6 sh#1 ***p = 0.00001, sh#2 ***p = 0.0000004, g2/sh#1 *p = 0.011, g2/sh#2 **p = 0.003. c Immunoprecipitation of PRMT6 and immunoblotting of the indicated proteins in the skeletal muscle (quadriceps) of 24-week-old WT and knock-in AR113Q mice (n = 3 mice/genotype). d Transcriptional assays in HEK293T cells expressing AR24Q or AR65Q alone (mock) or with LSD1 and PRMT6 treated for 16 h with vehicle, DHT (10 nM), TCP (10 μM), or Adox (10 μM) (AR24Q: n = 7 vehicle, n = 3 TCP, Adox, TCP + Adox. AR65Q: n = 7 vehicle, n = 4 TCP, Adox, TCP + Adox). e (Left) Transcriptional assay in HEK293T cells expressing AR24Q or AR65Q with or without CRISPR guides to silence Lsd1 and Prmt6 (n = 3 biological replicates). (Right) Western blot of PRMT6 levels in HEK293T expressing Cas9 alone or together with guides to silence PRMT6 (n = 3 biological replicates). Cas9/g1 ***p = 0.00048, Cas9/g2 ***p = 0.00056.AR, LSD1, and PRMT6 were detected with specific antibodies, and β-Tub and CNX were used as loading controls. Graphs show mean ± SEM; two-tailed Student t-test (a, b) or one-way ANOVA followed by Tukey HSD tests (d, e). Source data are provided as a Source data file.
Fig. 5
Fig. 5. Silencing of LSD1 and PRMT6 together suppresses polyQ-expanded AR neurotoxicity.
a Analysis of the eye phenotype in flies expressing EGFP, AR0Q, or AR52Q with or without RNAi to silence dLsd1 and the PRMT6 fly ortholog Dart8. Shown are representative images from 10–15 flies/genotype. b RT-PCR analysis of dLsd1 mRNA transcript levels normalized to tubulin (n = 3 flies/genotype). c Disease severity in AR52Q flies with or without dLsd1 and Dart8 silencing (n = 15 AR52Q; n = 16 AR52Q dLsd1 RNAi and AR52Q Dart8 RNAi; n = 12 AR52Q dLsd1 RNAi/Dart8 RNAi). Graphs show mean ± SEM; two-tailed Student t-test (b) or one-way ANOVA followed by Tukey HSD test (c). Source data are provided as a Source data file.
Fig. 6
Fig. 6. miRNA strategy to silence Lsd1 and Prmt6 in vivo.
a Western blots of LSD1 and PRMT6 in MN1 cells transfected with vectors expressing scramble amiR or amiR to silence Lsd1 and Prmt6. Shown is one experiment representative of three biological replicates. b Cell viability assay in MN1 cells expressing either AR24Q or AR100Q transfected as indicated (amiR-Lsd1#1, amiR-Prmt6#6) and treated with DHT (10 nM, 48 h; n = 3 biological replicates). c Schematic of AAV9 vector expressing GFP and amiR-Lsd1#1/Prmt6#6 (amiR-Lsd1/Prmt6). ITR, inverted terminal repeat; WPRE, woodchuck hepatitis virus post-transcriptional regulatory element; pA, poly-adenylation site. Figure was in part generated using pictures from Servier Medical Art licensed under a Creative Commons Attribution 3.0 Unported License (https://creativecommons.org/licenses/by/3.0/) and in part created with Biorender.com. d Biodistribution of viral particles in different tissues of 4-week-old WT mice (Scr-GFP-2E10 virions: n = 3 male mice; Scr-GFP-8E10 virions: n = 3 male mice for liver, heart and quadriceps; n = 2 male mice for spinal cord. e Western blots of GFP expression in the indicated tissues of WT mice transduced by AAV9-amiR. Shown is one experiment representative of three biological replicates in three mice. f RT-PCR analysis of transcript levels of Lsd1, Prmt6, mouse Ar (mAr), and human AR (hAR) in the quadriceps muscle of 13-week-old AR100Q mice with or without amiR-Lsd1/Prmt6 (Lsd1 n = 8 AR100Q and n = 7 AR100Q amiR-Lsd1/Prmt6; Prmt6 expression: n = 8 AR100Q mice and n = 8 AR100Q amiR-Lsd1/Prmt6; mAr and hAR: n = 4 mice/treatment). g Western blots of LSD1 and PRMT6 in the skeletal muscle of 13-week-old AR100Q mice treated with or without amiR-Lsd1/Prmt6. Quantification is shown at the bottom. *LSD1 p = 0.03, *PRMT6 p = 0.023 (LSD1 expression: n = 6 mice/treatment; PRMT6 expression: n = 3 mice/treatment). Shown is one representative experiment. GFP, LSD1, and PRMT6 were detected with specific antibodies, and β-Tub and CNX were used as loading controls. Graphs show mean ± SEM; two-tailed Student t-test. Source data are provided as a Source data file.
Fig. 7
Fig. 7. Silencing of Lsd1 and Prmt6 modifies gene expression in SBMA muscle.
a Venn diagrams showing intersection of differentially expressed genes (top, upregulated; bottom, downregulated; absolute fold-change >4 and adjusted p < 0.01) obtained by comparing control (AR100Q) versus amiR-treated SBMA mice; AR100Q versus WT mice; or amiR-treated versus WT mice. b Ring plot showing the number of differentially expressed genes in AR100Q versus WT mice from differential expression analysis and relative proportions of totally and partially rescued genes. c Heatmap of top 20 clusters obtained from functional enrichment analysis of rescued genes. Color is proportional to enrichment p-values. Each cluster name is based on the most statistically significant term within the cluster. d Similarity network of enriched terms. Each node represents an enriched term and is colored by cluster identifier. Node size is proportional to number of rescued genes in the term. Edge width is proportional with similarity score computed between pairs of nodes.
Fig. 8
Fig. 8. Silencing of Lsd1 and Prmt6 ameliorates the disease phenotype of SBMA mice.
a Body weight, hanging wire, and rotarod analysis of male WT and AR100Q mice treated with either vehicle or amiR-Lsd1/Prmt6 (n = 8 WT CTR, n = 10 WT amiR-Lsd1/Prmt6, n = 9 AR100Q CTR, n = 8 AR100Q amiR-Lsd1/Prmt6 mice. b NADH staining of 8-week-old mice treated as indicated (n = 1 WT CTR, n = 4 AR100Q CTR and n = 4 AR100Q amiR-Lsd1/Prmt6; n = 11,000 counted fibers/group. Scale bar = 4 μm. c RT-PCR analysis of denervation markers in 13-week-old WT CTR, AR100Q CTR, and AR100Q amiR-Lsd1/Prmt6 mice (n = 4 WT CTR, n = 9 AR100Q CTR, n = 8 AR100Q amiR-Lsd1/Prmt6. d Western blots of AR in the skeletal muscle of AR100Q CTR and AR100Q amiR-Lsd1/Prmt6 mice (n = 3 mice/group). HMW, high molecular weight species. AR was detected with specific antibody and CNX was used as loading control. Graphs show mean ± SEM; two-way ANOVA followed by Fisher’s least significance difference test (a, Body weight: p = 0.008 week 9, p = 0.081 week 10, p = 0.045 week 11. Hanging wire: p = 0.058 week 12, p = 0.001 week 13. Rotarod: p = 0.036 week 9, p = 0.045 week 10, p = 0.057 week 11). *p < 0.05; **p < 0.01; ***p < 0.001, # marginally significant; two-tailed Student t-test (b); one-way ANOVA followed by Tukey HSD tests (c). Source data are provided as a Source data file.
Fig. 9
Fig. 9. Silencing of human LSD1 and PRMT6 modifies gene expression and prostate cancer cell proliferation.
a Western blots of LSD1 and PRMT6 in HEK293T and LNCaP cells transfected with vectors expressing scramble amiR or amiR-LSD1 and amiR-PRMT6. Shown is one representative experiment. HEK293T cells: n = 4 biological replicates for scramble, amiR-LSD1#1 and amiR-LSD1#2; n = 3 biological replicates for amiR-PRMT6#1 and amiR-PRMT6#2. LNCaP cells: n = 3 biological replicates for all the conditions. Quantification of the levels of LSD1 (yellow) and PRMT6 (blue) is shown at the bottom. b RT-PCR analysis of the indicated genes in HEK293T transfected with vectors expressing scramble amiR or amiR-LSD1#1 and amiR-PRMT6#3 (n = 3 biological replicates). c EdU cell proliferation assay performed in LNCaP cells transduced with lentiviral vectors expressing scramble amiR or amiR-LSD1 and amiR-PRMT6 (n = 19 fields scr, n = 15 fields for amiRs from three independent experiments). Nuclei were detected with Hoechst® 33342. Scale bar = 53 μm. Graphs show mean ± SEM; one-way ANOVA followed by Tukey HSD tests (a, c), and two-tailed Student t-test (b). Source data are provided as a Source data file.
Fig. 10
Fig. 10. Working model of polyQ-expanded AR and co-regulators in SBMA muscle.
In physiological conditions, AR controls expression of target genes. PolyQ expansions result in aberrant transcription of AR co-regulators, such as LSD1 and PRMT6, which in turn increase AR transactivation, thus enhancing toxic gain-of-function. Intervention to block this feedforward mechanism ameliorates disease outcome in animal models of SBMA. Created with BioRender.

References

    1. La Spada AR, Wilson EM, Lubahn DB, Harding AE, Fischbeck KH. Androgen receptor gene mutations in X-linked spinal and bulbar muscular atrophy. Nature. 1991;352:77–79. doi: 10.1038/352077a0. - DOI - PubMed
    1. Orr HT, Zoghbi HY. Trinucleotide repeat disorders. Annu. Rev. Neurosci. 2007;30:575–621. doi: 10.1146/annurev.neuro.29.051605.113042. - DOI - PubMed
    1. Kawahara, H. A family of progressive bulbar palsy. Aichi. Med. J.16, 3–4 (1897).
    1. Kennedy WR, Alter M, Sung JH. Progressive proximal spinal and bulbar muscular atrophy of late onset. A sex-linked recessive trait. Neurology. 1968;18:671–680. doi: 10.1212/WNL.18.7.671. - DOI - PubMed
    1. Manzano R, et al. Beyond motor neurons: expanding the clinical spectrum in Kennedy’s disease. J. Neurol. Neurosurg. Psychiatry. 2018;89:808–812. doi: 10.1136/jnnp-2017-316961. - DOI - PMC - PubMed

Publication types