. 2023 Feb 6;14(1):602.
doi: 10.1038/s41467-023-36185-w.

Defective excitation-contraction coupling and mitochondrial respiration precede mitochondrial Ca2+ accumulation in spinobulbar muscular atrophy skeletal muscle

Affiliations

Defective excitation-contraction coupling and mitochondrial respiration precede mitochondrial Ca2+ accumulation in spinobulbar muscular atrophy skeletal muscle

Caterina Marchioretti et al. Nat Commun. .

Abstract

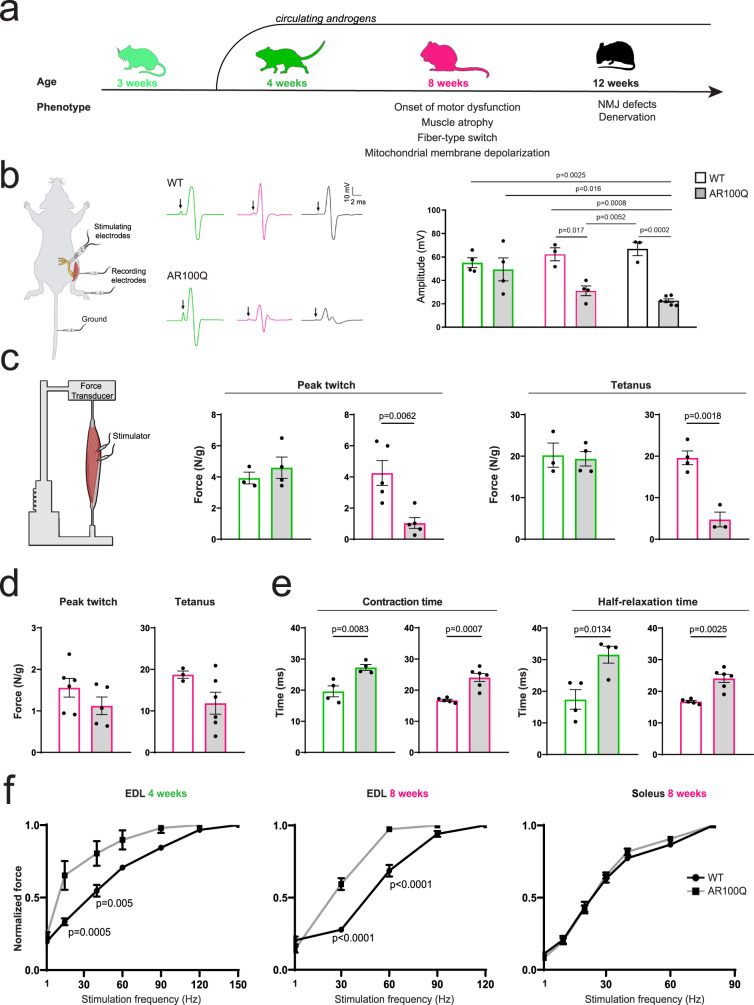
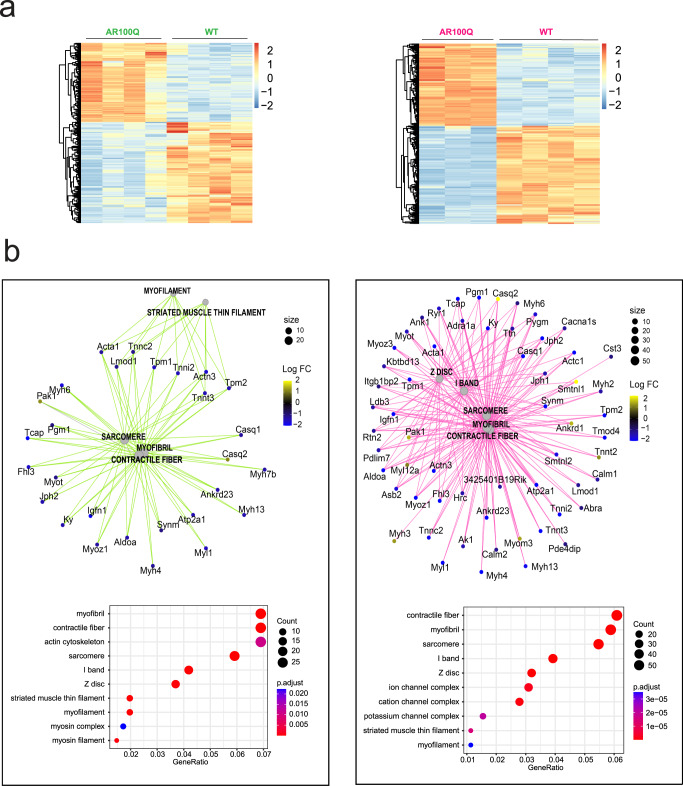
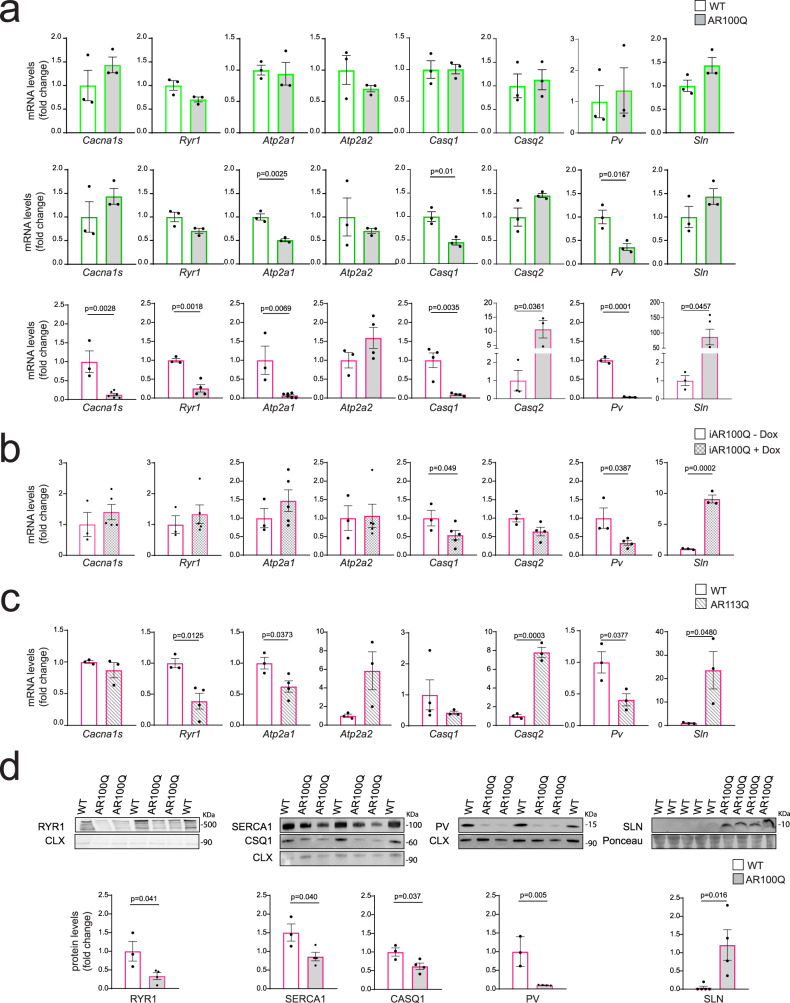
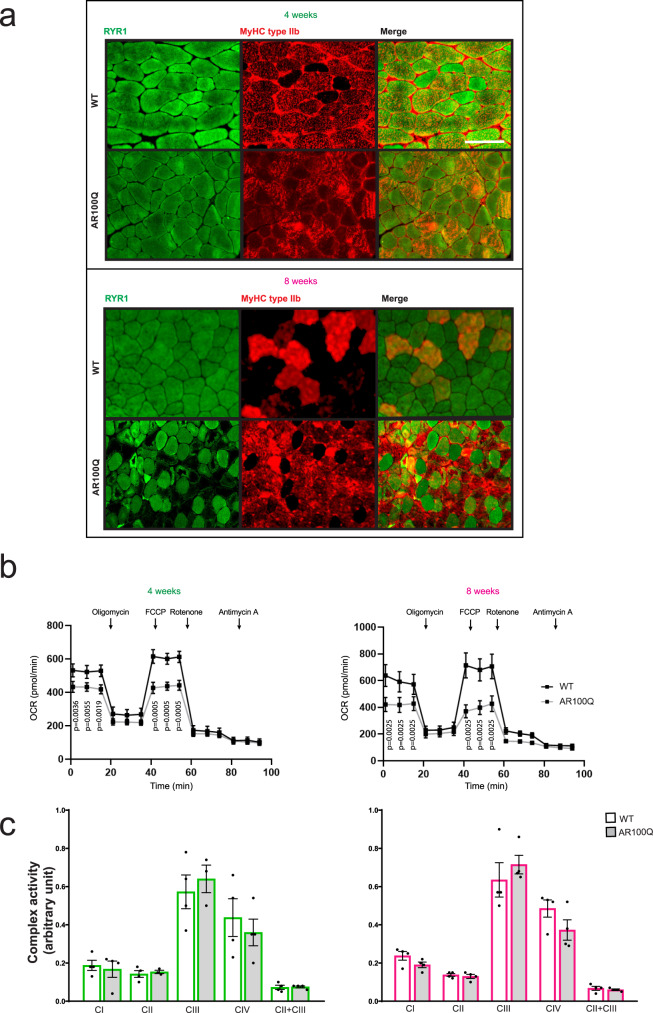
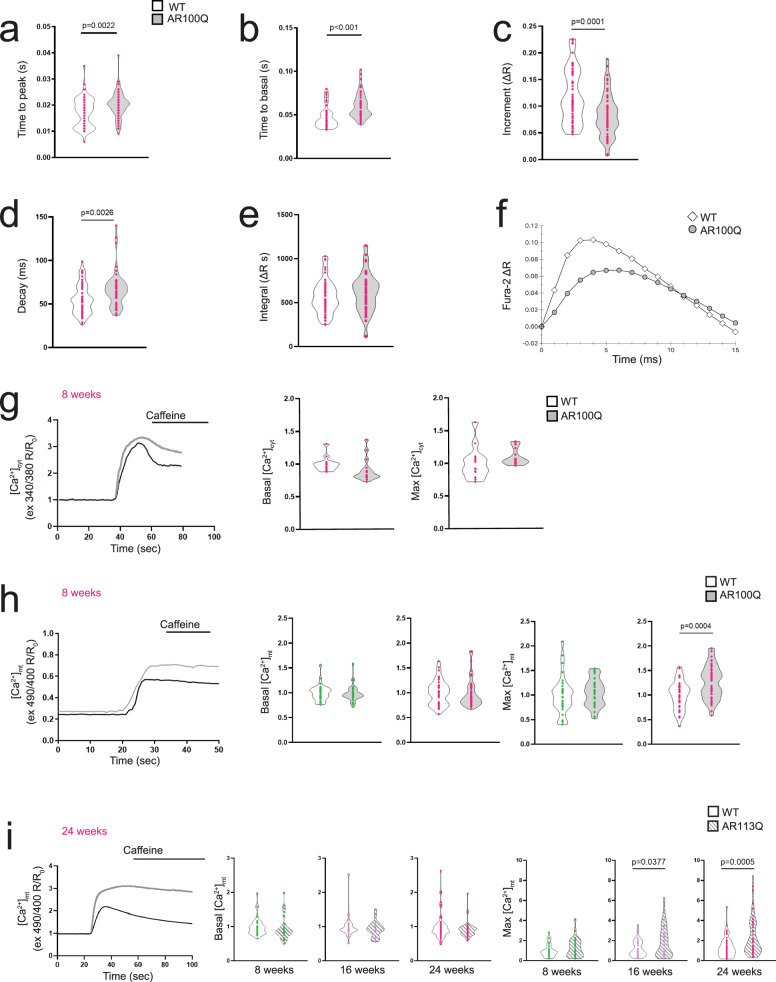
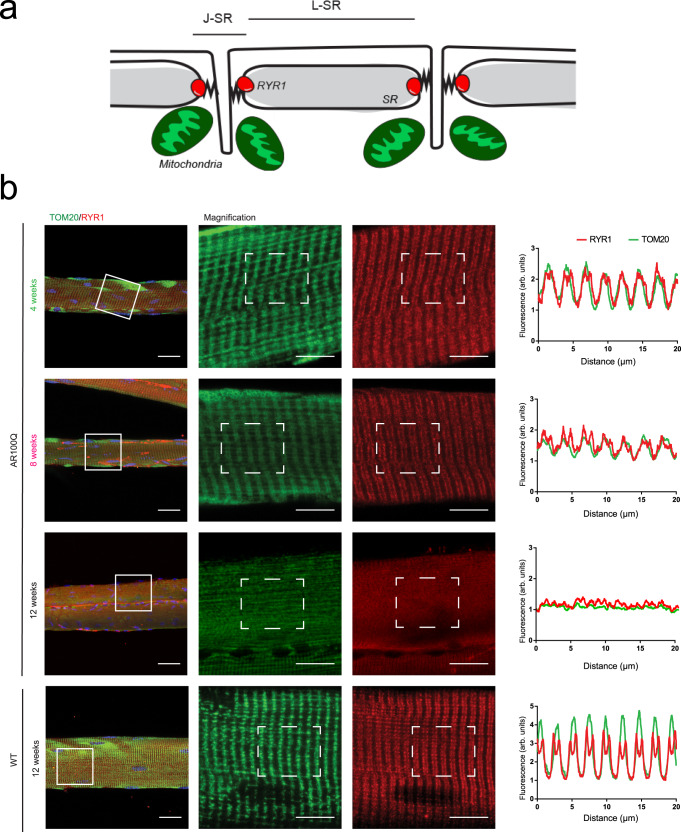
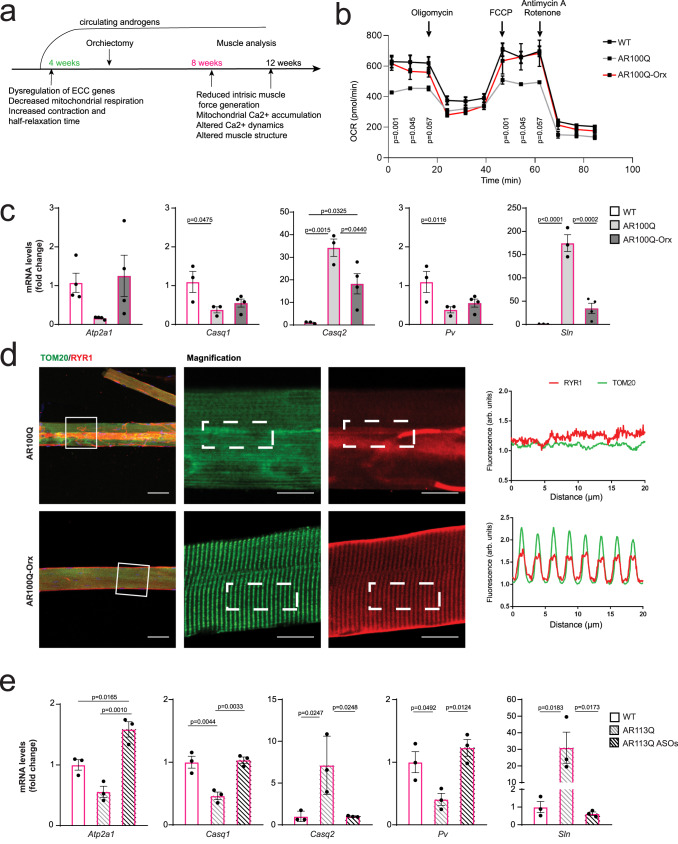
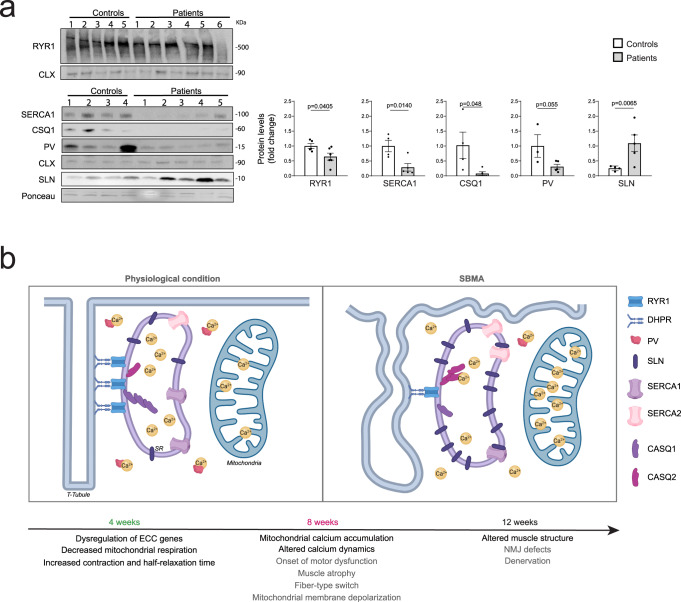
Polyglutamine expansion in the androgen receptor (AR) causes spinobulbar muscular atrophy (SBMA). Skeletal muscle is a primary site of toxicity; however, the current understanding of the early pathological processes that occur and how they unfold during disease progression remains limited. Using transgenic and knock-in mice and patient-derived muscle biopsies, we show that SBMA mice in the presymptomatic stage develop a respiratory defect matching defective expression of genes involved in excitation-contraction coupling (ECC), altered contraction dynamics, and increased fatigue. These processes are followed by stimulus-dependent accumulation of calcium into mitochondria and structural disorganization of the muscle triads. Deregulation of expression of ECC genes is concomitant with sexual maturity and androgen raise in the serum. Consistent with the androgen-dependent nature of these alterations, surgical castration and AR silencing alleviate the early and late pathological processes. These observations show that ECC deregulation and defective mitochondrial respiration are early but reversible events followed by altered muscle force, calcium dyshomeostasis, and dismantling of triad structure.


Conflict of interest statement

The authors declare no competing interests.

Figures

Fig. 1
Fig. 1. Prolonged muscle contraction/relaxation time precedes defects in intrinsic muscle force generation in SBMA mice.
a Scheme of disease progression in AR100Q-transgenic mice. We assigned a color code to distinguish three stages of the disease: green: 4 weeks of age - before the onset of motor dysfunction; magenta: 8 weeks of age - the onset of motor dysfunction; black: 12 weeks of age - late stage of the disease. The phenotype was previously described. b CMAP analysis in the TA muscle of 4-week-old (green), 8-week-old (magenta), and 12-week-old (black) WT and AR100Q mice (each dot is the average of 3 measures/muscle; n = 4 mice/WT/1M; n = 4 mice/AR100Q/1M; n = 3 mice/WT/2M; n = 4 mice/AR100Q/2 M; n = 3 mice/WT/3M; n = 5 mice/AR100Q/3M;). c Generation of intrinsic force in the EDL muscle of 4-week-old (green) and 8-week-old (magenta) WT and AR100Q mice (single twitch: n = 3 mice/WT/1 M; n = 4 mice/AR100Q/1M; n = 5 mice/WT/2M; n = 5 mice/AR100Q/2M; tetanus: n = 3 mice/WT/1 M; n = 4 mice/AR100Q/M; n = 4 mice/WT/2 M; n = 3 mice/AR100Q/2M). d Generation of intrinsic force in the soleus muscle of 8-week-old (magenta) WT and AR100Q mice (single twitch: n = 6 mice/WT/2 M; n = 5 mice/AR100Q/2 M; tetanus: n = 3 mice/WT/2M; n = 6 mice/AR100Q/2M). e Peak contraction and half-relaxation time in the EDL muscle of 4-week-old (green) and 8-week-old (magenta) WT and AR100Q mice (contraction time: n = 4 mice/WT/1 M; n = 4 mice/AR100Q/1M; n = 5 mice/WT/2 M; n = 6 mice/AR100Q/2 M; half-relaxation time: n = 4 mice/WT/1 M; n = 4 mice/AR100Q/1M; n = 5 mice/WT/2 M; n = 5 mice/AR100Q/2M). f Intrinsic muscle force/frequency in the indicated muscles of WT and AR100Q mice (EDL: n = 3 mice/WT/1M; n = 4 mice/AR100Q/1M; n = 5 mice/WT/2M; n = 6 mice/AR100Q/2M; Soleus: = 6 mice/genotype/2M). The graphs show the mean ± SEM; significance was tested with two-way ANOVA followed by Tukey’s HSD test (b, f) or by the two-tailed Student’s t-test (c-e). Source data are provided as a Source Data file.
Fig. 2
Fig. 2. Progressively altered expression of genes involved in sarcomere organization and muscle contraction in SBMA transgenic mice.
a Transcriptomic (RNA-seq) analysis in the quadriceps muscle of 4-week-old (green) and 8-week-old (magenta) AR100Q mice and WT mice (n = 4 mice/WT/1M; n = 4 mice/AR100Q/1M; n = 3 mice/WT/2M; n = 4 mice/AR100Q/2M). b Gene Ontology analysis of differentially expressed genes in the category “cellular component”.
Fig. 3
Fig. 3. Altered expression of the ECC genes in the muscle of SBMA mice.
ac RT-PCR analysis of the transcript levels of the indicated ECC genes normalized to beta-actin in the quadriceps muscle of a 3-week-old (light green, top row), 4-week-old (green, middle row) and 8-week-old (magenta, bottom row) WT and AR100Q mice (n = 3 mice/genotype/p20-1M; Cacna1s/Atp2a1: n = 3 mice/WT/2M, n = 6 mice/AR100Q/2M; Ryr1/Atp2a2: n = 3 mice/WT/2M, n = 4 mice/AR100Q/2M; Casq1: n = 4 mice/WT/2 M, n = 4 mice/AR100Q/2M; Casq2/Pv/Sln: n = 3 mice/WT/2M, n = 3 mice/AR100Q/2M). b 8-week-old iAR100Q mice treated with doxycycline (1 g/L), (Cacna1s/Ryr1/Atp2a1/Atp2a2/Casq1: n = 3 mice/WT, n = 5 mice/iAR100Q; Casq2/Pv: n = 3 mice/WT, n = 4 mice/iAR100Q; Sln: n = 3 mice/WT, n = 2 mice/iAR100Q); c 24-week-old knock-in AR113Q mice (Cacna1s/Casq2/Pv/Sln: n = 3 mice/WT, n = 3 mice/AR113Q; Ryr1/Atp2a1/Atp2a1: n = 3 mice/WT, n = 3 mice/AR113Q; Casq1: n = 4 mice/WT, n = 3 mice/AR113Q). d Western blot analysis of the indicated ECC genes in the quadriceps muscle of 8-week-old WT and AR100Q mice (RYR1/SERCA1/CASQ1/PV: n = 3 mice/WT, n = 4 mice/AR100Q; SLN: n = 5 mice/WT, n = 4 mice/AR100Q). ECC genes were detected with specific antibodies, and calnexin (CNX) or Ponceau S were used as a loading control. The quantification (total/CNX, or SLN/Ponceau S) normalized to each control set as 1 is shown at the bottom of each panel. The graphs show the mean ± SEM; significance was tested by the two-tailed Student’s t-test. Source data are provided as a Source Data file.
Fig. 4
Fig. 4. Early defects in mitochondrial respiration in the muscle of SBMA mice.
a Immunofluorescence analysis of RYR1 (green) and MyHC type IIb (red) expression in the quadriceps of WT and AR100Q mice (n = 3 mice/genotype/age). Representative images are shown. Bar, 40 μm. b Analysis of the OCR in FDB-isolated fibers from 4- and 8-week-old WT and AR100Q mice (n = 4 mice/genotype/age). Oligomycin 2 µM, carbonyl cyanide-p-trifluoromethoxyphenylhydrazone (FCCP) 0.6 µM, rotenone 1 µM, and antimycin A 1 µM. c Mitochondrial complex (C) I, II, III, and IV activity normalized to mitochondrial citrate synthase activity measured in the quadriceps of 4- and 8-week-old WT and AR100Q mice (n = 3 mice/genotype/age). The graphs show the mean ± SEM; significance was tested by two-way (b) and one-way (c) ANOVA followed by Tukey’s HSD test. Source data are provided as a Source Data file.
Fig. 5
Fig. 5. Stimulus-induced accumulation of Ca2+ in mitochondria in SBMA mice.
Analysis of Ca2+ levels in response to twitch (a, b) and tetanic (c, d) stimulation in FDB-isolated fibers of 8-week-old WT and AR100Q mice (number of myofibers derived from 3 mice/genotype: n = 65 WT and n = 66 AR100Q in a, b, and n = 58 WT and n = 53 AR100Q in c-d). e, f Analysis of Ca2+ levels in response to tetanic stimulation in fibers isolated from FDB of 8-week-old WT and AR100Q mice (n = 3 mice/genotype). The amount of Ca2+ accumulated in the cytosol during tetanic stimulation (a), calculated as the integral of the FURA_2 ratio in one second, did not show significant differences between WT and AR100Q mice. The representative ensemble average of the Ca2+ transients between consecutive stimuli (f) showed a faster increase as well as a faster decrease in WT than in AR100Q mice. gi Resting and peak Ca2+ transients in response to caffeine (10 mM) in the cytosol (cyt, g) and mitochondria (mt, h, i) in FDB-isolated myofibers from AR100Q mice (g, h) and knock-in AR113Q mice (i) and relative control mice (cyt n ≥ 12, mt n ≥ 30 measures in myofibers derived from 3 mice/genotype/age). The graphs show the mean ± SEM; significance was tested by the two-tailed Student’s t-test. Source data are provided as a Source Data file.
Fig. 6
Fig. 6. Disrupted mitochondrial organization at the Ca2+-release units in the skeletal muscle of SBMA mice.
a Schematic representation of triads and mitochondria in skeletal muscle fibers. b Immunofluorescence analysis of RYR1 (red) and TOM20 (green) expression in fibers isolated from the TA muscle of WT and AR100Q mice (n = 3 mice/genotype/age). Representative images are shown. Bar = 25 µm, magnification bar = 10 µm. The graphs show fluorescence quantification (described in the “Methods” section).
Fig. 7
Fig. 7. Surgical castration and silencing of polyQ-expanded AR in adulthood normalizes ECC gene expression, mitochondrial respiration, and sarcomere organization.
a Scheme of experiment: Orchiectomy was performed in 4–5-week-old AR100Q mice. b OCR analysis in FDB-isolated fibers of sham-operated and orchiectomized (Orx) 8-week-old WT and AR100Q mice (n = 4 mice/genotype). c RT–PCR analysis of the transcript levels of the indicated genes normalized to beta-actin transcript levels in the EDL muscle of sham-operated and AR100Q-Orx 8-week-old mice (Atp2a1: n = 4 mice/genotype, Casq1/Casq2/Pv/Sln: n = 3 mice/WT, n = 3 mice/AR100Q n = 4 mice/AR100Q-Orx). d Immunofluorescence analysis of RYR1 (red) and TOM20 (green) expression in fibers isolated from the TA muscle of sham-operated and AR100Q-Orx 12-week-old mice (n = 3 mice/genotype). Representative images are shown. Bar = 25 µm, magnification bar = 10 µm. e RT–PCR analysis of the transcript levels of the indicated genes normalized to beta-actin transcript levels in the quadriceps muscle of 26-week-old AR113Q mice treated with either vehicle or Ar-targeting ASOs (n = 3 mice/genotype). The graphs show the mean ± SEM; significance was tested by two-way (b) and one-way (c, e) ANOVA followed by Tukey HSD test. In panel (b), p values correspond to comparison between sham-operated AR100Q and AR100Q-Orx mice. There was no significant difference between AR100Q-Orx and WT mice. Source data are provided as a Source Data file.
Fig. 8
Fig. 8. Altered excitation–contraction coupling (ECC) gene expression in the muscle of SBMA patients.
a Western blotting analysis of ECC proteins in skeletal muscle biopsies derived from control subjects and SBMA patients (RYR1: n = 5 controls, n = 6 patients, CASQ/SERCA1: n = 4 controls, n = 5 patients, PV: n = 3 controls, n = 5 patients, SLN: n = 4 controls, n = 4 patients). ECC proteins were detected with specific antibodies, and calnexin (CNX) or Ponceau S was used as a loading control. The quantification (total/CNX, or SLN/Ponceau S) normalized to each control set as 1 is shown at the bottom of each panel. The graphs show the mean ± SEM; significance was tested by the two-tailed Student’s t-test. Source data are provided as a Source Data file. b Working model: In physiological conditions, PV in the cytosol and CASQ1/2 in the SR bind Ca2+. Sarcolemma depolarization results in a conformational change of DHPR, which in turn leads to Ca2+ efflux through the RYR1 from the SR to the sarcoplasm and into mitochondria. Ca2+ then is pumped back to the SR by SERCA1/2, whose function is negatively controlled by SLN. In SBMA-affected muscles, the expression of ECC proteins is altered and Ca2+ accumulates into mitochondria during muscle contraction as a function of disease progression. Age refers to AR100Q mice. In gray, pathological processes previously characterized; in black major findings shown here.

References

    1. La Spada AR, Wilson EM, Lubahn DB, Harding AE, Fischbeck KH. Androgen receptor gene mutations in X-linked spinal and bulbar muscular atrophy. Nature. 1991;352:77–79. doi: 10.1038/352077a0. - DOI - PubMed
    1. Kennedy WR, Alter M, Sung JH. Progressive proximal spinal and bulbar muscular atrophy of late onset. A sex-linked recessive trait. Neurology. 1968;18:671–680. doi: 10.1212/WNL.18.7.671. - DOI - PubMed
    1. Pennuto M, Rinaldi C. From gene to therapy in spinal and bulbar muscular atrophy: are we there yet? Mol. Cell Endocrinol. 2018;465:113–121. doi: 10.1016/j.mce.2017.07.005. - DOI - PubMed
    1. Chevalier-Larsen ES, et al. Castration restores function and neurofilament alterations of aged symptomatic males in a transgenic mouse model of spinal and bulbar muscular atrophy. J. Neurosci. 2004;24:4778–4786. doi: 10.1523/JNEUROSCI.0808-04.2004. - DOI - PMC - PubMed
    1. Chivet, M. et al. Polyglutamine-expanded androgen receptor alteration of skeletal muscle homeostasis and myonuclear aggregation are affected by sex, age and muscle metabolism. Cells9, cells9020325. 10.3390/cells9020325 (2020). - PMC - PubMed

Publication types