. 2023 Feb 6;14(1):638.
doi: 10.1038/s41467-023-36298-2.

The p97-UBXD8 complex regulates ER-Mitochondria contact sites by altering membrane lipid saturation and composition

Affiliations

The p97-UBXD8 complex regulates ER-Mitochondria contact sites by altering membrane lipid saturation and composition

Rakesh Ganji et al. Nat Commun. .

Abstract

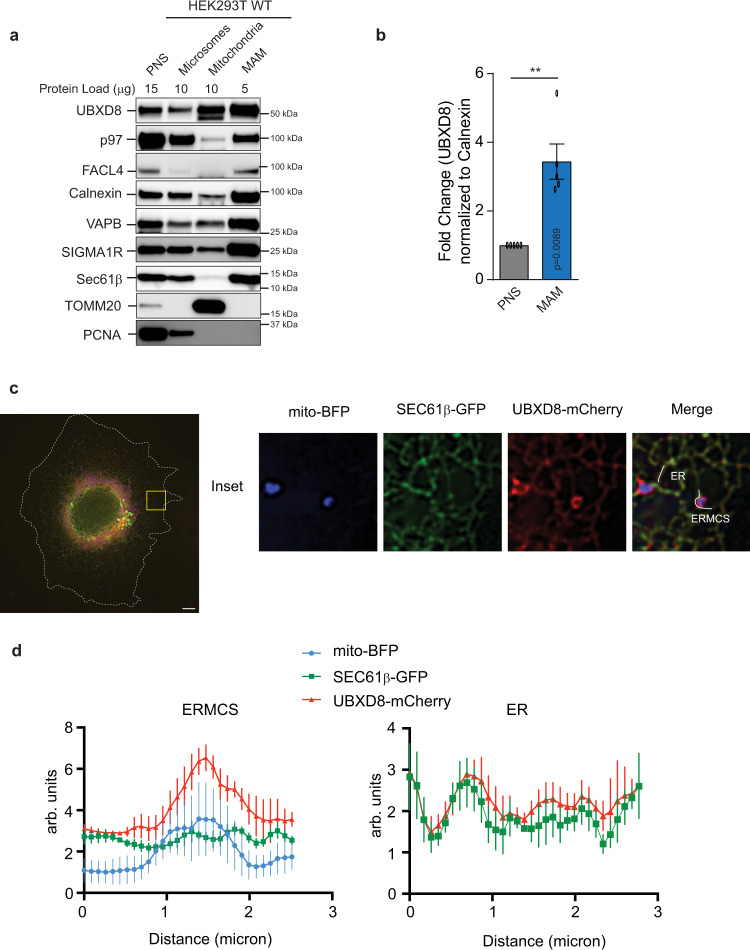
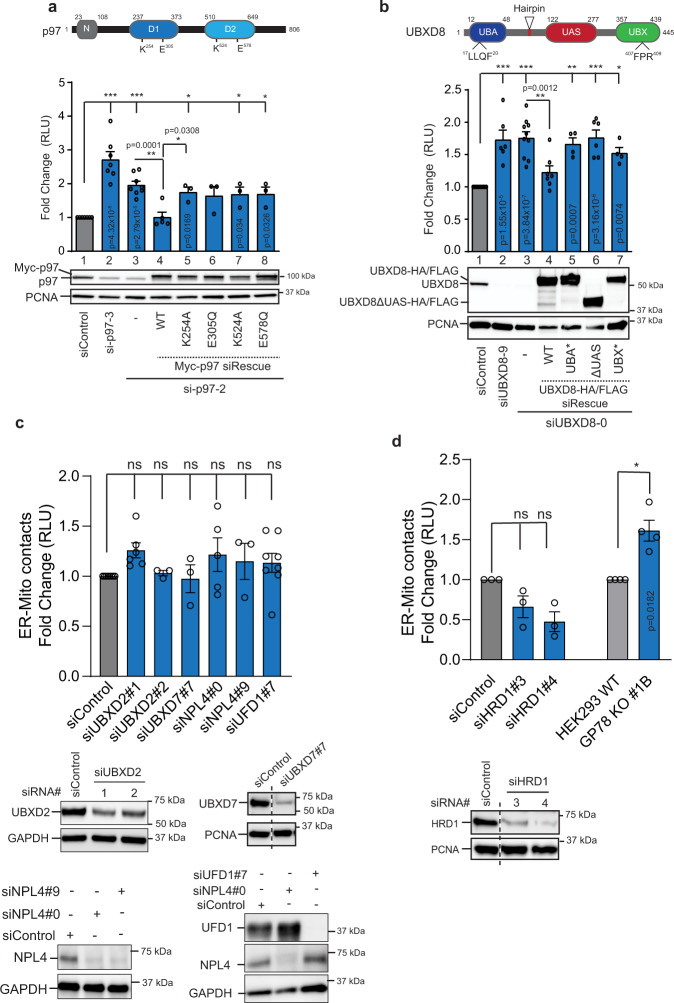
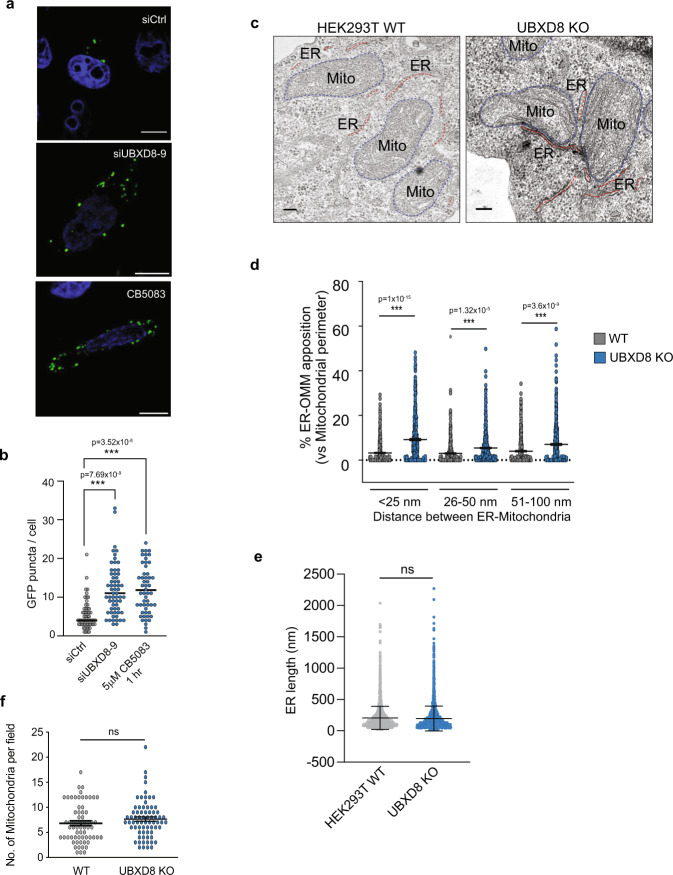
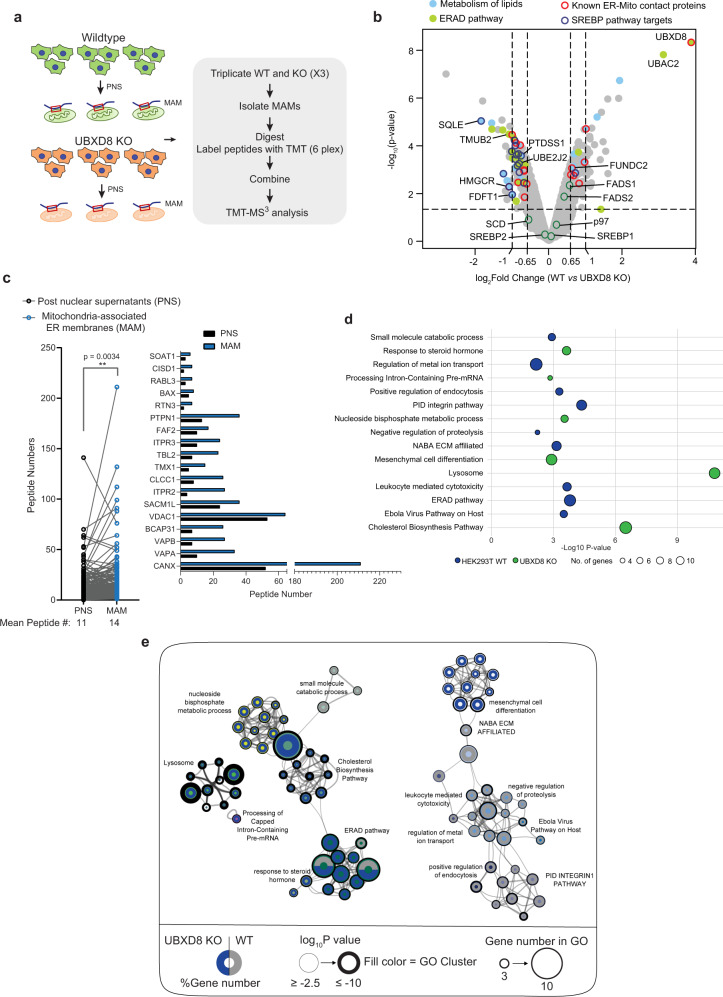
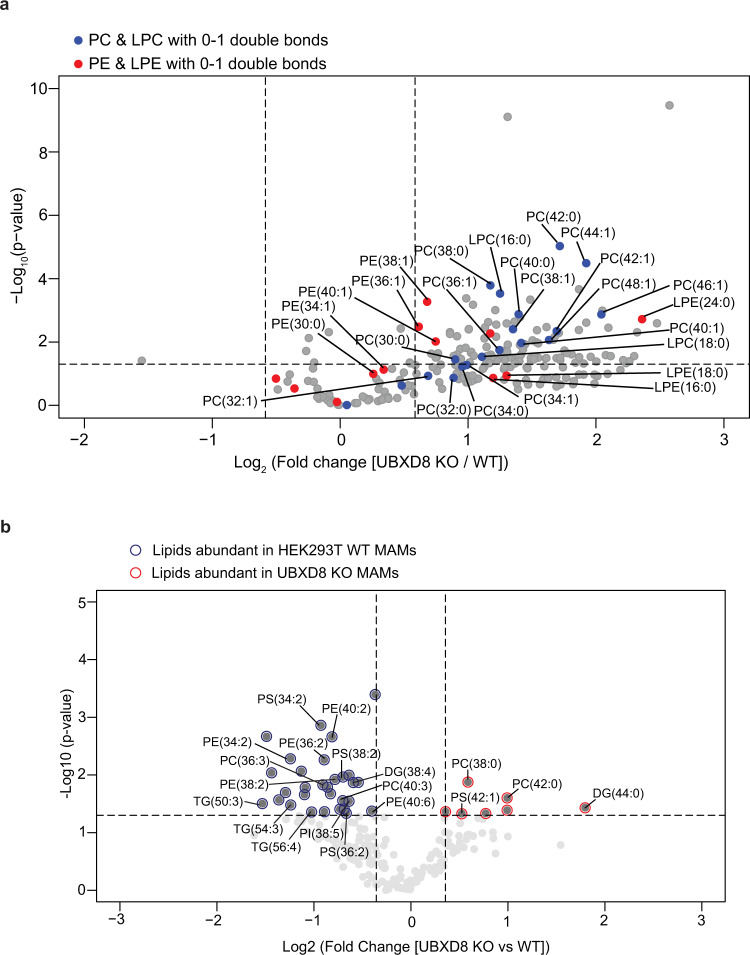
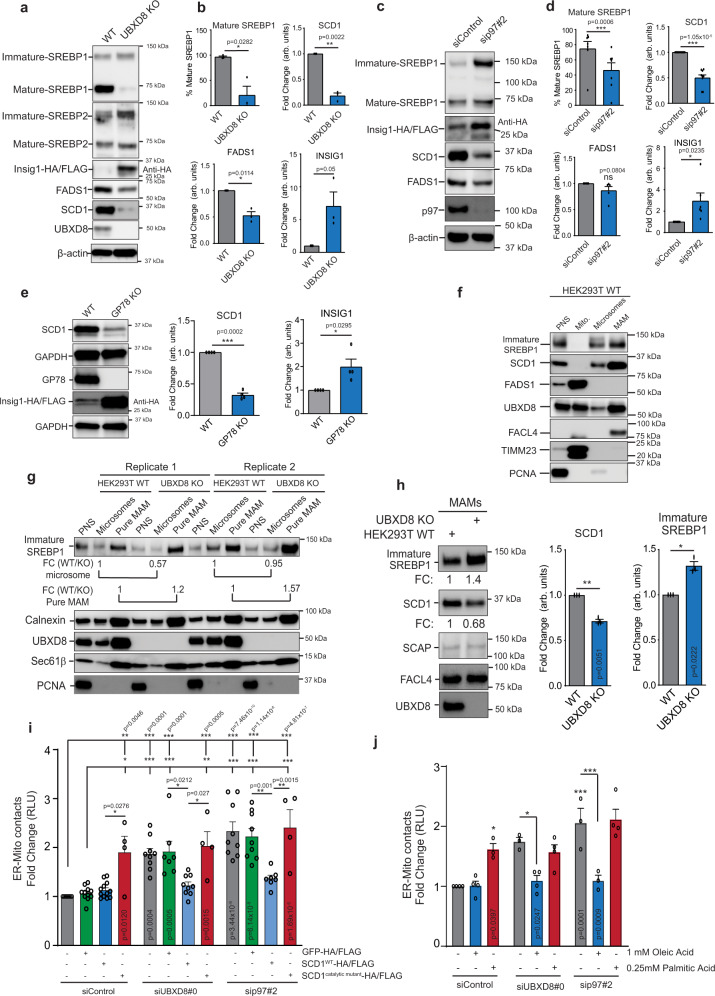
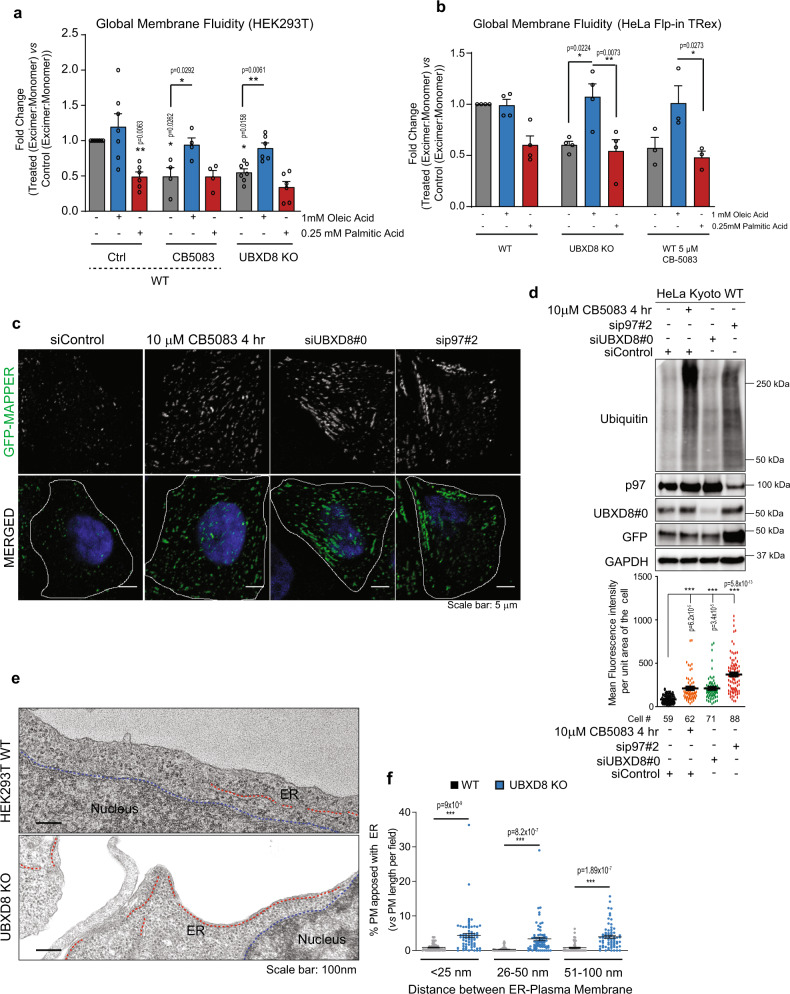
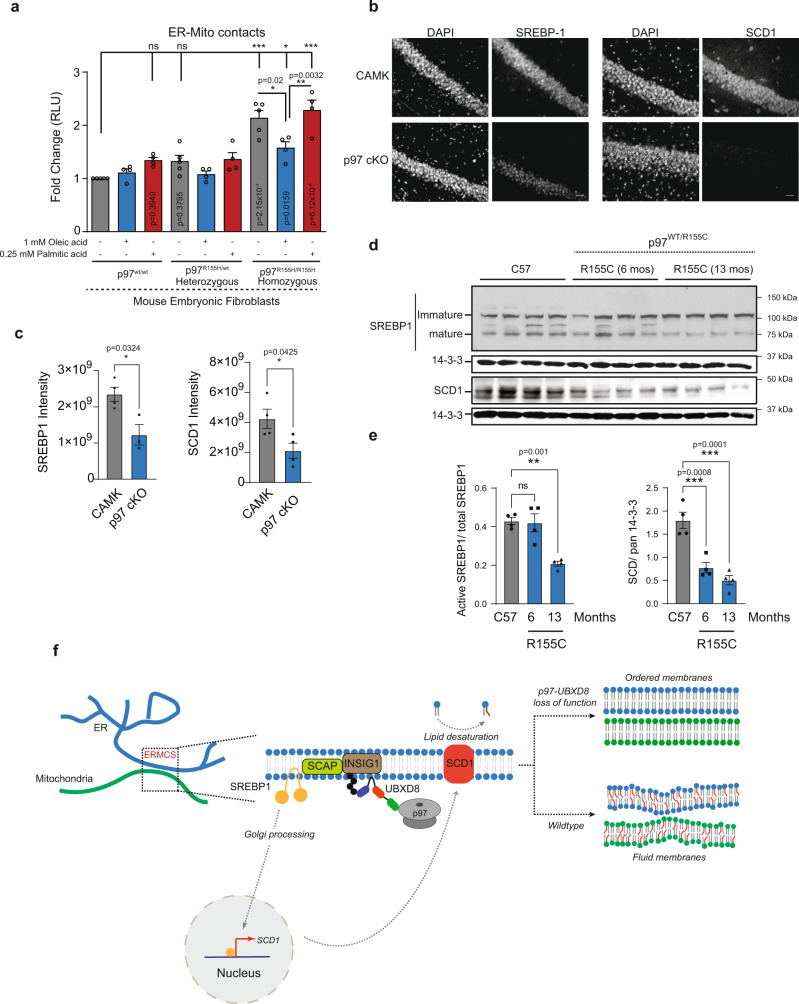
The intimate association between the endoplasmic reticulum (ER) and mitochondrial membranes at ER-Mitochondria contact sites (ERMCS) is a platform for critical cellular processes, particularly lipid synthesis. How contacts are remodeled and the impact of altered contacts on lipid metabolism remains poorly understood. We show that the p97 AAA-ATPase and its adaptor ubiquitin-X domain adaptor 8 (UBXD8) regulate ERMCS. The p97-UBXD8 complex localizes to contacts and its loss increases contacts in a manner that is dependent on p97 catalytic activity. Quantitative proteomics and lipidomics of ERMCS demonstrates alterations in proteins regulating lipid metabolism and a significant change in membrane lipid saturation upon UBXD8 deletion. Loss of p97-UBXD8 increased membrane lipid saturation via SREBP1 and the lipid desaturase SCD1. Aberrant contacts can be rescued by unsaturated fatty acids or overexpression of SCD1. We find that the SREBP1-SCD1 pathway is negatively impacted in the brains of mice with p97 mutations that cause neurodegeneration. We propose that contacts are exquisitely sensitive to alterations to membrane lipid composition and saturation.


Conflict of interest statement

The authors declare no competing interests.

Figures

Fig. 1
Fig. 1. UBXD8 is enriched at ERMCS.
a Immunoblot of the indicated proteins from subcellular fractionation of HEK293T cells. PNS post-nuclear supernatant, MAM mitochondria-associated membrane (n > 3 biologically independent samples). b Quantification plot showing the enrichment of UBXD8 in MAMs from a as normalized to calnexin. (n = 5 biologically independent samples). Data are means ± SEM (**P < 0.01, two-tailed paired t test). c Confocal microscopy showing enrichment of UBXD8 at ERMCS using Cos-7 cells transiently transfected with mito-BFP, SEC61β, and mCherry-UBXD8. Insets depict the zoomed in images. Scale bar, 10 μm. d Representative line-scan analyses of c showing the enrichment of mCherry-UBXD8 at ERMCS relative to SEC61β at ER as determined from n = 5 independent cells. Source data are provided as a Source data file.
Fig. 2
Fig. 2. siRNA-mediated repression of p97 and UBXD8 results in increased ERMCS.
a Top: Domain organization of p97 and indicated mutations, Middle: Split luciferase assay to measure contacts in HEK293T cells transfected with siRNAs to p97 and indicated N-Myc siRNA-resistant rescue constructs, RLU relative luminescence unit, Bottom: Immunoblot of indicated proteins (n = 9, 7, 8, 5, 3, 3, 3, and 3 biologically independent samples from left to right, respectively). b Top: Domain organization of UBXD8 and indicated mutations, Middle: Split luciferase assay to measure contacts in HEK293T cells transfected with siRNAs to UBXD8 and indicated C-HA/FLAG siRNA-resistant rescue constructs, RLU relative luminescence unit, Bottom: Immunoblot of indicated proteins. UBA ubiquitin associated, UAS upstream activating sequence, UBX ubiquitin X. (n = 10, 6, 10, 7, 4, 6, & 4 biologically independent samples from left to right, respectively). c Top: Split luciferase assay to measure contacts in HEK293T cells transfected with the indicated siRNAs against the p97 adapters. (n = 8, 6, 3, 3, 5, 3, and 8 biologically independent samples from left to right, respectively). Bottom: Immunoblot of HEK293T cells transfected with indicated siRNAs. d Top: Split luciferase assay to measure contacts in HEK293T cells transfected with two independent siRNAs against HRD1 or in HEK293 WT or GP78 KO cells. (n = 3 biologically independent samples of siControl, siHRD1#3, and siHRD1#4; n = 4 biologically independent samples of WT and GP78 KO). Bottom: Immunoblot of HEK293T cells transfected with indicated siRNAs. Data are means ± SEM. *, **, ***P < 0.05, 0.01, 0.0001 respectively, ns: not significant, one-way ANOVA with Tukey’s multiple comparison test (a, b, d: siControl vs siHRD1); one-way ANOVA with Dunnett’s multiple comparisons test (c); Two-tailed paired t test for d: HEK293 WT vs GP78 KO #1B. Source data are provided as a Source data file.
Fig. 3
Fig. 3. UBXD8 knock out or p97 inhibition results in increased ERMCS.
a Representative microscopy images showing ERMCS as depicted by formation of fluorescent GFP puncta at ERMCS by split-GFP-based contact site sensor (SPLICS) system comprising OMM-GFP1-11 and ER-short-GFPβ11). Scale bar, 10 μm. b Quantification of GFP puncta per cell as a proxy for ERMCS upon siRNA-mediated repression of UBXD8 or p97 inhibition by small molecule inhibitor, CB5083 (5 μM, 1 h). (Cell numbers used for quantification: siControl = 57 cells; siUBXD8#9 = 61 cells; CB5083 = 52 cells, across n = 3 biologically independent samples). c Representative TEM micrographs of wildtype and UBXD8 KO HEK293T cells illustrating contacts between ER (red dotted line) and mitochondria (blue-dotted line). d Quantification of contact length between ER and mitochondria in each genotype from c. e Quantification of ER lengths per field from TEM of wildtype and UBXD8 KO cells from c. f Quantification of number of mitochondria per field from TEM of wildtype and UBXD8 KO cells from c. Measurements in df are from n = 3 biological replicates with WT = 50 cells from 65 fields and UBXD8 KO = 53 cells from 71 fields. OMM: Outer mitochondrial membrane. Data are means ± SEM. *, **, ***P < 0.05, 0.01, 0.0001 respectively, one-way ANOVA with Tukey’s multiple comparison test (b, d); two-tailed unpaired t test with Welch’s correction (e, f). Scale bar, 100 nm (c). Source data are provided as a Source data file.
Fig. 4
Fig. 4. Quantitative proteomics identifies a role for UBXD8 in regulating lipid metabolism at ERMCS.
a Schematic of tandem mass tag (TMT) proteomic workflow from wildtype and UBXD8 KO HEK293T cells. PNS post-nuclear supernatant, MAM mitochondria-associated membrane. b Volcano plot of the (−log10-transformed P value vs the log2-transformed ratio of wildtype/UBXD8 KO) proteins identified from MAM fractions of HEK293T cells. n = 3 biologically independent samples for each genotype. P values were determined by empirical Bayesian statistical methods (two-tailed t test adjusted for multiple comparisons using Benjamini–Hochberg’s correction method) using the LIMMA R package; for parameters, individual P values and q values, see Supplementary Dataset 1. c Left panel: Scatter plot of one-to-one comparison of the peptide numbers identified from TMT proteomics in (b and Supplementary Fig. 4b) for known MAM proteins between PNS (black circle) vs MAM (blue circle) fractions (**P < 0.01, two-tailed paired t test). Right: Bar graph of peptide numbers identified for well-established ERMCS proteins identified in MAM fractions (blue bar) as compared to PNS fractions (black bar). d Bubble plot representing significantly enriched GO clusters identified from TMT proteomics of MAM fractions in wildtype (blue) or UBXD8 KO (green) cells (a, b, e). Size of the circle indicates the number of genes identified in each cluster. e Network of differentially enriched terms shown as clustered functional ontology categories. Each node represents a functional ontology term enriched in the TMT data (a, b) as scored by Metascape. Networks were generated using Cytoscape v3.8.2. Size of node represents number of genes identified in each term by gene ontology (GO). Gray and blue donuts represent percent of genes identified in each GO term in wildtype or UBXD8 KO respectively. Node outline thickness represents −log10-transformed P value of each term. The inner circle color of each node indicates the corresponding functional GO cluster. Default settings on Metascape were used to perform accumulative hypergeometric statistical test to calculate the P values (d, e).
Fig. 5
Fig. 5. Quantitative lipidomics of MAMs identifies a role for UBXD8 in regulating fatty acid composition at ERMCS.
a, b Volcano plot of the (−log10 transformed P value vs the log2-transformed ratio of UBXD8 KO: wildtype) total phospho- and neutral lipid species identified using lipidomics of whole cell extracts (a) or MAM fractions (b) of HEK293T cells. PC, LPC species (blue filled circles) and PE, LPE species (red filled circles) with saturated or monounsaturated fatty acid tails are labeled in a. Lipid species with saturated or monounsaturated fatty acid tails (red outline) or polyunsaturated fatty acid tails (blue outline) are labeled in the lipidomics of MAM fractions in b. Lipids were measured by LC-MS/MS following normalization by total protein amount. (n ≥ 3 biologically independent experiments were performed, each with duplicate samples). Statistical analysis was performed on the log transformed relative fold change values (UBXD8 KO relative to WT) using independent two-tailed t tests and Benjamini–Hochberg correction in R stats package (P values are listed in Supplemental Dataset 2). PC phosphatidyl choline, LPC lysophosphatidyl choline, LPE lysophosphatidyl ethanolamine, PE phosphatidyl ethanolamine, PI phosphatidylinositol, PS phosphatidylserine, DG diacylglycerol, TG triacylglycerol.
Fig. 6
Fig. 6. Loss of SREBP1 activation and SCD1 expression upon p97-UBXD8 depletion is responsible to ERMCS defects.
ae Immunoblot and the corresponding band intensity quantifications of indicated proteins in the SREBP pathway in wildtype and UBXD8 KO HEK293T cells (a, b), p97-siRNA depleted cells (c, d) or HEK293 WT and GP78 KO cells (e). All samples were transfected with INSIG1-HA/FLAG due to lack of reliable antibodies to the endogenous protein. (For b: n = 3; for d: n = 7 (mature SREBP1), n = 9 (SCD1), and n = 5 (FADS1 and INSIG1); for e: n = 4 biologically independent samples). f Immunoblot of indicated SREBP pathway proteins from subcellular fractionation of HEK293T cells. PNS post-nuclear supernatant, Mito mitochondria, MAM mitochondria-associated membrane. (n = 3 biologically independent samples). g Immunoblot of indicated proteins from subcellular fractionation of HEK293T cells. PNS post-nuclear supernatant, MAM mitochondria-associated membrane. Corresponding fold changes in band intensities (FC: WT vs UBXD8 KO) of immature SREBP1 normalized to calnexin is shown below immature SREBP1 blot (n = 2 biologically independent samples). h Immunoblot of indicated SREBP pathway proteins from subcellular fractionation of wildtype and UBXD8 KO HEK293T cells, MAM mitochondria-associated membrane. (n = 3 biologically independent samples). Corresponding fold changes in band intensities (FC: UBXD8 KO vs WT) of SREBP1 and SCD1 normalized to FACL4 is shown. i Split luciferase assay in HEK293T cells transfected with the indicated siRNAs and wildtype or catalytically dead SCD1. GFP-HA/FLAG was transfected as a negative control. RLU relative luminescence unit. (n = 11, 11, 12, 4, 9, 7, 9, 4, 9, 9, 7, and 4 biologically independent samples from left to right, respectively). j Split luciferase assay in HEK293T cells transfected with the indicated siRNAs and treated with either monounsaturated oleic acid or saturated palmitic acid. RLU relative luminescence unit. (n = 4, 4, 3, 3, 4, 4, 3, 3, and 4 biologically independent samples from left to right, respectively). Data are means ± SEM. *, **, ***P < 0.05, 0.01, 0.0001, respectively. One-tailed paired t test (b, d, e), two-tailed paired t test (h) or one-way ANOVA with Tukey’s multiple comparison test (i, j). Source data are provided as a Source data file.
Fig. 7
Fig. 7. Depletion of p97-UBXD8 alters global membrane fluidity and ER–PM contacts.
a, b Global membrane fluidity was measured using a pyrene-based lipid probe in wildtype and UBXD8 KO HEK293T cells (a) or HeLa-FlpIN-TRex cells (b). Wildtype cells were also treated with 5 μM of the p97 inhibitor CB-5083 for 4 h. Cells were supplemented with indicated concentrations of oleic acid and palmitic acid for 4 h. The fold change (Treatedexcimer:monomer vs Controlexcimer:monomer) of the ratio of excimer (Em. Max. 460 nm) to monomer (Em max. 400 nm) fluorescence is indicated. Fold changes <1 indicate more ordered lipid bilayers relative to wildtype untreated control. (For a: n = 8, 7, 6, 4, 4, 4, 7, 6, and 6 biologically independent samples from left to right, respectively; for b: n = 4, 4, 4, 4, 4, 4, 3, 3, and 3 biologically independent samples from left to right, respectively). c Representative fluorescence microscopy images showing the ER–PM contact sites reporter, GFP-MAPPER in HeLa Kyoto cells transfected with the indicated siRNAs for 48 h or treated with 10 μM CB5083 for 4 h. d Top: Immunoblot of indicated proteins; Bottom: Quantification of mean fluorescence intensity of GFP-MAPPER per unit area of cell for c. e Representative transmission EM micrographs of wildtype and UBXD8 KO HEK293T cells illustrating contacts between ER (red dotted line) and plasma membrane. Nucleus boundary is marked by blue dotted line. f Quantification of contact length between ER and plasma membrane in each genotype from e (measurements are from n = 3 biological replicates with WT = 50 cells from 65 fields and UBXD8 KO = 53 cells from 71 fields). Data are means ± SEM. *, **, ***P < 0.05, 0.01, 0.0001, respectively. Significance was analyzed by one-way ANOVA with Tukey’s multiple comparison test (a, b, d, f) or one-tailed Student’s t test for columns in a. Source data are provided as a Source data file.
Fig. 8
Fig. 8. p97 R155H disease mutation and conditional p97 knock out in mice recapitulates the p97-UBXD8 loss of function effect on ERMCS.
a Split luciferase assay to measure contacts in mouse embryonic fibroblasts with heterozygous or homozygous p97 R155H mutation. Cells were supplemented with indicated concentrations of oleic acid and palmitic acid for 4 h. (For a: n = 5, 4, 4, 5, 4, 4, 5, 4, and 4 biologically independent samples from left to right, respectively). b Representative SREBP1 and SCD1 staining from CA1 regions of 1 month-old control (CAMK2α) and p97 cKO mice (scale bar is 25 μm). c Quantification of fluorescence intensity of images in b. Individual points represent mean ROI intensity from each mouse, 3 or 4 animals per group. d Representative immunoblot for SREBP1 and SCD1 from cortical brain lysates of 12-month-old control (C57), or 6- and 12-month-old p97R155C/WT mice (n = 4 for each group, except for p97 cKO in SREBP1 panel (n = 3)). Pan 14-3-3 was used as housekeeping control. e Quantification of d. The ratio of mature SREBP1 to total SREBP1 is shown. SCD1 intensities are normalized to 14-3-3 levels in each lane. Individual points represent each mouse, 4 animals per group. Data are means ± SEM (*, **, ***P < 0.05, 0.01, 0.0001, respectively. Significance was analyzed by one-way ANOVA with Tukey’s multiple comparison test (a) or Dunnett’s multiple comparison (e) or two-tailed Student’s t test (c). f Model: Schematic of SREBP pathway activation. At ERMCS, UBXD8 recruits p97 to mediate the extraction and degradation of INSIG1 when it is ubiquitylated by the E3 ligase GP78. Loss of INSIG1, which is a negative regulator of SREBP1, allows translocation of cleaved SREBP1 transcription factor into the nucleus to activate expression of lipid desaturases, notably SCD1. Loss of p97-UBXD8 leads to decrease in SCD1 levels and loss of lipid desaturation resulting in membrane order and increased contacts. Source data are provided as a Source data file.

References

    1. Rowland AA, Voeltz GK. Endoplasmic reticulum-mitochondria contacts: function of the junction. Nat. Rev. Mol. Cell Biol. 2012;13:607–625. - PMC - PubMed
    1. Barazzuol L, Giamogante F, Calì T. Mitochondria associated membranes (MAMs): architecture and physiopathological role. Cell Calcium. 2021;94:102343. - PubMed
    1. Vance JE. MAM (mitochondria-associated membranes) in mammalian cells: lipids and beyond. Biochim Biophys. Acta. 2014;1841:595–609. - PubMed
    1. Kornmann B. [ERMES, a multifunctional complex connecting endoplasmic reticulum and mitochondria] Med. Sci. 2010;26:145–146. - PubMed
    1. Rowland AA, Voeltz GK. Endoplasmic reticulum–mitochondria contacts: function of the junction. Nat. Rev. Mol. Cell Biol. 2012;13:607–615. - PMC - PubMed

Publication types