. 2023 Feb 6;14(1):645.
doi: 10.1038/s41467-023-36374-7.

Establishment and validation of a plasma oncofetal chondroitin sulfated proteoglycan for pan-cancer detection

Affiliations

Establishment and validation of a plasma oncofetal chondroitin sulfated proteoglycan for pan-cancer detection

Pei-Fen Zhang et al. Nat Commun. .

Abstract

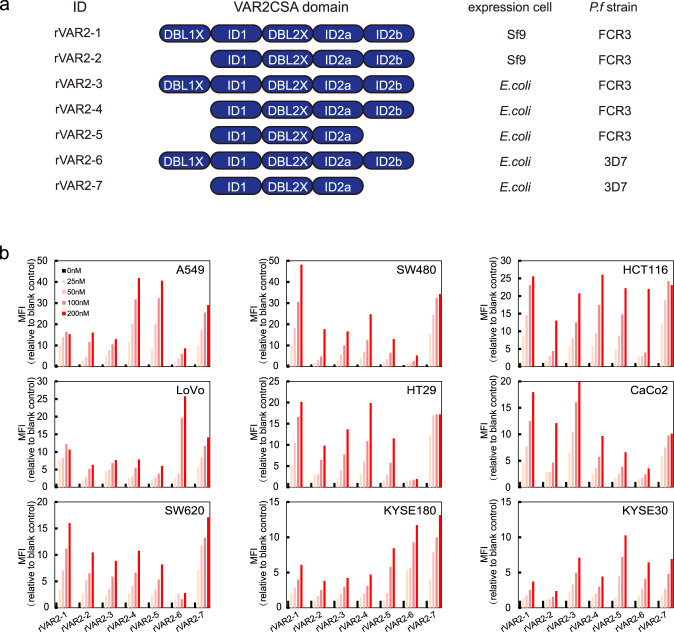
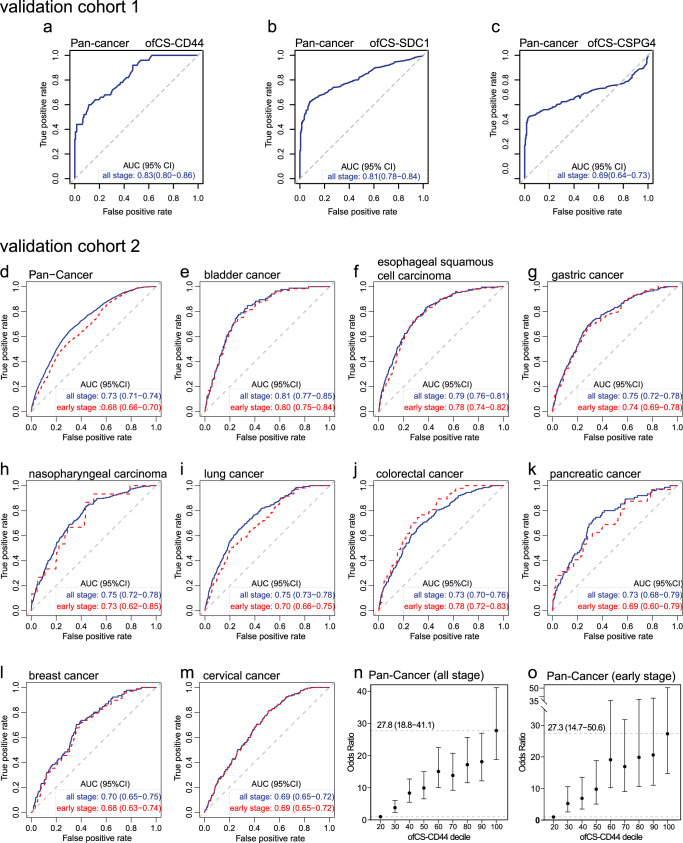
Various biomarkers targeting cell-free DNA (cfDNA) and circulating proteins have been tested for pan-cancer detection. Oncofetal chondroitin sulfate (ofCS), which distinctively modifies proteoglycans (PGs) of most cancer cells and binds specifically to the recombinant Plasmodium falciparum VAR2CSA proteins (rVAR2), is explored for its potential as a plasma biomarker in pan-cancer detection. To quantitate the plasma ofCS/ofCSPGs, we optimized an ELISA using different capture/detection pairs (rVAR2/anti-CD44, -SDC1, and -CSPG4) in a case-control study with six cancer types. We show that the plasma levels of ofCS/ofCSPGs are significantly higher in cancer patients (P values, 1.2 × 10⁻² to 4.4 × 10⁻¹⁰). Validation studies are performed with two independent cohorts covering 11 malignant tumors. The individuals in the top decile of ofCS-CD44 have more than 27-fold cancer risk (OR = 27.8, 95%CI = 18.8-41.4, P = 2.72 × 10-62) compared with the lowest 20%. Moreover, the elevated plasma ofCS-CD44 could be detected at the early stage of pan-cancer with strong dose-dependent odds risk prediction.


Conflict of interest statement

The authors declare no competing interests.

Figures

Fig. 1
Fig. 1. CSA binding ability of rVAR2.
a Schematic illustration of rVAR2 with different binding domains and the expression cell of seven rVAR2 to CSA. * rVAR2-3 was used as the detection molecular at the modified ELISA test. b Relative mean fluorescence intensity (MFI) of lung adenocarcinoma cell line (A549), colorectal carcinoma cell lines (SW480, HCT116, LoVo, HT29, CaCo2, SW620), and esophageal cell carcinoma cell lines (KYSE180 and KYSE30). Cells were incubated with serial dilution of rVAR2 as indicated and detected by flow cytometry using anti-V5-FITC.
Fig. 2
Fig. 2. Schematic of sandwich ELISA, the sensitivity and specificity to detect ofCSPGs.
a Schematic of sandwich ELISA workflow. The figure was created with Biorender.com. b Colocalization of ofCS with core proteins detected by rVAR2-3 and anti-CD44, CSPG4, and SDC1 antibodies (n = 3, biologically independent experiments). P = 0.0039 and P < 0.0001 for CD44 vs. CSPG4 and CD44 vs. SDC1 in A549, P = 0.0001 and P = 0.0025 for CD44 vs. CSPG4 and CD44 vs. SDC1 in SW480, P = 0.0549 and P = 0.0002 for CD44 vs. CSPG4 and CD44 vs. SDC1 in SW620. R = 1 represents perfect correlation. Scale bar = 10 μm. c The sensitivity of ELISA for ofCS-CD44, -CSPG4, and -SDC1 biomarkers. The cancer cell line (SW480) spiked samples were tested. d The ELISA specificity was detected by the competitive assay with gradient dilution of CSA (3.75 × 10−5–7.5 mg/mL), decorin, and chondroitinase-treated cancer cell line or plasma samples (n = 3, 2, and 2, respectively, biologically independent experiments). The chondroitinase treatment of the cancer cell line and patient plasma sample significantly reduced the rVAR2 binding (P = 0.0062 and P < 0.0001 respectively). No significant rVAR2 binding was detected in the decorin spiking sample indicating specific capture of the anti-CD44 antibody. Student t-test, all the tests were two-sided, data were shown as mean ± SD, ns. no significant, *p value <0.05, **p value <0.01, ***p value <0.001, ****p value <0.0001).
Fig. 3
Fig. 3. rVAR2 modified sandwich ELISA to detect plasma ofCS/ofCSPG in cancer patients at discovery study.
a The study designed for the development and validation of a novel plasma oncofetal chondroitin sulfated proteoglycans for pan-cancer detection. be Plasma ofCS-CD44, -SDC1, -CSPG4 and total ofCS levels (median with inter-quartile range) from healthy individuals (n = 302) versus cancer patients with tongue cancer (n = 29), esophageal squamous cell carcinoma (ESCC, n = 27), nasopharyngeal carcinoma (NPC, n = 27), clear cell renal cell carcinoma (ccRCC, n = 27), colorectal cancer (CRC, n = 26), and bladder cancer (BLCA, n = 29), respectively. P for Mann–Whitney U-test. The middle line in the boxplot displays the median, and the box indicates the first and third quartiles. Value in each figure was compared with the first group. All the tests were two-sided. fi ROC curves analysis for the diagnosis of malignant tumor patients (n = 165) from healthy individuals (n = 302) using the plasma ofCS, ofCS-CD44, -SDC1, and -CSPG4. The dotted diagonal line denotes an AUC of 0.50.
Fig. 4
Fig. 4. Validation of plasma ofCS modified CD44 in different types of the malignant tumor.
ac ROC curves analysis for the diagnosis of all stages of the pan-cancer set in validation study 1. d ROC curves analysis for the diagnosis of all stages (blue) of the pan-cancer set consisting of nine solid malignant tumor types except for hepatocellular carcinoma and early-stage patients (red) using the plasma ofCS-CD44. The dotted diagonal line denotes an AUC of 0.50. em ROC curves of all-stage (blue) and early-stage (red) bladder, esophageal squamous cell carcinoma, gastric, nasopharyngeal, lung, pancreatic, breast, and cervical cancer, respectively. n, o The OR and 95% CIs of the plasma ofCS-CD44 and cancer risk by decile at validation study for all stage patients of pan-cancer (n = 13,735) (n) and early-stage patients (n = 891) (o). Multiple logistic regression analysis was used to calculate the ORs adjusted for sex and age. All the tests were two-sided. The solid dots in the center for the error bars are the OR values, and the error bars are the corresponding 95% confidence intervals of the ORs. The dashed lines represent the OR values for samples with ofCS-CD44 ≥90% (upper line) and ofCS-CD44 <20% (lower line).

References

    1. Ignatiadis M, Sledge GW, Jeffrey SS. Liquid biopsy enters the clinic - implementation issues and future challenges. Nat. Rev. Clin. Oncol. 2021;18:297–312. - PubMed
    1. Smith RA, et al. Cancer screening in the United States, 2019: a review of current American Cancer Society guidelines and current issues in cancer screening. CA Cancer J. Clin. 2019;69:184–210. - PubMed
    1. Bast RC, Jr, Srivastava S. The National Cancer Institute Early Detection Research Network: two decades of progress. Cancer Epidemiol. Biomark. Prev. 2020;29:2396–2400. - PMC - PubMed
    1. Srivastava S, Hanash S. Pan-cancer early detection: hype or hope? Cancer Cell. 2020;38:23–24. - PubMed
    1. Lennon, A. M. et al. Feasibility of blood testing combined with PET-CT to screen for cancer and guide intervention. Science369, eabb9601 (2020). - PMC - PubMed

Publication types