

Introduction of a cascaded segmentation pipeline for parametric T1 mapping in cardiovascular magnetic resonance to improve segmentation performance
- PMID: 36746989
- PMCID: PMC9902617
- DOI: 10.1038/s41598-023-28975-5
Introduction of a cascaded segmentation pipeline for parametric T1 mapping in cardiovascular magnetic resonance to improve segmentation performance
Abstract
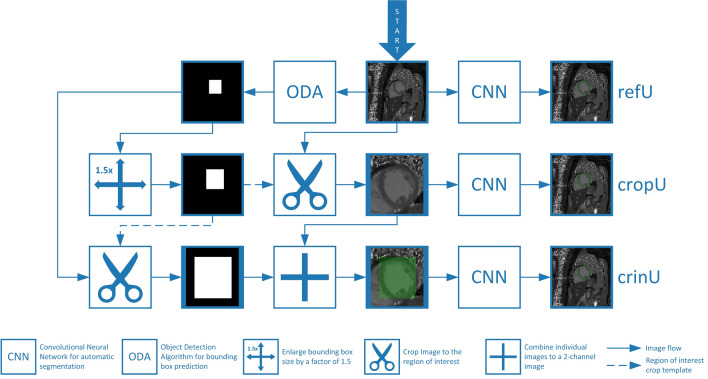
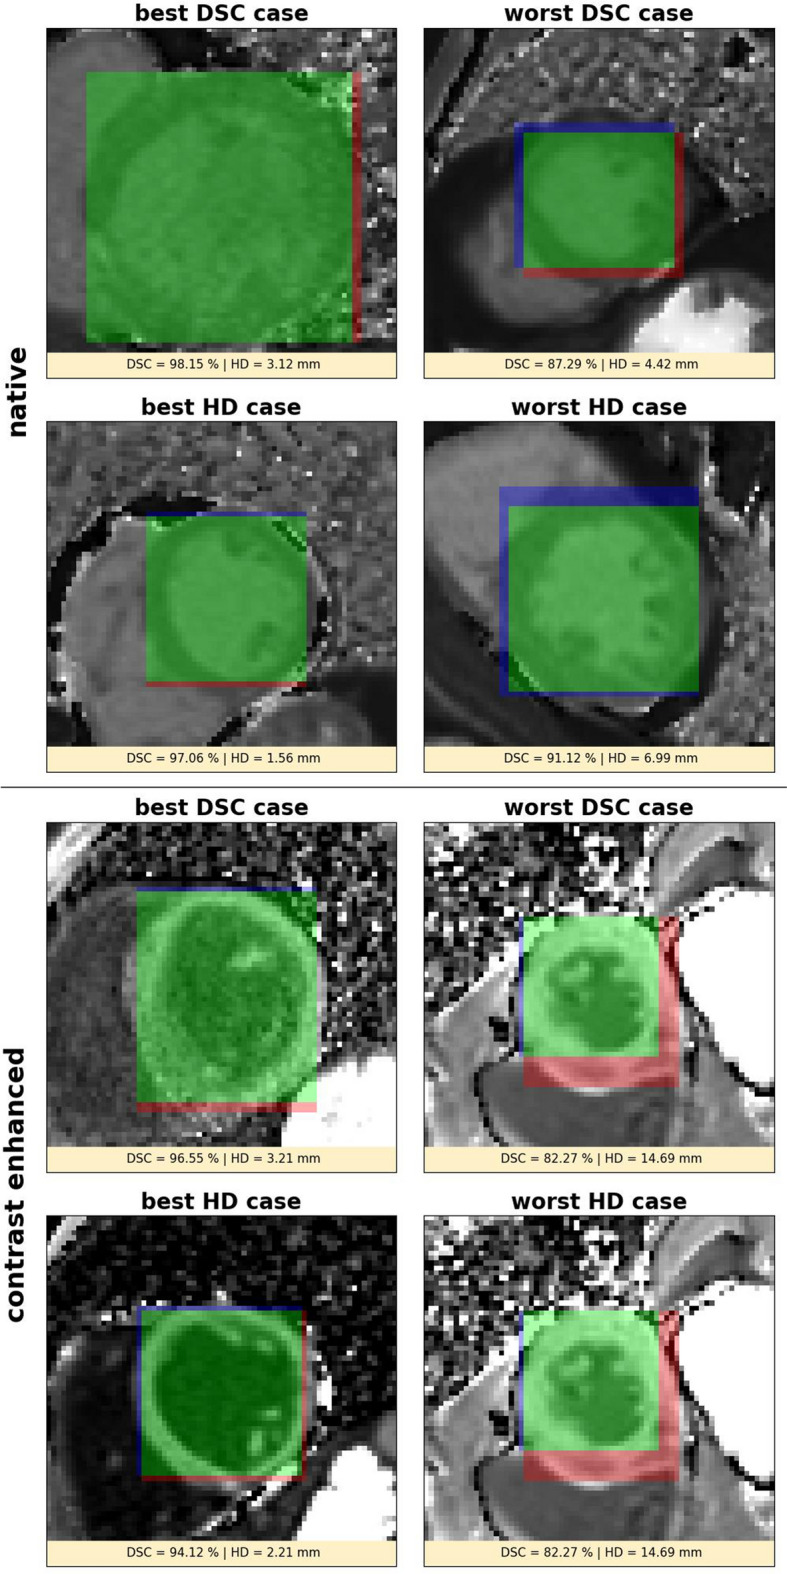
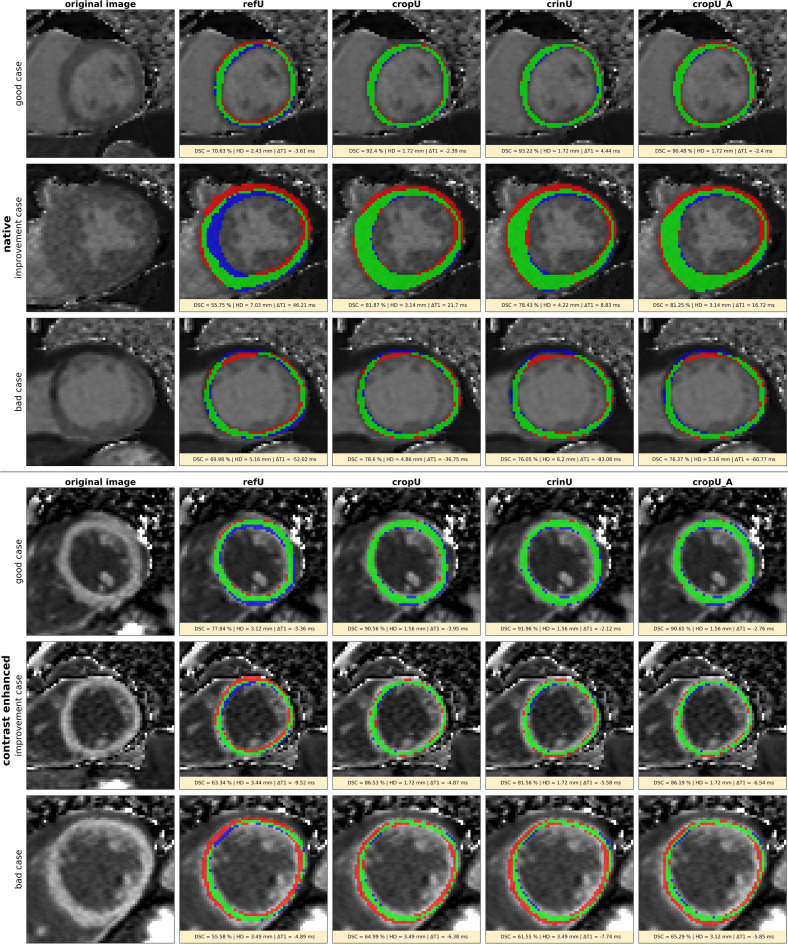
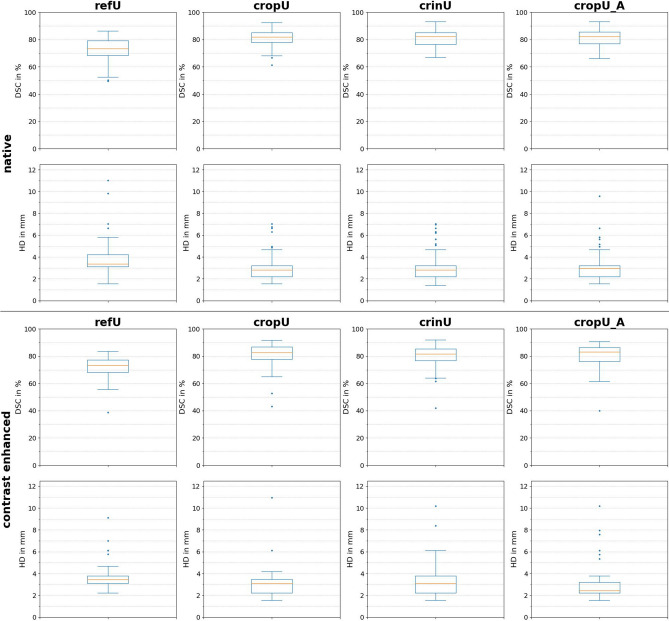
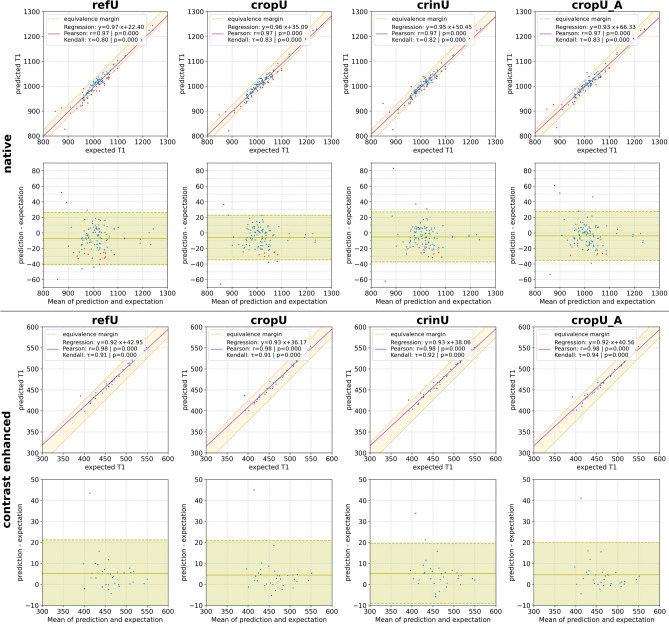
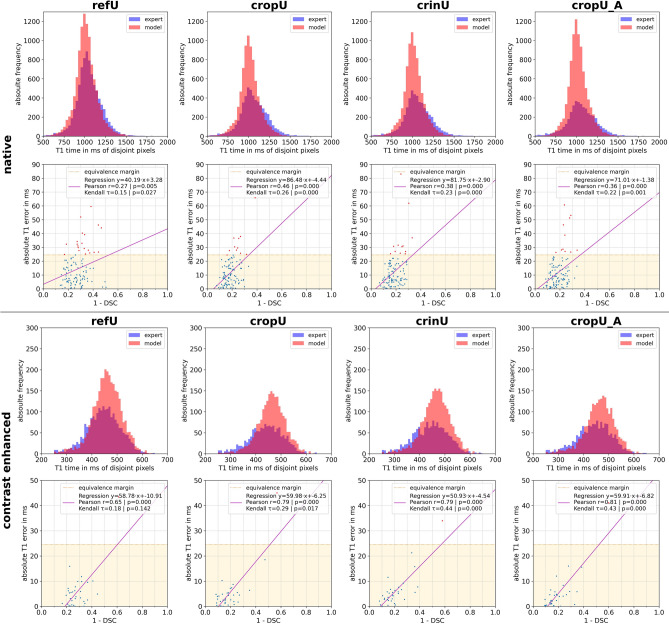
The manual and often time-consuming segmentation of the myocardium in cardiovascular magnetic resonance is increasingly automated using convolutional neural networks (CNNs). This study proposes a cascaded segmentation (CASEG) approach to improve automatic image segmentation quality. First, an object detection algorithm predicts a bounding box (BB) for the left ventricular myocardium whose 1.5 times enlargement defines the region of interest (ROI). Then, the ROI image section is fed into a U-Net based segmentation. Two CASEG variants were evaluated: one using the ROI cropped image solely (cropU) and the other using a 2-channel-image additionally containing the original BB image section (crinU). Both were compared to a classical U-Net segmentation (refU). All networks share the same hyperparameters and were tested on basal and midventricular slices of native and contrast enhanced (CE) MOLLI T1 maps. Dice Similarity Coefficient improved significantly (p < 0.05) in cropU and crinU compared to refU (81.06%, 81.22%, 72.79% for native and 80.70%, 79.18%, 71.41% for CE data), while no significant improvement (p < 0.05) was achieved in the mean absolute error of the T1 time (11.94 ms, 12.45 ms, 14.22 ms for native and 5.32 ms, 6.07 ms, 5.89 ms for CE data). In conclusion, CASEG provides an improved geometric concordance but needs further improvement in the quantitative outcome.
© 2023. The Author(s).
Conflict of interest statement
The authors declare no competing interests.
Figures
Similar articles
-
Evaluation of fully automated myocardial segmentation techniques in native and contrast-enhanced T1-mapping cardiovascular magnetic resonance images using fully convolutional neural networks.Med Phys. 2021 Jan;48(1):215-226. doi: 10.1002/mp.14574. Epub 2020 Dec 1. Med Phys. 2021. PMID: 33131085
-
Semi-supervised learning for automatic segmentation of the knee from MRI with convolutional neural networks.Comput Methods Programs Biomed. 2020 Jun;189:105328. doi: 10.1016/j.cmpb.2020.105328. Epub 2020 Jan 11. Comput Methods Programs Biomed. 2020. PMID: 31958580
-
Automatic pipeline for segmentation of LV myocardium on quantitative MR T1 maps using deep learning model and computation of radial T1 and ECV values.NMR Biomed. 2024 Dec;37(12):e5230. doi: 10.1002/nbm.5230. Epub 2024 Aug 4. NMR Biomed. 2024. PMID: 39097976
-
Fully automatic segmentation on prostate MR images based on cascaded fully convolution network.J Magn Reson Imaging. 2019 Apr;49(4):1149-1156. doi: 10.1002/jmri.26337. Epub 2018 Oct 22. J Magn Reson Imaging. 2019. PMID: 30350434
-
Assessment of Bi-Ventricular and Bi-Atrial Areas Using Four-Chamber Cine Cardiovascular Magnetic Resonance Imaging: Fully Automated Segmentation with a U-Net Convolutional Neural Network.Int J Environ Res Public Health. 2022 Jan 27;19(3):1401. doi: 10.3390/ijerph19031401. Int J Environ Res Public Health. 2022. PMID: 35162424 Free PMC article. Clinical Trial.
Cited by
-
Verity plots: A novel method of visualizing reliability assessments of artificial intelligence methods in quantitative cardiovascular magnetic resonance.PLoS One. 2025 May 16;20(5):e0323371. doi: 10.1371/journal.pone.0323371. eCollection 2025. PLoS One. 2025. PMID: 40378365 Free PMC article.
-
Advanced Myocardial MRI Tissue Characterization Combining Contrast Agent-Free T1-Rho Mapping With Fully Automated Analysis.J Magn Reson Imaging. 2025 Mar;61(3):1353-1365. doi: 10.1002/jmri.29502. Epub 2024 Jul 1. J Magn Reson Imaging. 2025. PMID: 38949101 Free PMC article.
References
-
- Messroghli DR, et al. Clinical recommendations for cardiovascular magnetic resonance mapping of T1, T2, T2* and extracellular volume: A consensus statement by the Society for Cardiovascular Magnetic Resonance (SCMR) endorsed by the European Association for Cardiovascular Imaging (EACVI) J. Cardiovasc. Magn. Reson. 2017;19:75. doi: 10.1186/s12968-017-0389-8. - DOI - PMC - PubMed
Publication types
MeSH terms
LinkOut - more resources
Full Text Sources
Medical
