. 2021 Sep 17;1(1):49.
doi: 10.1038/s43705-021-00053-9.

Effects of laboratory domestication on the rodent gut microbiome

Affiliations

Effects of laboratory domestication on the rodent gut microbiome

Kate L Bowerman et al. ISME Commun. .

Abstract

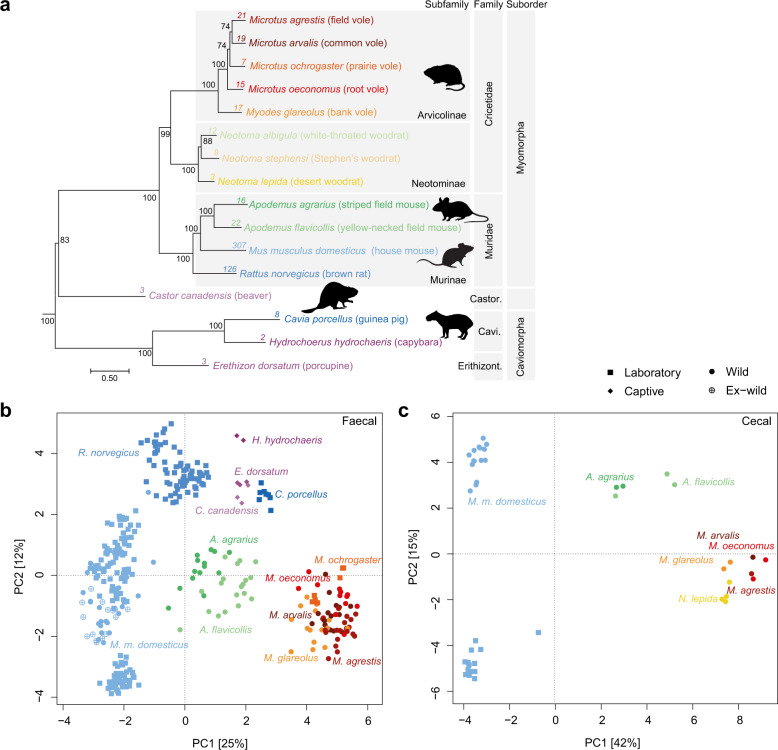
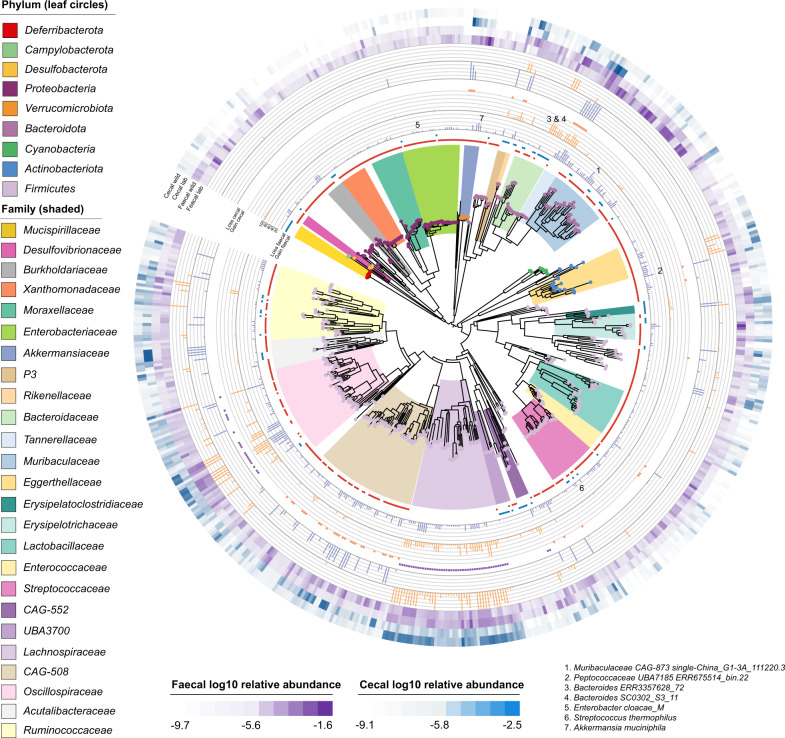
The domestication of the laboratory mouse has influenced the composition of its native gut microbiome, which is now known to differ from that of its wild ancestor. However, limited exploration of the rodent gut microbiome beyond the model species Mus musculus has made it difficult to interpret microbiome variation in a broader phylogenetic context. Here, we analyse 120 de novo and 469 public metagenomically-sequenced faecal and caecal samples from 16 rodent hosts representing wild, laboratory and captive lifestyles. Distinct gut bacterial communities were observed between rodent host genera, with broadly distributed species originating from the as-yet-uncultured bacterial genera UBA9475 and UBA2821 in the families Oscillospiraceae and Lachnospiraceae, respectively. In laboratory mice, Helicobacteraceae were generally depleted relative to wild mice and specific Muribaculaceae populations were enriched in different laboratory facilities, suggesting facility-specific outgrowths of this historically dominant rodent gut family. Several bacterial families of clinical interest, including Akkermansiaceae, Streptococcaceae and Enterobacteriaceae, were inferred to have gained over half of their representative species in mice within the laboratory environment, being undetected in most wild rodents and suggesting an association between laboratory domestication and pathobiont emergence.


Conflict of interest statement

The authors declare no competing interests.

Figures

Fig. 1
Fig. 1. The rodent gut microbiome is distinguishable by host genus.
a Maximum likelihood tree of rodent hosts included in the dataset based on alignment of two mitochondrial and four nuclear genes, as described in Supplementary Table 4. Bootstrap support generated from 10,000 ultrafast bootstrapping replicates shown on interior nodes. Sample numbers per host indicated at tips. PCA of (b) faecal and (c) caecal samples based on read mapping counts (CLR-transformed) to genome database filtered to include genomes recruiting ≥500 reads across ≥0.01 of the genome in ≥1 sample. Ex-wild samples represent animals transferred from the wild to the laboratory.
Fig. 2
Fig. 2. Bacterial species detection across the rodent gut microbiome.
Maximum likelihood tree inferred based on alignment of 120 single copy marker genes identified by GTDB-Tk [27] within genomes recruiting ≥500 reads across ≥0.01 of the genome in ≥1 sample (9411). Outer rings show presence of each bacterial species in a given rodent host where presence is based on meeting the same recruitment criteria in at least one sample per rodent host (16 rings). Blue bar graph displays the number of rodent hosts meeting this threshold for each bacterial species, i.e., rodent host range. Outer two rings display presence in outgroup species, Homo sapiens and Sus scrofa (pig). Coloured circle on leaf indicates phylum. Coloured ranges indicate families with relative abundance ≥0.5% in >300 samples.
Fig. 3
Fig. 3. Distribution of bacterial species across rodent hosts.
a Count of rodent hosts each bacterial species was identified in based on all gut microbiome samples within the dataset. b Count of bacterial species identified exclusively within either a single rodent host, genus or family. For rodent genera and families, bacterial species were included only where they were not identified in samples outside of the specified group. Presence of bacterial species within a given rodent host species based on genomes recruiting ≥500 reads across ≥0.01 of the genome in ≥1 sample.
Fig. 4
Fig. 4. Diversity metrics across rodent faecal samples.
Alpha diversity measured using (a), (d) Shannon and (b), (e) Simpson (1-D) indices based on genome size scaled mapping counts. Global analysis undertaken using Kruskal-Wallis test (p < 0.0001). c, f Beta diversity measured using Aitchison distance (Euclidean distance from CLR transformed mapping counts). Global analysis undertaken using Kruskal-Wallis test (p < 0.0001). Pairwise significance determined using Dunn’s multiple comparison test with Benjamini-Hochberg adjustment—see Supplementary Tables 7 and 8. d–f Red asterisk indicates significant difference of laboratory cohort from both wild mouse groups. Analysis includes untreated faecal samples only. Hosts represented by <5 samples excluded (Castor canadensis, Erethizon dorsatum, Hydrochoerus hydrochaeris).
Fig. 5
Fig. 5. Bacterial species distinguishing the laboratory mouse faecal microbiome from that of wild mice.
Analysis undertaken using faecal samples from laboratory mice fed a standard chow diet and wild mice. a PCA and (b) sPLS-DA based on read mapping counts (CLR-transformed) to genome database filtered to include genomes recruiting ≥500 reads across ≥0.01 of the genome in ≥1 sample. c Heatmap containing genomes identified as discriminatory between laboratory and wild mice using ALDEx2 (effect ≥ |1.5 | ) and sPLS-DA implemented within mixOmics. Genomes selected by both methods marked with an asterisk, remainder identified with ALDEx2 only.
Fig. 6
Fig. 6. Putative gain/loss events within the laboratory mouse gut microbiome.
Tree from Fig. 1 pruned to include only genomes predicted as gained or lost species within the laboratory mouse. Innermost rings indicate gain (red) and loss (blue) events within faecal samples. First two bar charts indicate prevalence of species within faecal samples of laboratory (purple) or wild (orange) mice. Subsequent rings indicate gain (orange) and loss (purple) events within caecal samples and final two bar charts indicate prevalence of species within caecal samples of laboratory (purple) or wild (orange) mice. Heatmaps display log10 relative abundance of species within laboratory (purple) or wild (blue) mice. Coloured circle on leaf indicates phylum. Coloured ranges indicate families.
Fig. 7
Fig. 7. Laboratory mice exhibit reduced diversity within the family Muribaculaceae.
Alpha diversity of (a, b) rodent hosts and (c, d) laboratory mouse strains measured using Shannon and Simpson (1-D) indices based on genome size scaled mapping counts. Significance determined using Dunn’s multiple comparison test with Benjamini-Hochberg adjustment—see Supplementary (Tables 26 and 27). Global analysis undertaken using Kruskal-Wallis test (p < 0.0001). Hosts represented by <5 samples excluded (Castor canadensis, Erethizon dorsatum, Hydrochoerus hydrochaeris). Analysis includes untreated faecal samples only.
Fig. 8
Fig. 8. Outgrowths of members of the family Muribaculaceae are apparent between laboratory cohorts.
Relative abundance within faecal and colon samples of the (a–i) species with highest abundance from each laboratory cohort and (j-k) highest abundance in wild mouse populations. Samples from untreated laboratory mice only are included.

References

    1. Chen C, Zhou Y, Fu H, Xiong X, Fang S, Jiang H, et al. Expanded catalog of microbial genes and metagenome-assembled genomes from the pig gut microbiome. Nat Commun. 2021;12:1106. doi: 10.1038/s41467-021-21295-0. - DOI - PMC - PubMed
    1. Metcalf JL, Song SJ, Morton JT, Weiss S, Seguin-Orlando A, Joly F, et al. Evaluating the impact of domestication and captivity on the horse gut microbiome. Sci Reports. 2017;7:15497. - PMC - PubMed
    1. Alessandri G, Milani C, Mancabelli L, Mangifesta M, Lugli GA, Viappiani A, et al. The impact of human-facilitated selection on the gut microbiota of domesticated mammals. FEMS Microbiol Ecol. 2019;95. 10.1093/femsec/fiz121 - PubMed
    1. Reese AT, Chadaideh KS, Diggins CE, Schell LD, Beckel M, Callahan P, et al. Effects of domestication on the gut microbiota parallel those of human industrialization. eLife. 2021;10:e60197. doi: 10.7554/eLife.60197. - DOI - PMC - PubMed
    1. Staats J The Laboratory Mouse. In: Green EL, editor. Biology of the laboratory mouse. New York: Dover Publications; 1966. p. 1-9.