. 2023 Mar;42(13):994-1009.
doi: 10.1038/s41388-023-02618-5. Epub 2023 Feb 7.

Dissecting and targeting noncanonical functions of EZH2 in multiple myeloma via an EZH2 degrader

Affiliations

Dissecting and targeting noncanonical functions of EZH2 in multiple myeloma via an EZH2 degrader

Xufen Yu et al. Oncogene. 2023 Mar.

Abstract

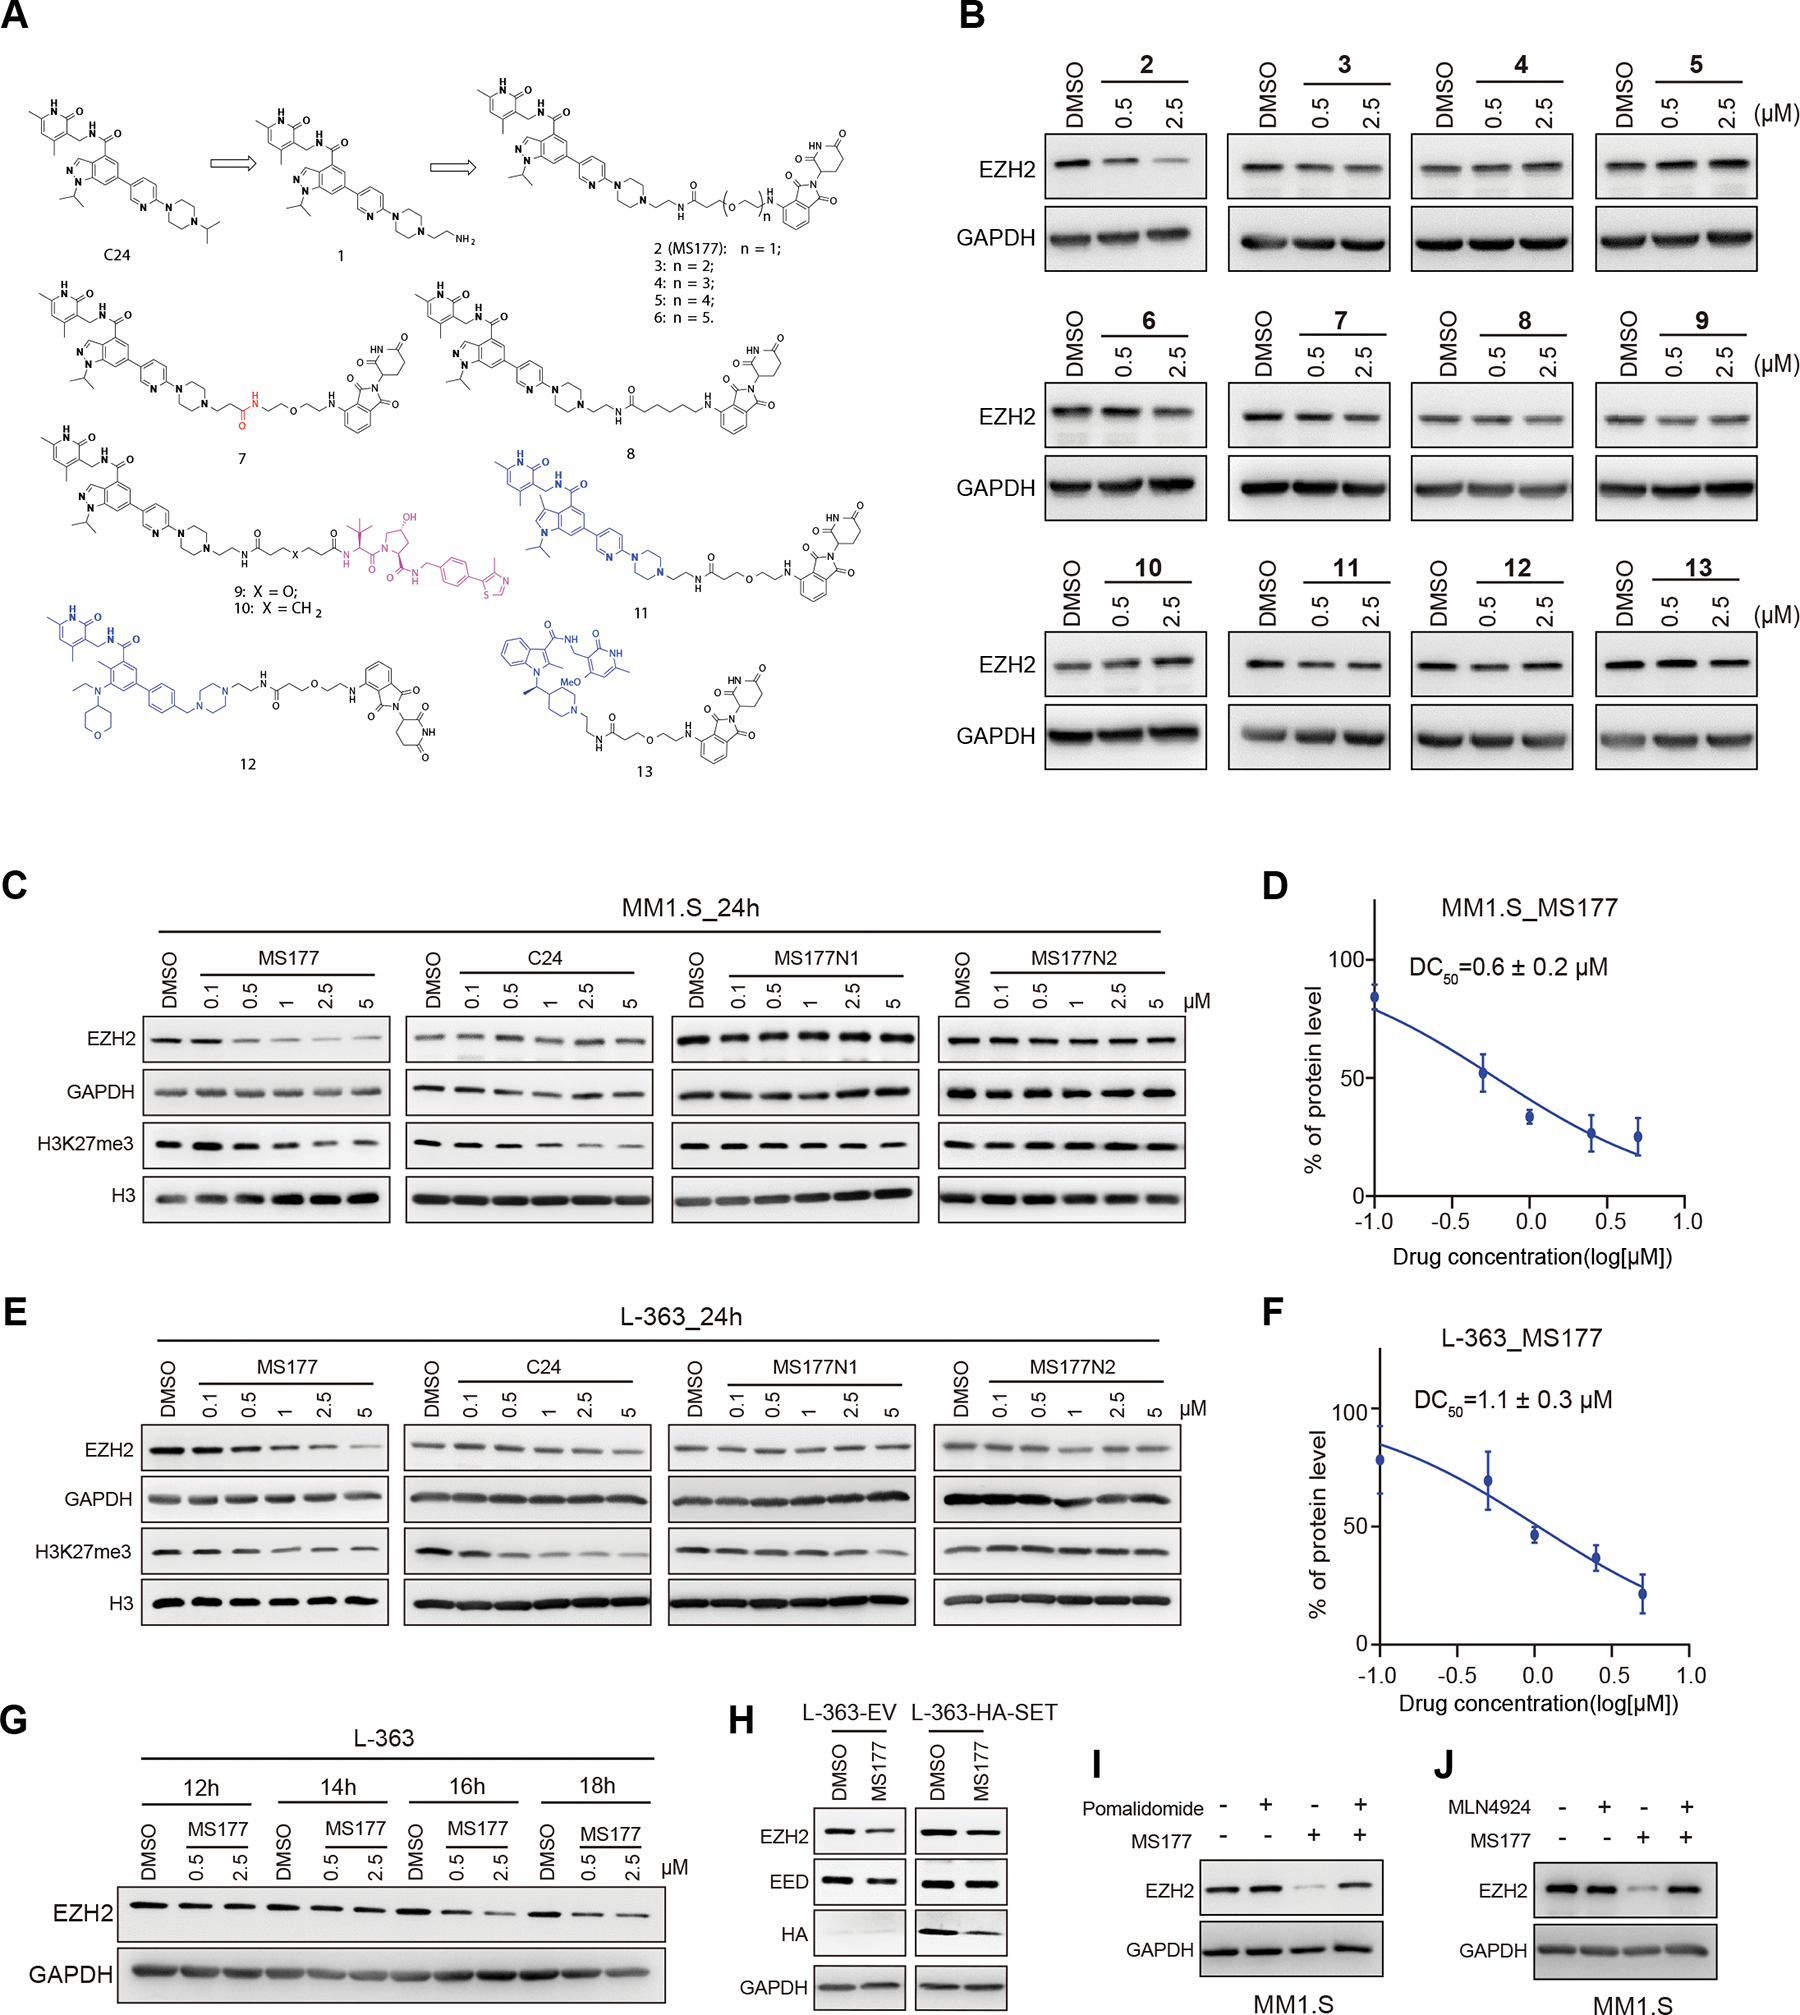
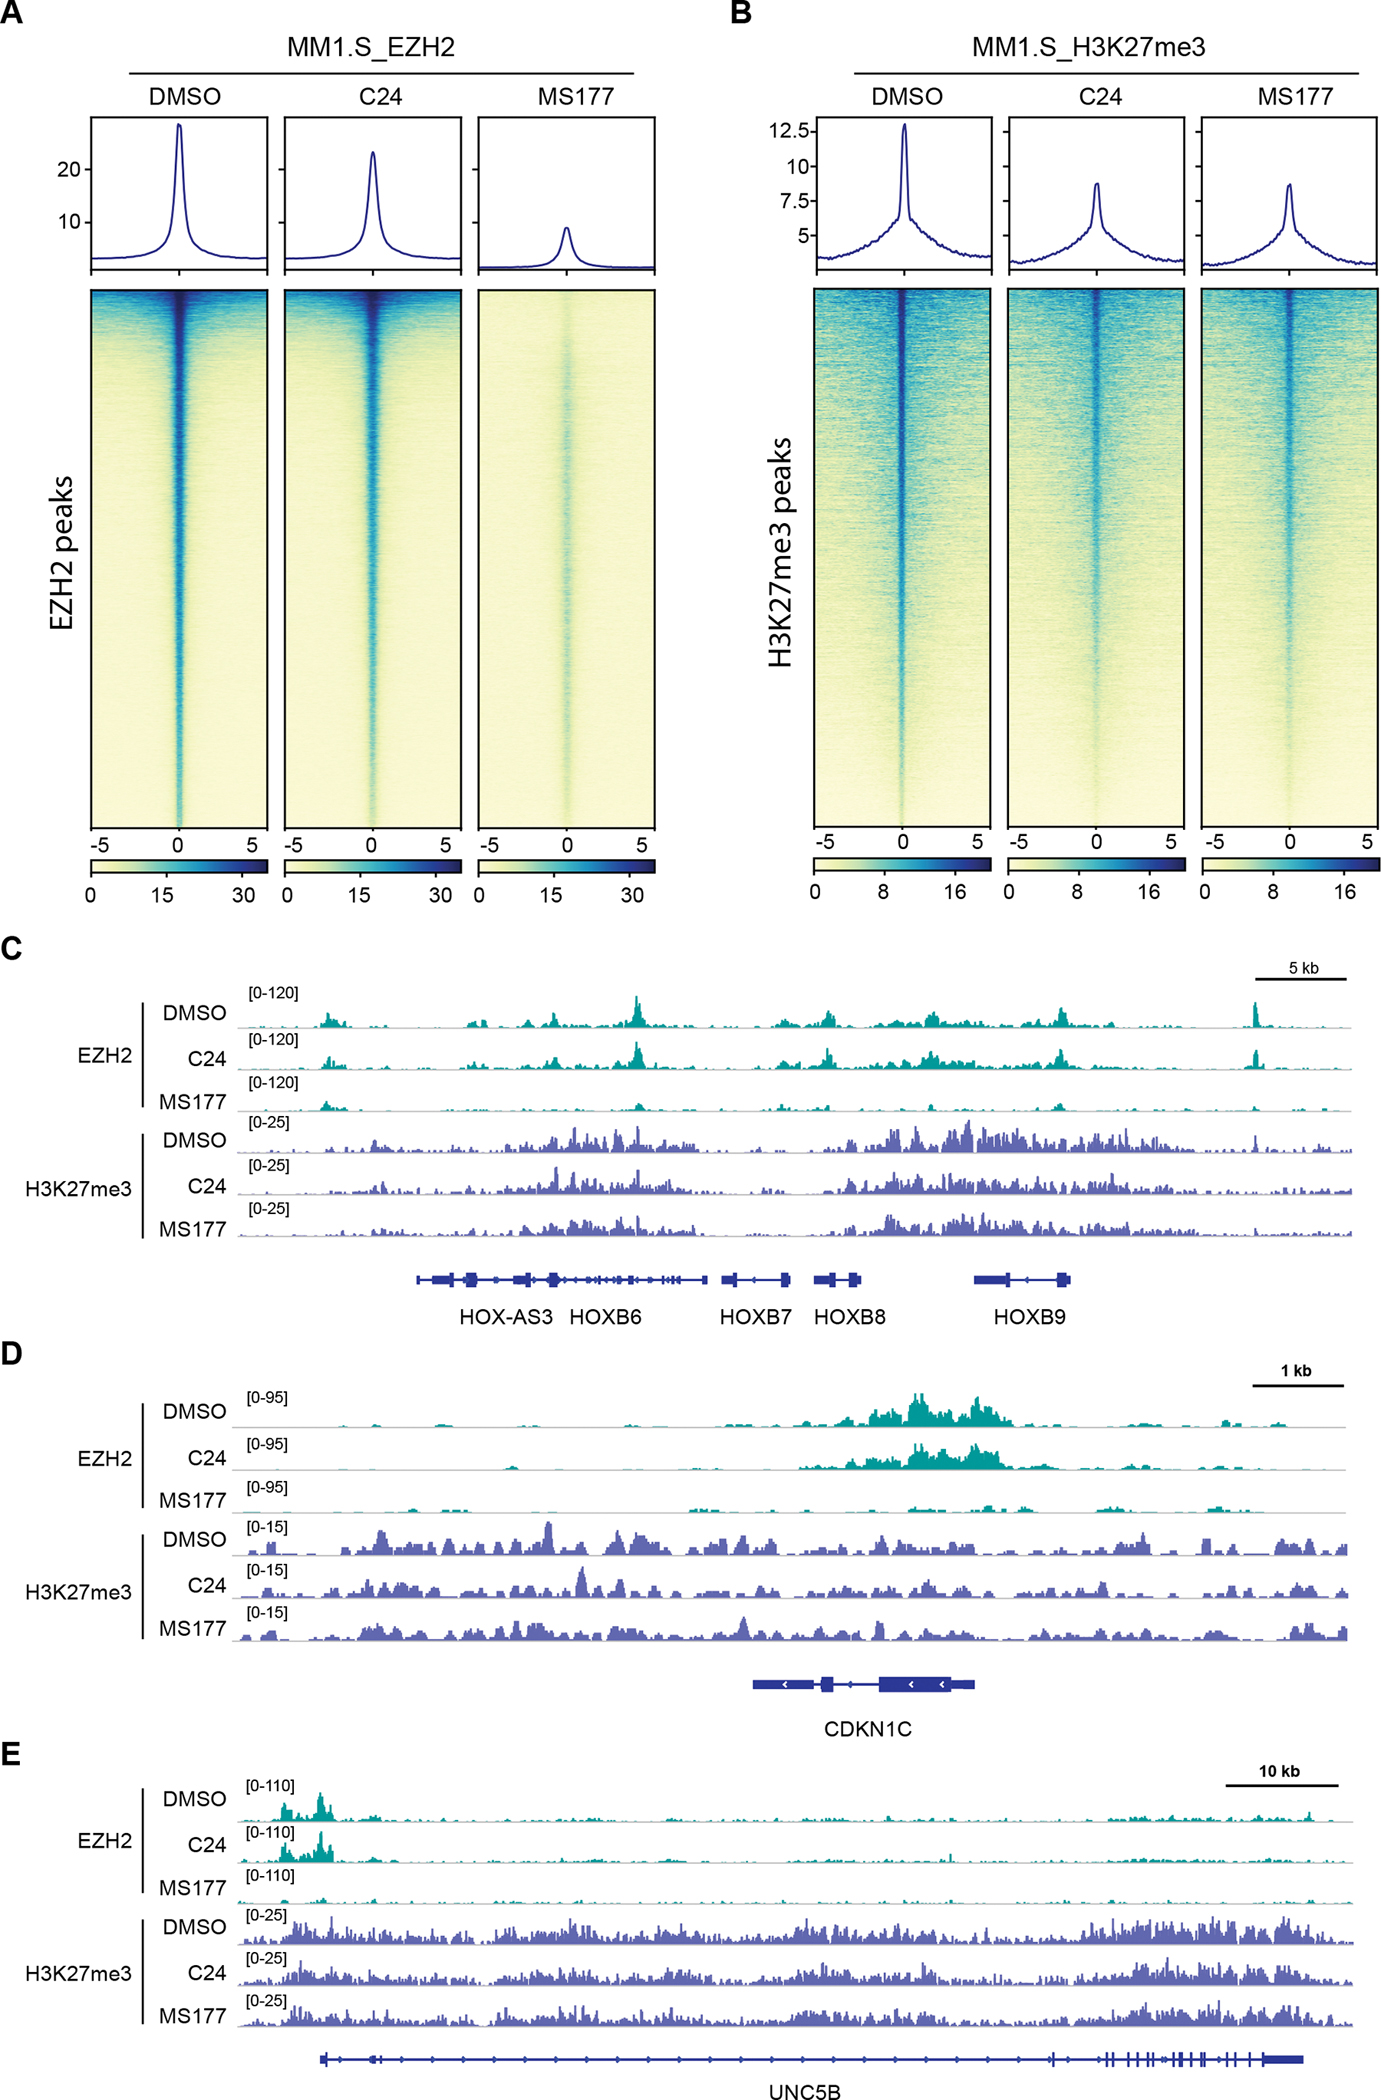
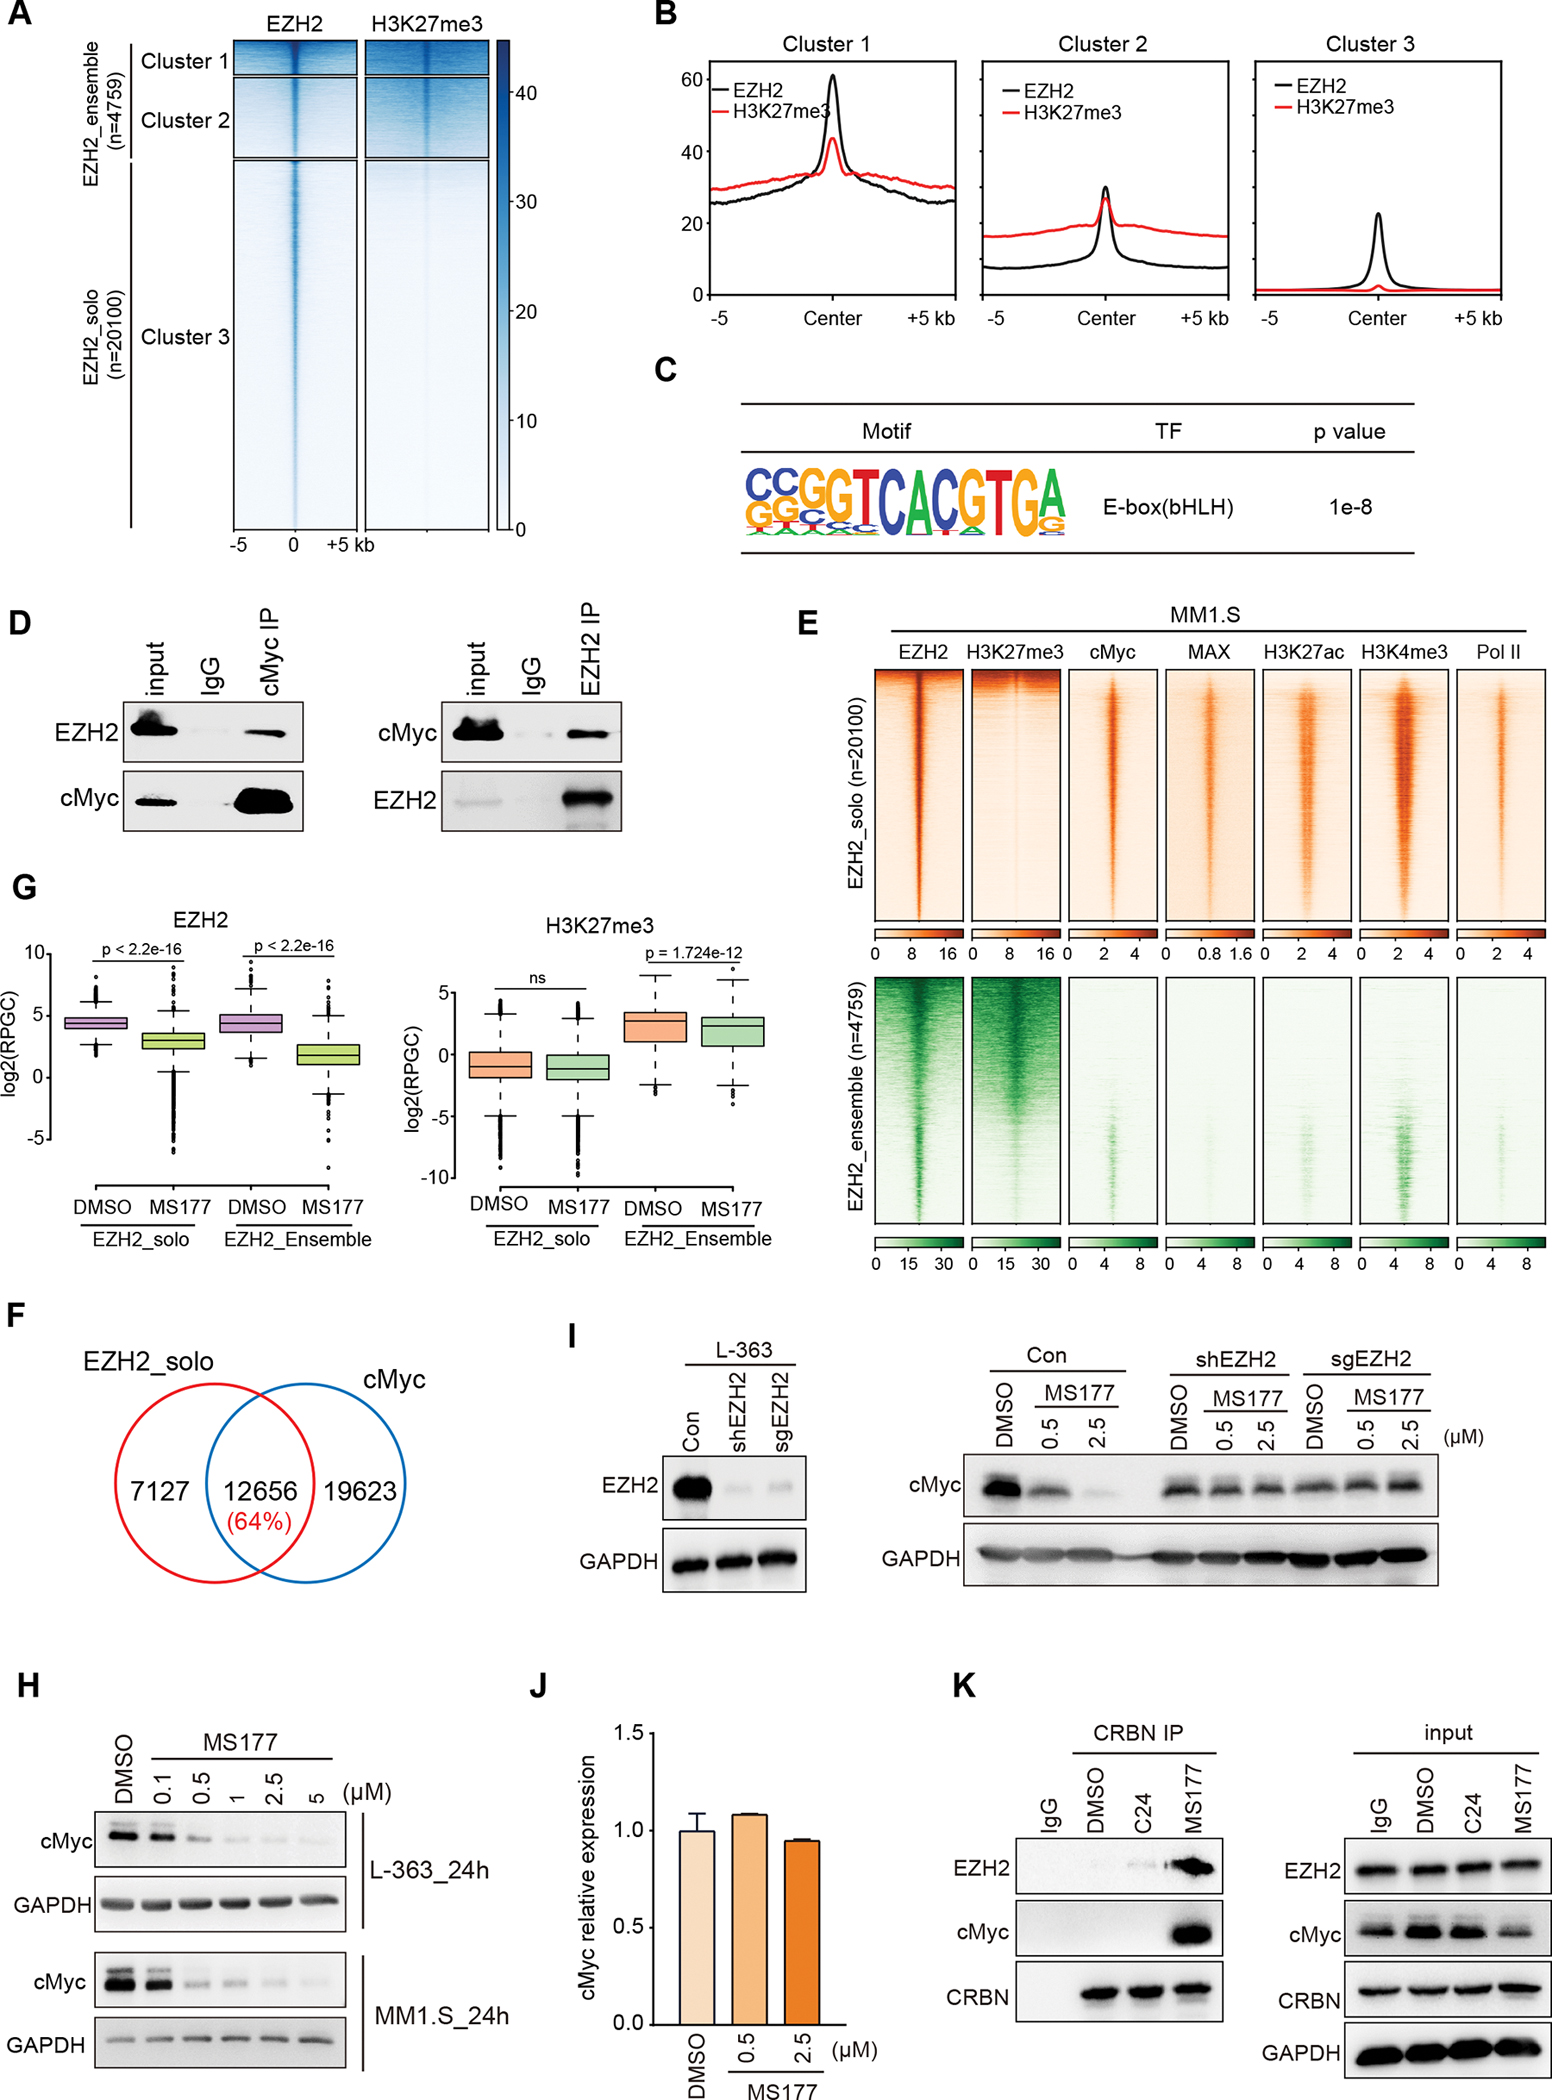
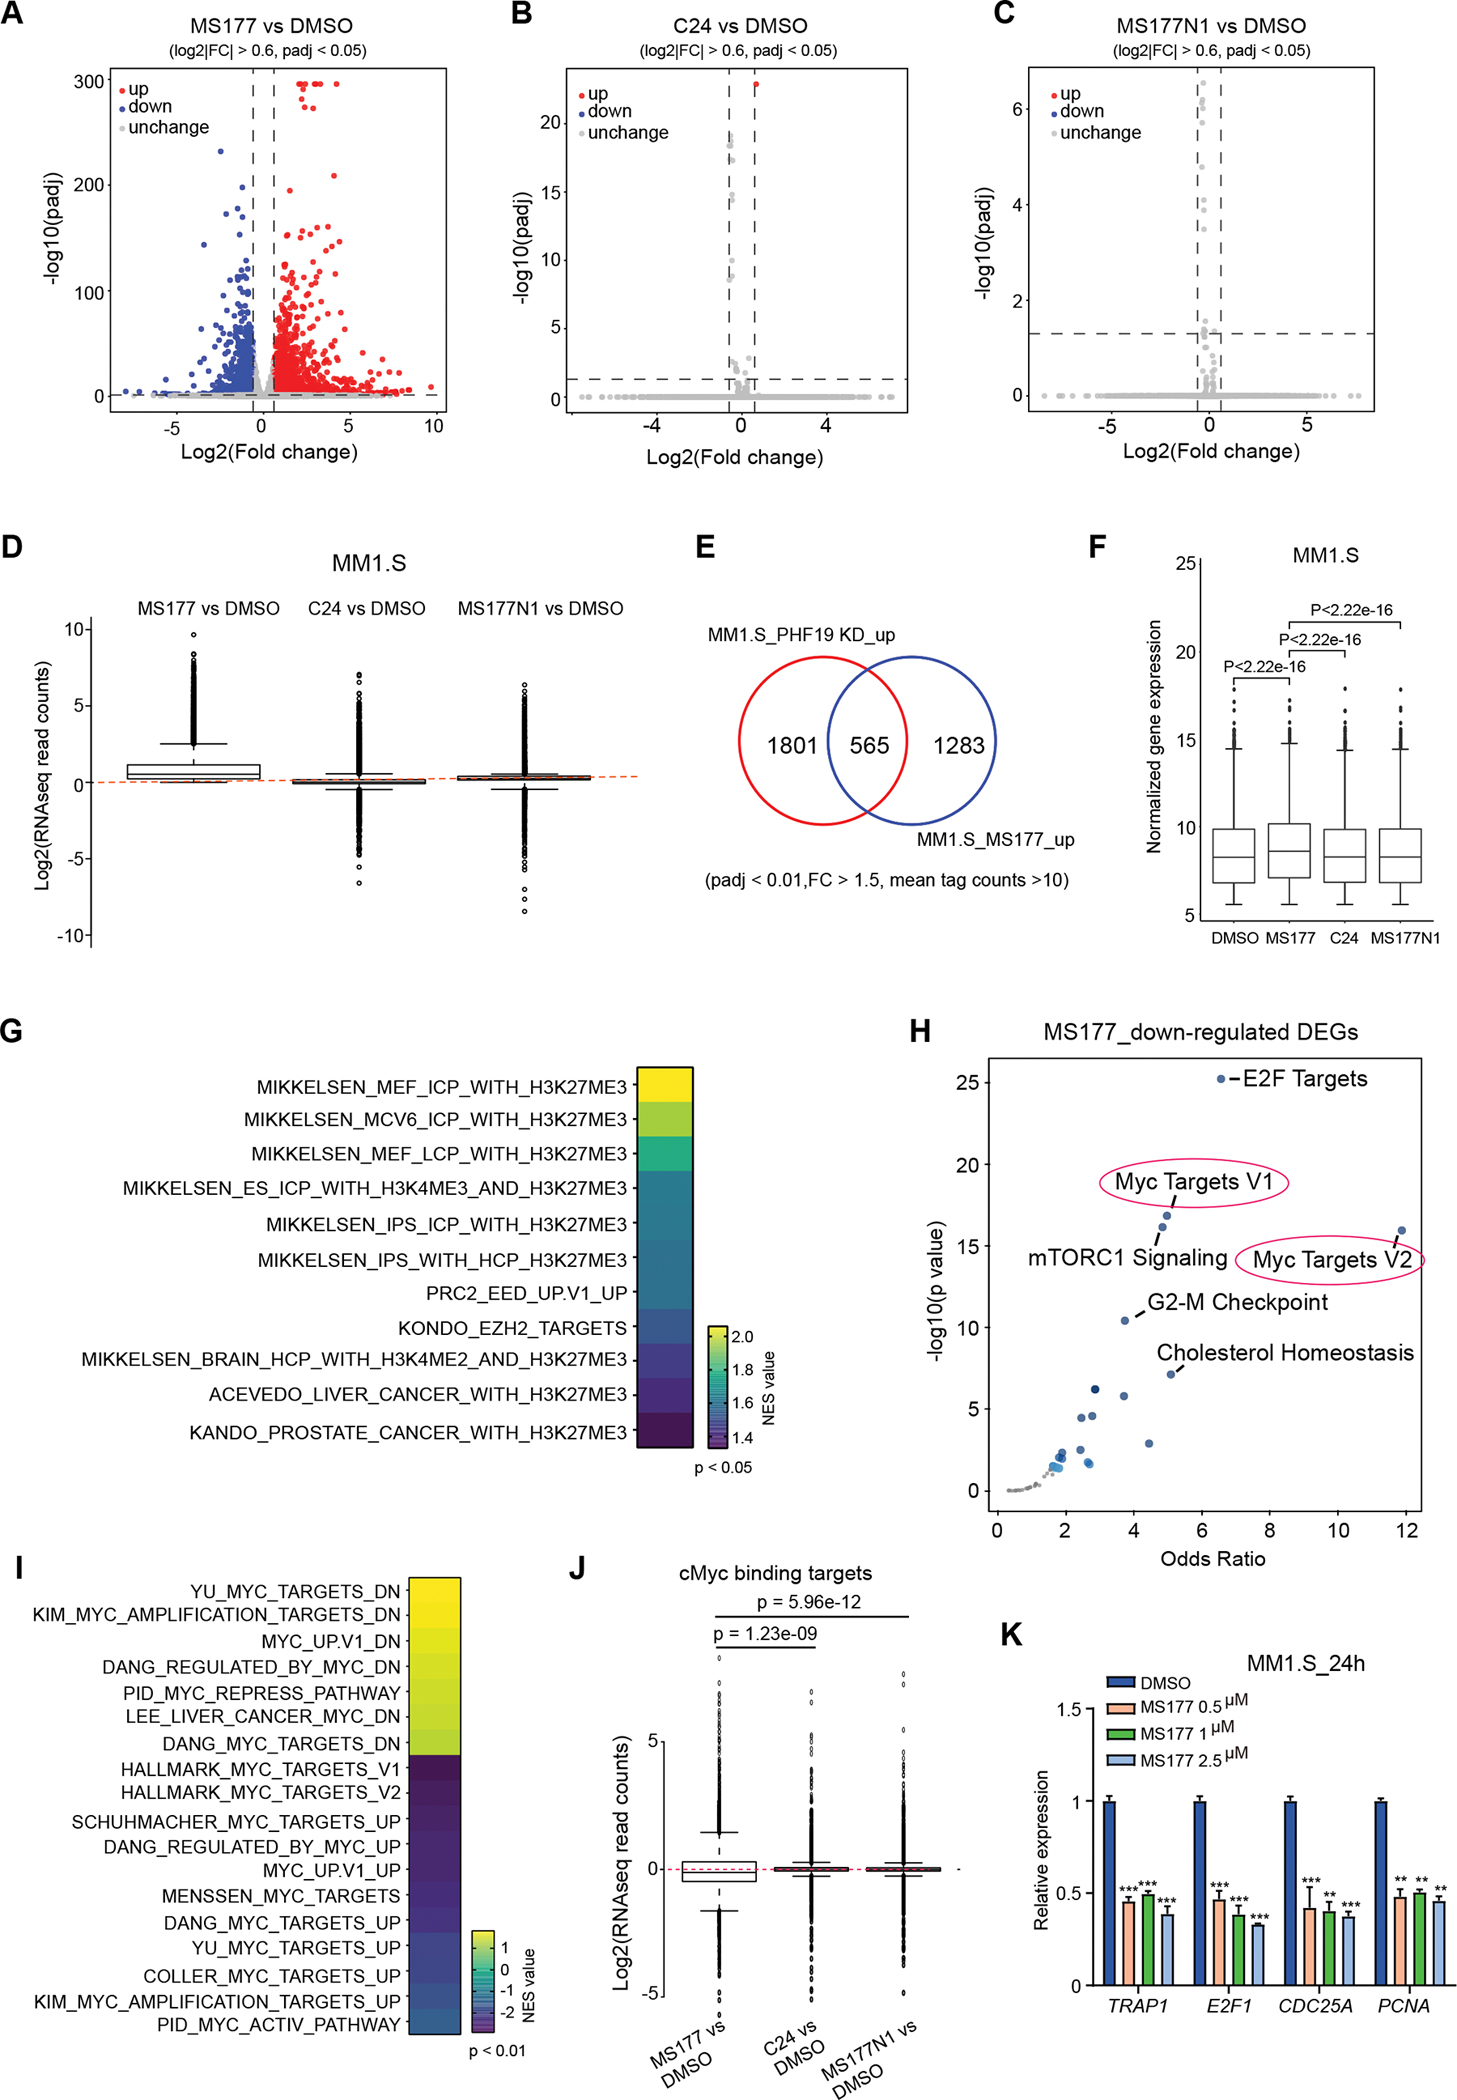
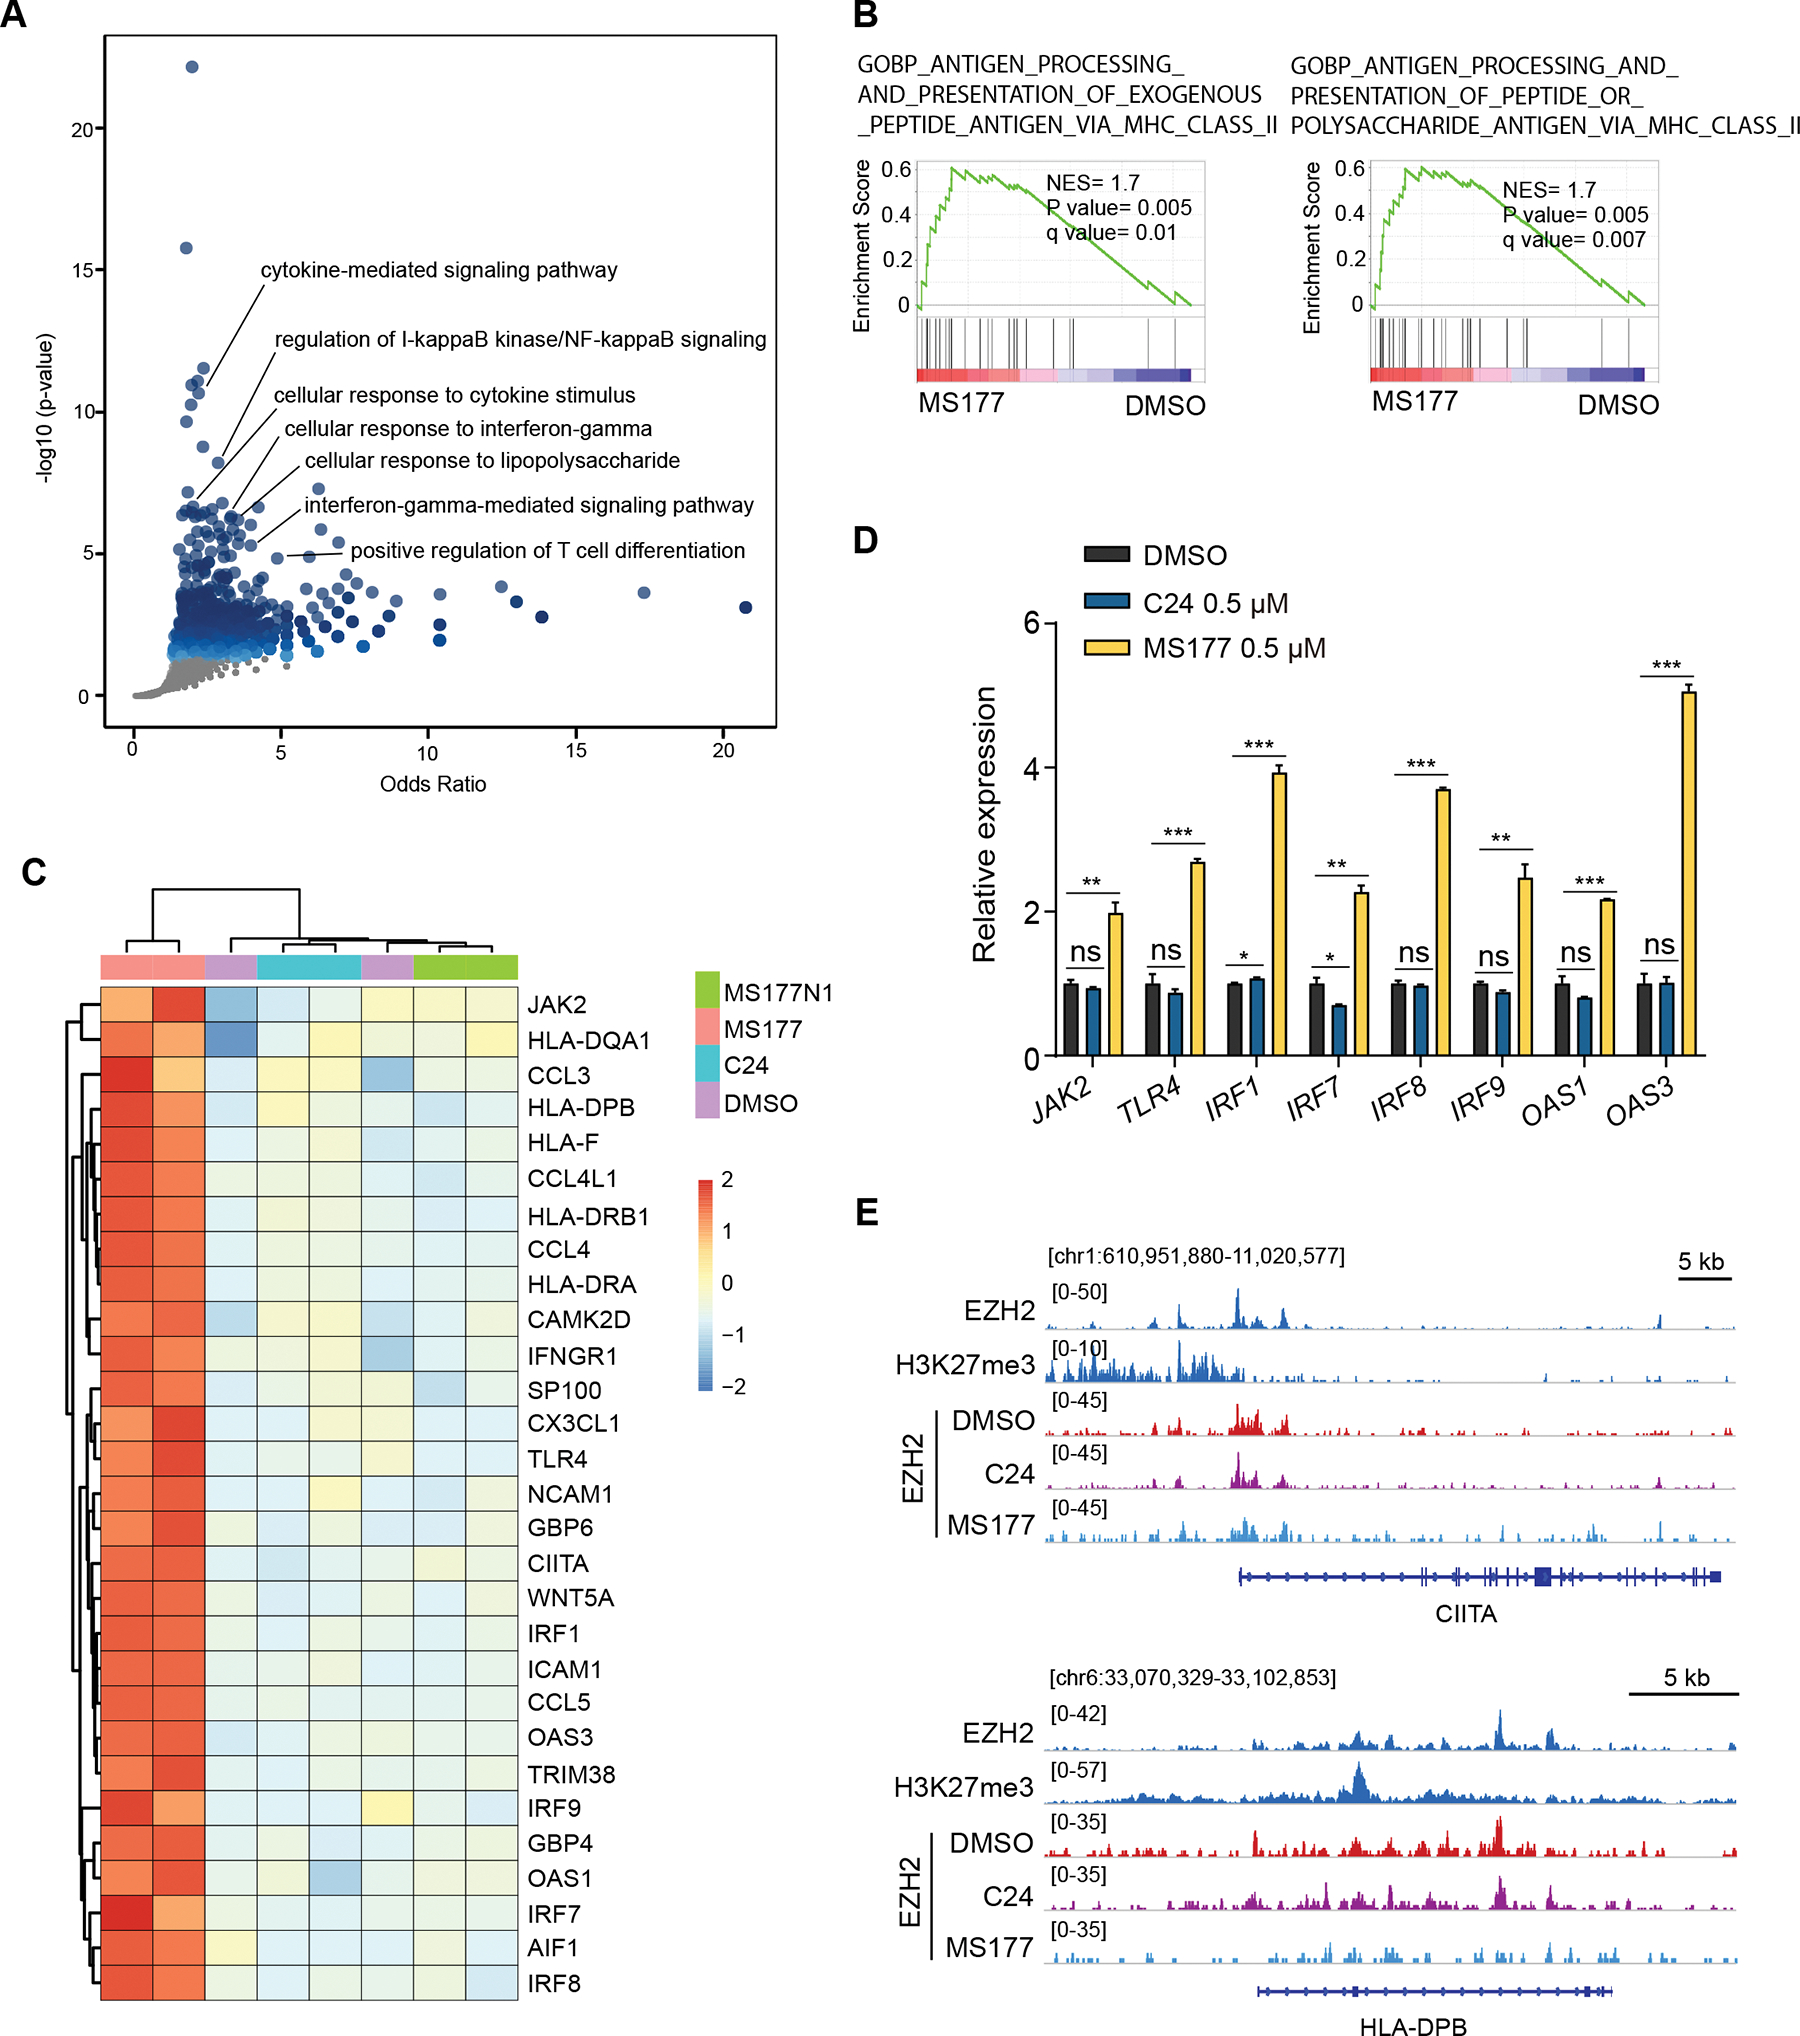
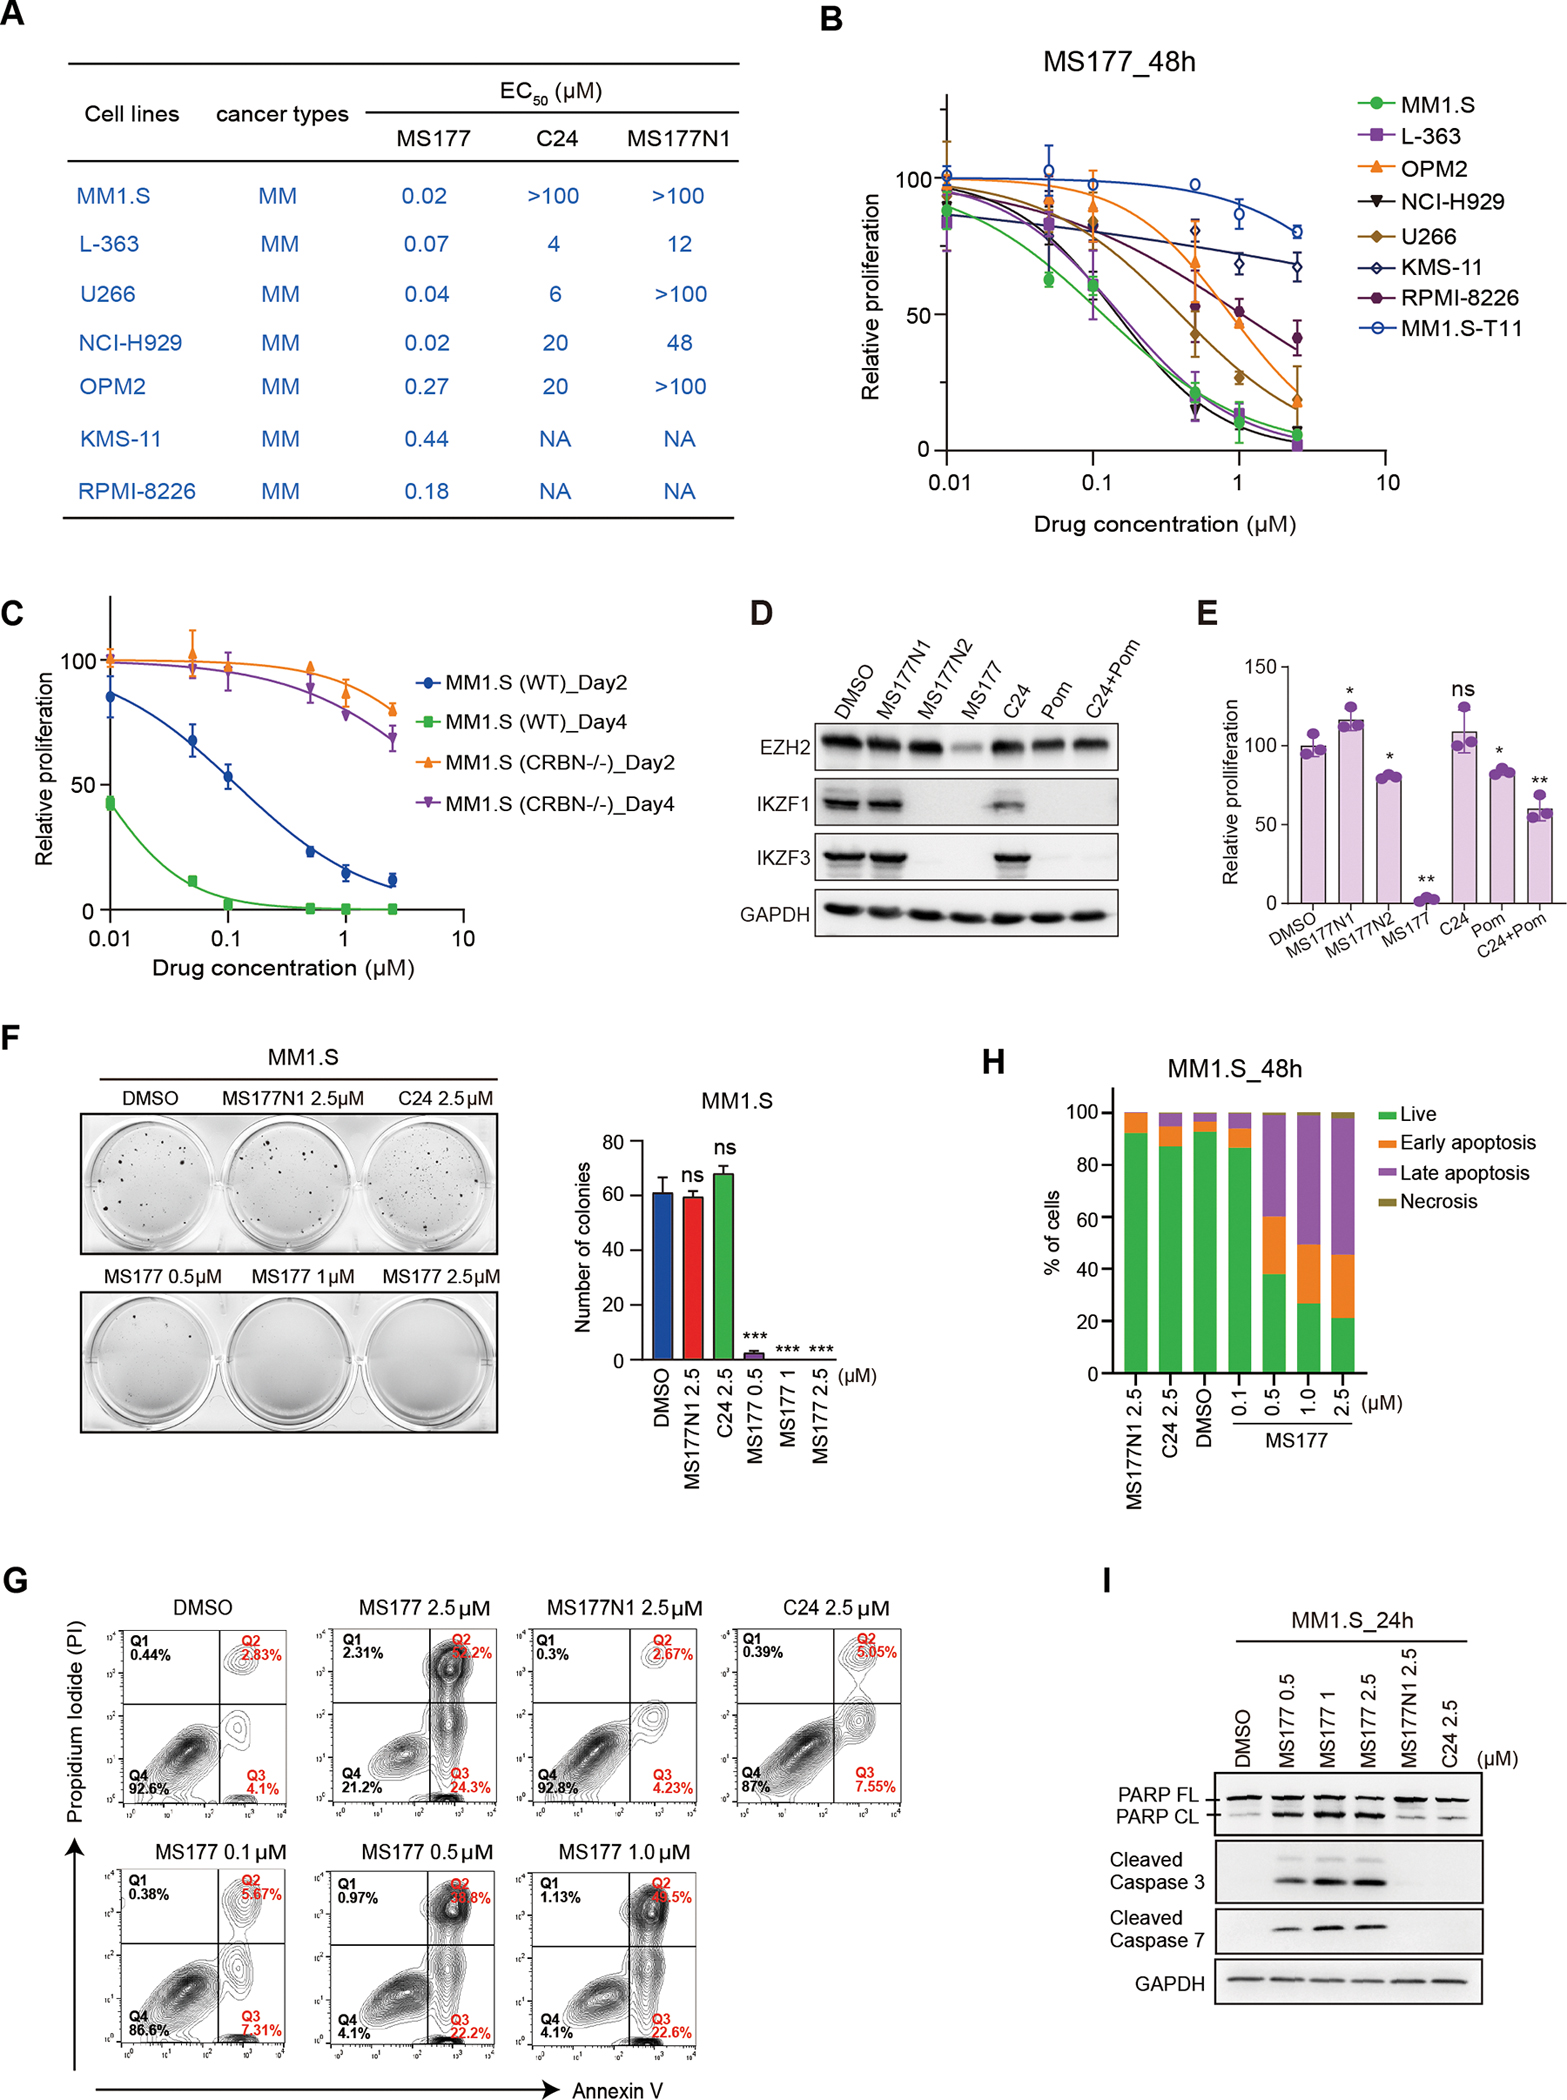
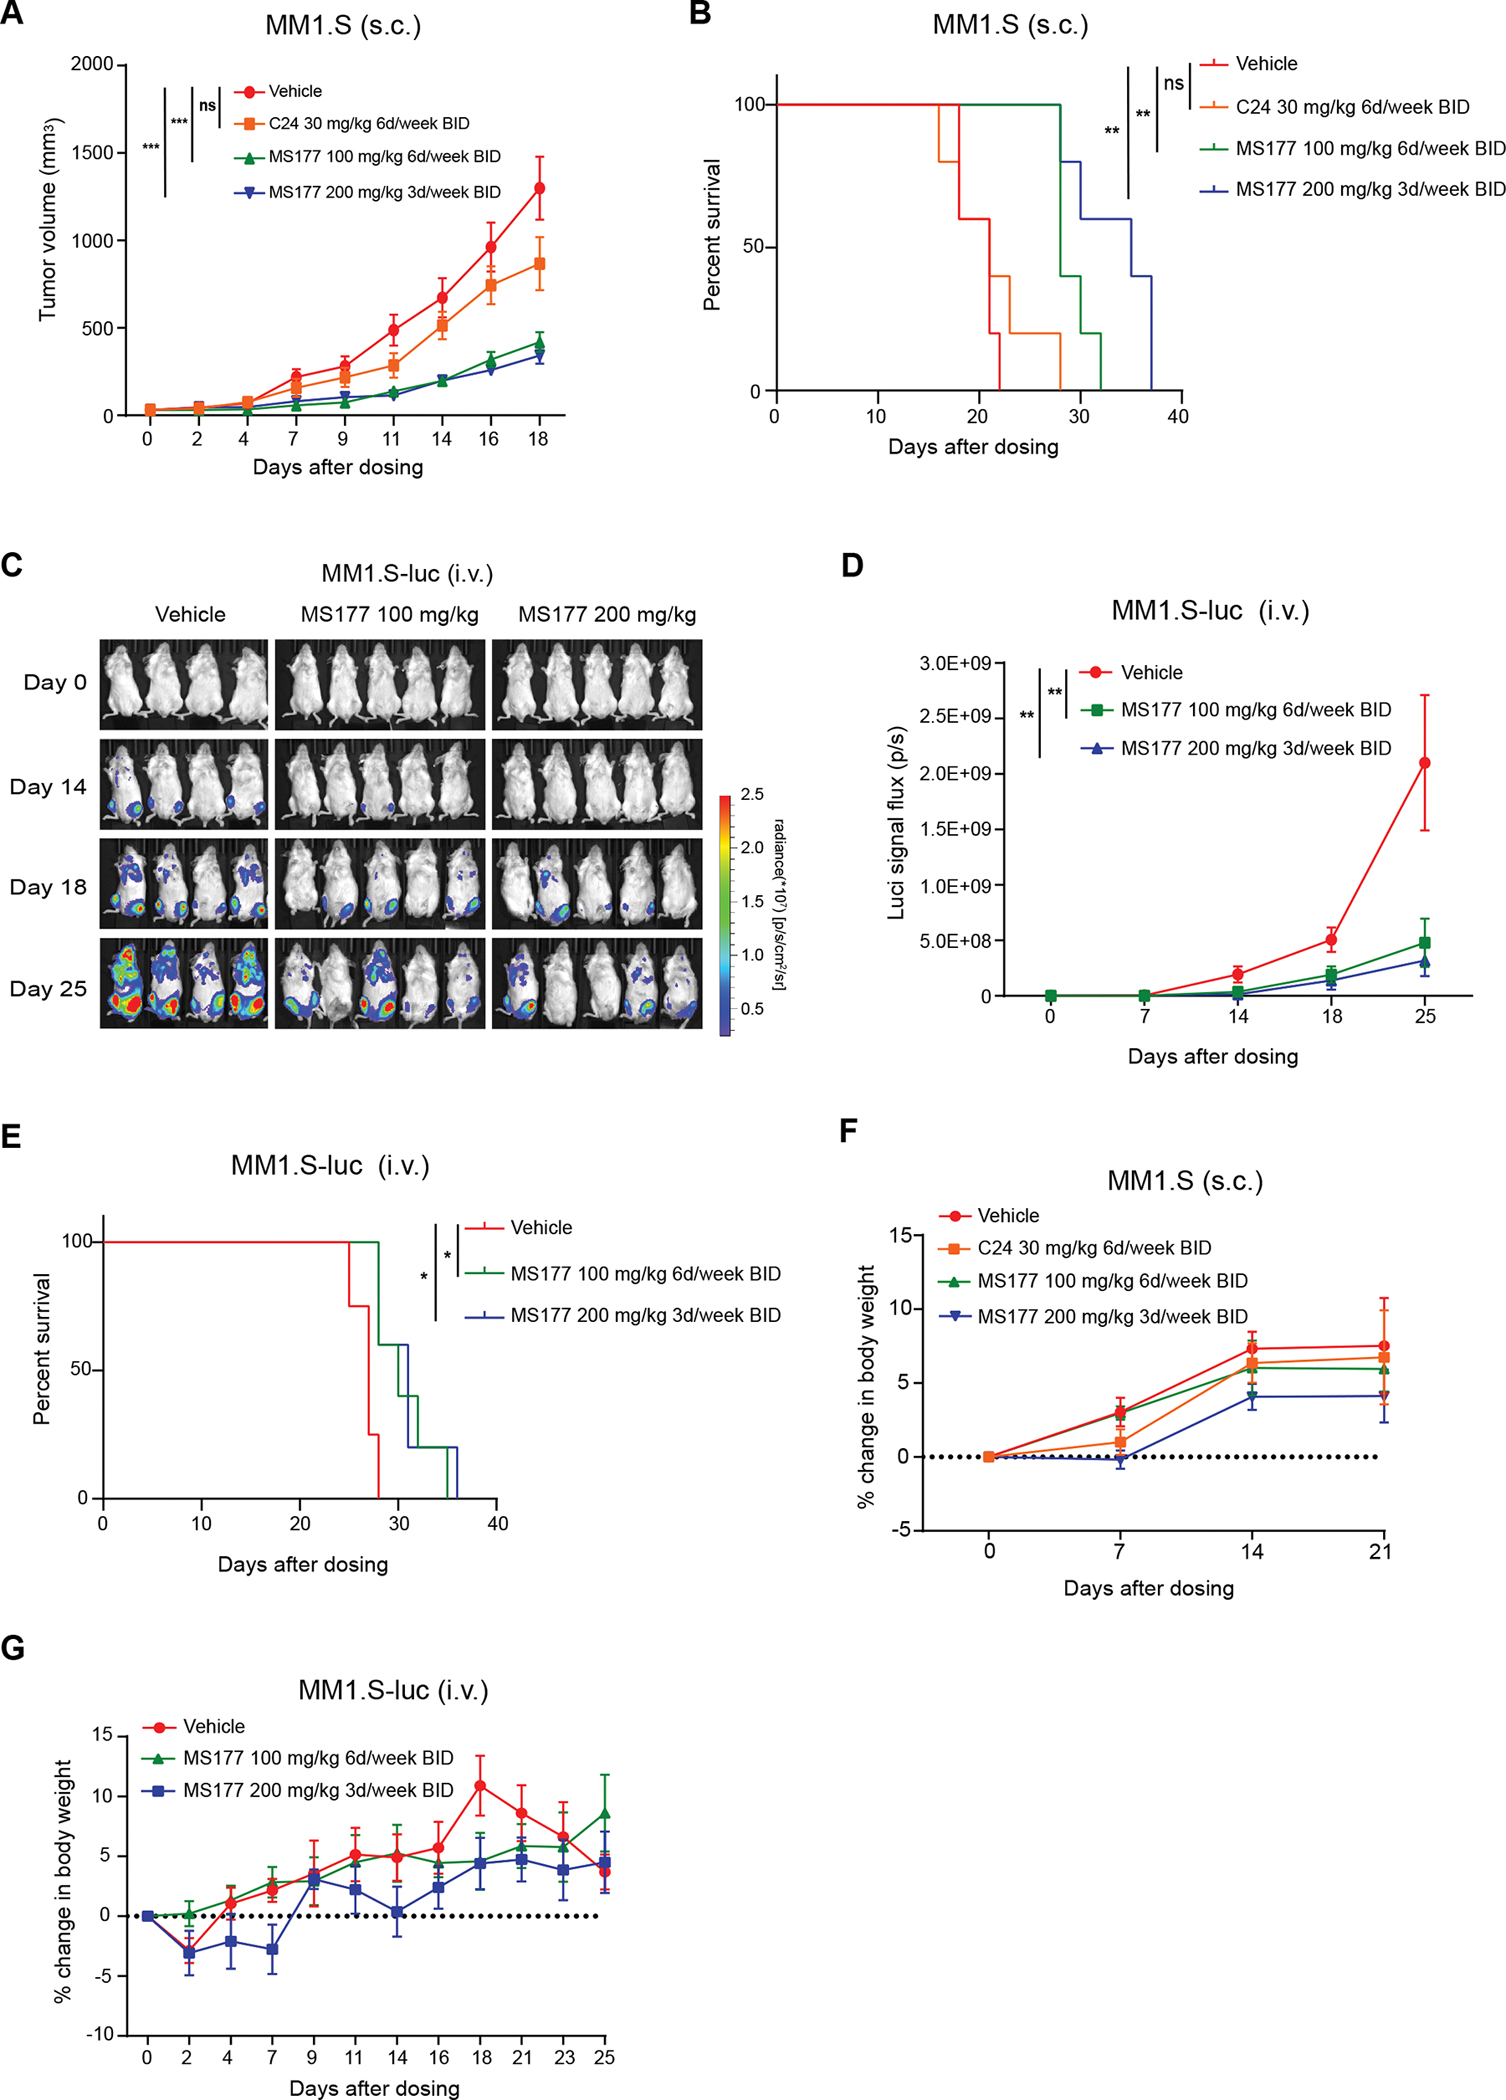
Multiple myeloma (MM) is the second most common hematological malignancy with poor prognosis. Enhancer of zeste homolog 2 (EZH2) is the enzymatic subunit of polycomb repressive complex 2 (PRC2), which catalyzes trimethylation of histone H3 lysine 27 (H3K27me3) for transcriptional repression. EZH2 have been implicated in numerous hematological malignancies, including MM. However, noncanonical functions of EZH2 in MM tumorigenesis are not well understood. Here, we uncovered a noncanonical function of EZH2 in MM malignancy. In addition to the PRC2-mediated and H3K27me3-dependent canonical function, EZH2 interacts with cMyc and co-localizes with gene activation-related markers, promoting MM tumorigenesis in a PRC2- and H3K27me3-independent manner. Both canonical EZH2-PRC2 and noncanonical EZH2-cMyc complexes can be effectively depleted in MM cells by MS177, an EZH2 degrader we reported previously, leading to profound activation of EZH2-PRC2-associated genes and simultaneous suppression of EZH2-cMyc oncogenic nodes. The MS177-induced degradation of both canonical EZH2-PRC2 and noncanonical EZH2-cMyc complexes also reactivated immune response genes in MM cells. Phenotypically, targeting of EZH2's both canonical and noncanonical functions by MS177 effectively suppressed the proliferation of MM cells both in vitro and in vivo. Collectively, this study uncovers a new noncanonical function of EZH2 in MM tumorigenesis and provides a novel therapeutic strategy, pharmacological degradation of EZH2, for treating EZH2-dependent MM.


Conflict of interest statement

Conflict of interest statement

The Jin laboratory received research funds from Celgene Corporation, Levo Therapeutics, Inc., Cullgen, Inc. and Cullinan Oncology, Inc. J.J. is a cofounder and equity shareholder in Cullgen, Inc., a scientific cofounder and scientific advisory board member of Onsero Therapeutics, Inc., and a consultant for Cullgen, Inc., EpiCypher, Inc. and Accent Therapeutics, Inc.

Figures

Fig 1.
Fig 1.. Design of EZH2 putative degraders 2–13 and their effect on inducing EZH2 protein degradation in L-363 cells.
(A) Chemical structures of compounds 1–13. (B) Immunoblotting showing the EZH2 protein level post-treatment with compounds 2–13 at 0.5 and 2.5 μM for 24 h in L-363 cells. DMSO was used as control. (C, E) Immunoblotting of the protein levels of EZH2 and H3K27me3 in MM1.S (C) or L-363 (E) cells post-treatment with MS177, C24, MS177N1 or MS177N2 at indicated concentrations versus DMSO, for 24 h. (D, F) Determination of DC250 values of MS177 in MM1.S (D) or L-363 (F) cells, based on immunoblotting quantifications with ImageJ software from two independent experiments (mean ± S.D.) (G) Time-dependent EZH2 depletion by MS177 (0.5 or 2.5 μM) in L-363 cells. (H) Immunoblotting of the indicated proteins in L-3363 cells either stably expressing EV or HA tagged EZH2-SET domain post-treatment of 2.5 μM of MS177 for 24 h. DMSO serves as control. (I, J) EZH2 immunoblots using MM1.S cells pretreated with DMSO (lanes 1 and 3), pomalidomide (I, 2.5 μM, lanes 2 and 4) or MLN4924 (J, 0.4 μM, lanes 2 and 4) for 2 h, and then subjected to an additional 14 h treatment with DMSO (lanes 1 and 2) or MS177 (0.5 μM, lanes 3 and 4).
Fig 2.
Fig 2.. MS177 decreases genomic binding of both EZH2 and H3K27me3 in MM1.S cells.
(A-B) Average intensities (top panel) and heatmaps (bottom panel) for CUT&RUN signals (normalized against spike-in controls and sequencing depth) of EZH2 and H3K27me3 ± 5 kb around the centers of EZH2 (A) and H3K27me3 (B) peaks in MM1.S cells post-treatment with DMSO or 2.5 μM of MS177 for 24 h. (C-E) IGV views of EZH2 and H3K27me3 binding (spike-in control and depth normalized) at HOXB clusters (C) CDKN1C (D) or UNC5B (E) post-treatment of MM1.S cells with DMSO or 2.5 μM of MS177.
Fig 3.
Fig 3.. EZH2 noncanonically interacts with cMyc and co-localizes with gene activation markers in MM cells.
(A) Heatmaps showing the K-means clustered EZH2 and H3K27me3 CUT&RUN signal intensities ± 5 kb around peak centers in MM1.S cells. EZH2-’solo’ and EZH2-’ensemble’ refer to non-canonical EZH2 + /H3K27me3− peaks (cluster 3) and canonical EZH2 + /H3K27me3+ ones (clusters 1–2), respectively. (B) Averaged EZH2 and H3K27me3 CUT&RUN signals around ± 5 kb from the centers of the cluster 1–3 in MM1.S cells. (C) Motif search analysis showing E-box motif enriched in the EZH2-’solo’-binding peaks in MM1.S cells. (D) Co-IP for interactions between endogenous cMyc and EZH2 in L-363 cells. (E) Heatmaps for EZH2, cMyc, MAX, H3K27me3, H3K27ac, H3K4me3 and Pol II ± 5 kb from the center of non-canonical EZH2+H3K27me3– peaks (that is, EZH2-’solo’; top) or canonical EZH2+H3K27me3+ peaks (that is, EZH2-’ensemble’; bottom) in MM1.S cells. With the exception of EZH2 and H3K27me3, which was mapped using CUT&RUN, all the others were mapped using ChIP-seq. (F) Venn diagram showing the overlap of EZH2-’solo’ sites with cMyc sites in MM1.S cells. (G) Log2-transformed RPGC counts for CUT&RUN signals of EZH2 (left) and H3K27me3 (right) at those EZH2-’solo’ or EZH2-’ensemble’ sites identified in MM1.S cells, treated for 24 h with DMSO or 2.5 μM of MS177. The boundaries of box plots indicate the 25th and 75th percentiles, the center line indicates the median, and the whiskers (dashed) indicate 1.5× the interquartile range. Unpaired two-sided t-test. (H) Immunoblotting of cMyc in L-363 (left panel) and MM1.S (right panel) cells after treatment with the indicated concentration of MS177, versus DMSO, for 24 h. (I) EZH2 protein levels (left panel) following EZH2 knockdown (KD; shEZH2) and EZH2 knockout (KO, sgEZH2), relative to empty vector (Con) controls, in L-363 cells. Immunoblotting of cMyc (right panel) in L-363 cells with shEZH2 or sgEZH2 after treatment with the indicated concentration of MS177, or DMSO for 16 h. GAPDH was used as the loading control. (J) RT-qPCR for cMyc gene expression level in L-363 cells, treated with 0.5 and 2.5 μM of MS177 versus DMSO for 16 h. The y-axis shows averaged signals after normalization to GAPDH and to mock-treated samples (n = 3; mean ± SD). (K) Co-IP for interactions between CRBN and cMyc and EZH2, respectively, in L-363 cells treated with DMSO, C24 (0.5 μM) and MS177 (0.5 μM) for 12 h by using anti-CRBN antibody for IP. IgG serves as a negative control.
Fig 4.
Fig 4.. MS177 represses both PRC2 and cMyc-related oncogenic nodes.
(A-C) Volcano plots showing transcriptomic alterations in MM1.S cells following treatment with 0.5 μM of MS177 (A), C24 (B) or MS177N1 (C), compared to DMSO, for 24 h. DEGs with significant expression changes were highlighted. (D) Box plots showing the log2 ratios for DEGs upregulated in MM1.S cells after treatment with MS177 versus DMSO. Comparison was indicated on x-axis, including MS177 vs. DMSO, C24 vs. DMSO, and MS177N1 vs. DMSO. (E) Venn diagram using DEGs upregulated (up) in MM1.S cells after treatment of MS177 and those after PHF19 knock-down (KD) relative to DMSO. (F) Boxplot showing the mean vst normalized expression of the PHF19-repressed transcripts in MM1.S cells, after treatment with 0.5 μM of DMSO, MS177, C24 or MS177N1 for 24 h (n = 2). EZH2-repressed genes are defined in E after PHF19 KD versus DMSO. The boundaries of box plots indicate the 25th and 75th percentiles, the center line indicates the median, and the whiskers (dashed) indicate 1.5× the interquartile range. Paired two-sided t-test was used. P value were adjusted for multiple testing using the bonferroni correction. (G) Heatmap of GSEA normalized enrichment score (NES) values revealing that MS177 treatment is highly correlated with de-repression of the PRC2- or H3K27me3-repressed genes. (H) The volcano plot shows the enrichment of MSigDB gene sets for the downregulated DEGs by MS177 treatment in MM1.S cells. Each point represents a single gene set; the x-axis measures the odds ratio (0, inf) calculated for the gene set, while the y-axis indicates the −log (p value) of the gene set. Larger blue points represent significant terms (p value < 0.05); smaller gray points represent non-significant terms. (I) Summary of GSEA results showing the correlation of the indicated Myc-related gene sets with MS177 treatment relative to mock. Yellow and blue in the heatmap indicate positive and negative correlations, respectively. (J) Box plots showing the log2 ratios for DEGs bound by cMyc in MM1.S cells. Comparison was indicated on x-axis, including MS177 vs. DMSO, C24 vs. DMSO, and MS177N1 vs. DMSO. The boundaries of box plots indicate the 25th and 75th percentiles, the center line indicates the median, and the whiskers (dashed) indicate 1.5× the interquartile range. Unpaired two-sided t-test was used. (K) RT-qPCR of cMyc-mediated upregulated targets in MM1.S cells after treatment with indicated concentrations of MS177 for 24 h. The y axis shows signals after normalization to DMSO-treated cells (n = 3; mean ± S.D.; unpaired two-tailed t-test). *, **, and *** denote P < 0.05, 0.01 and 0.005, respectively. NS denotes not significant.
Fig 5.
Fig 5.. MS177 treatment reactivates immune response genes
(A) The volcano plot showing Gene Ontology (GO) analysis of the up-regulated DEGs by MS177 treatment in MM1.S cells. Each point represents a single gene set; the x-axis measures the odds ratio (0, inf) calculated for the gene set, while the y-axis gives the −log(p-value) of the gene set. Larger blue points represent significant terms (p value < 0.05); smaller gray points represent non-significant terms. Immune related pathways are indicated. (B) GSEA showing that, relative to controls, MS177 treatment in MM1.S cells are positively correlated with upregulation of the MHC class II presenting-related gene sets. (C) Heatmap showing immune related gene expression changes in MM1.S cells after MS177, C24, or MS177N1 treatment compared to DMSO. (D) RT-qPCR for immune response genes in MM1.S cells after the treatment of 0.5 mM of C24 and MS177, respectively, for 24 h. Y-axis shows signals after normalization to DMSO-treated cells (n = 3; mean ± SD; unpaired two-tailed Student’s t-test). *, **, and *** denote P < 0.05, 0.01 and 0.005, respectively. ns denotes not significant. (E) IGV views of H3K27me3 and EZH2 binding (spike-in control and depth normalized) at CIITA or HLA-DPB post-treatment with DMSO or 2.5 μM of MS177 for 24 h in MM1.S cells.
Fig 6.
Fig 6.. MS177 effectively inhibits the growth of MM cells.
(A) EC50 values of MS177, C24 and MS177N1 in a panel of MM cell lines after 4 days of treatment (n = 3). (B) Plots showing the growth inhibitory effects of MS177 at indicated concentrations (x-axis; in the log10 converted values) in the indicated MM cells after 2-day treatment. Y-axis shows relative growth after normalization to DMSO-treated cells (n = 3; mean ± S.D.). (C) Plots showing the growth inhibitory effects of MS177 at indicated concentrations (x-axis; in the log10 converted values) in either wild-type (WT) or CRBN−/− MM1.S cells after 2-day or 4-day treatment. Y-axis shows relative growth after normalization to DMSO-treated cells (n = 3; mean ± S.D.). (D) Immunoblotting of the protein levels of EZH2, IKZF1 and IKZF3 in L-363 cells post-treatment with MS177N1, MS177N2, MS177, C24, pomalidomide (Pom) or the combination of C24 and Pom at 2.5 mM versus DMSO, for 24 h. (E) Growth inhibitory effect of DMSO, MS177N1, MS177N2, MS177, C24, Pom and the combination of C24 and Pom (x-axis) at 2.5 mM in the L-363 cells after 2-day treatment. Y-axis shows relative growth after normalization to DMSO-treated cells (n = 3; mean ± SD; unpaired two-tailed Student’s t-test). *, **, and *** denote P < 0.05, 0.01 and 0.005, respectively. NS denotes not significant. (F) Representative views of soft agar-based assay (left panel) and quantifications of colony formation (right panel; colony numbers counted by ImageJ and presented in average ± S.D. of two independent experiments) of MM1.S cells post-treatment with DMSO, 2.5 μM of MS177N1 or C24, or three indicated concentrations (0.5, 1, or 2.5 μM) of MS177. *, **, and *** denote P < 0.05, 0.01 and 0.005, respectively. ns denotes not significant. Unpaired two-tailed Student’s t-test. (G) and (H) Apoptosis analysis after a 24-h treatment with the indicated compounds in MM1.S cells. (I) Immunoblotting for the indicated apoptotic markers in MM1.S cells, treated with either 2.5 μM of MS177N1 or C24 or indicated concentrations (0.5, 1, or 2.5 μM) of MS177, compared to DMSO, for 24 h.
Fig 7.
Fig 7.. MS177 suppresses MM tumor growth in vivo.
(A-B) Averaged tumor volume (A) and Kaplan-Meier curve (B) of MM1.S subcutaneous (s.c.) xenograft mouse models after treatment with vehicle, MS177 or C24 at indicated dosage (n = 5 per group; mean ± S.D.). Statistical significance was determined by two-way ANOVA (A), log-rank (Mantel-Cox, B) test. (C-E) Bioluminescent images (C), signal levels (D) and Kaplan–Meier curves (E) of NSG mice transplanted intravenously (i.v.) with the luciferase-labelled MM1.S cells after treatment with vehicle or the indicated MS177 dosage (n = 5 per group; mean ± S.D.). Statistical significance was determined by two-way analysis of variance (ANOVA; D) or log-rank (Mantel-Cox, E) test. (F-G) Body weight change of NSG mice bearing the MM1.S tumors, xenografted either subcutaneously (s.c.; F) or intravenously (i.v.; G), as measured from the starting time point of treatment with the indicated dose of vehicle or MS177 over a course of 21 or 25 days (mean ± S.D.).

Similar articles

Cited by

References

    1. Cowan AJ, Green DJ, Kwok M, Lee S, Coffey DG, Holmberg LA et al. Diagnosis and Management of Multiple Myeloma: A Review. JAMA 2022; 327: 464–477. - PubMed
    1. van de Donk NWCJ, Pawlyn C, Yong KL. Multiple myeloma. The Lancet 2021; 397: 410–427. - PubMed
    1. Kuehl WM, Bergsagel PL. Multiple myeloma: evolving genetic events and host interactions. Nat Rev Cancer 2002; 2: 175–187. - PubMed
    1. Kyle RA, Therneau TM, Rajkumar SV, Offord JR, Larson DR, Plevak MF et al. A long-term study of prognosis in monoclonal gammopathy of undetermined significance. N Engl J Med 2002; 346: 564–569. - PubMed
    1. Morgan GJ, Walker BA, Davies FE. The genetic architecture of multiple myeloma. Nat Rev Cancer 2012; 12: 335–348. - PubMed

Publication types

MeSH terms