. 2023 Mar;26(3):406-415.
doi: 10.1038/s41593-023-01257-z. Epub 2023 Feb 6.

Perivascular cells induce microglial phagocytic states and synaptic engulfment via SPP1 in mouse models of Alzheimer's disease

Affiliations

Perivascular cells induce microglial phagocytic states and synaptic engulfment via SPP1 in mouse models of Alzheimer's disease

Sebastiaan De Schepper et al. Nat Neurosci. 2023 Mar.

Abstract

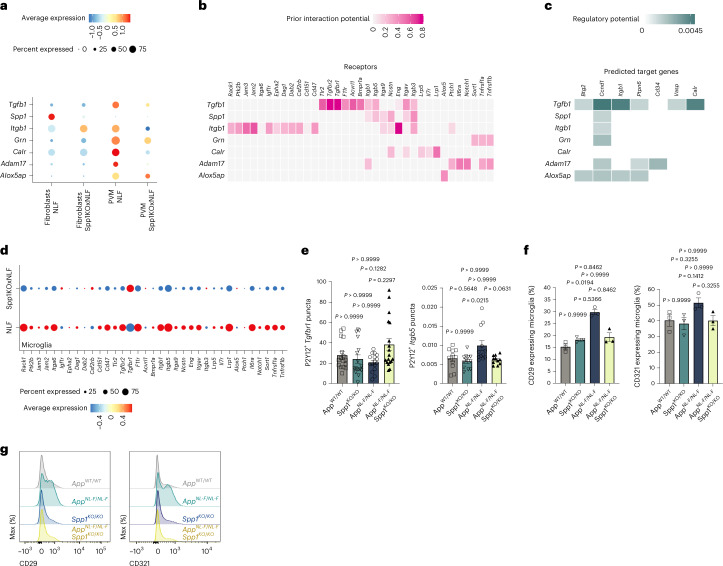
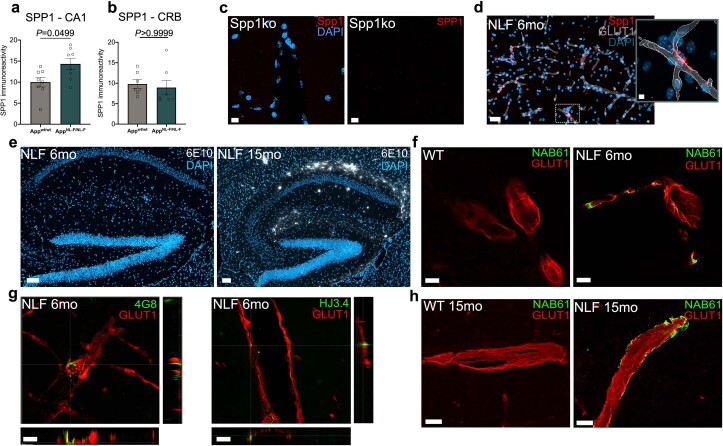
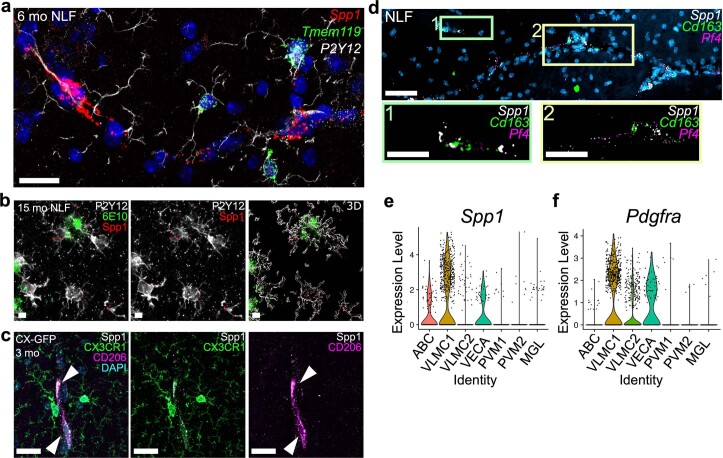
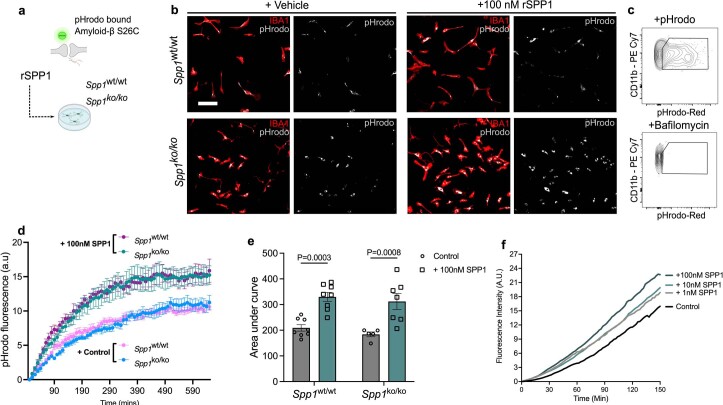
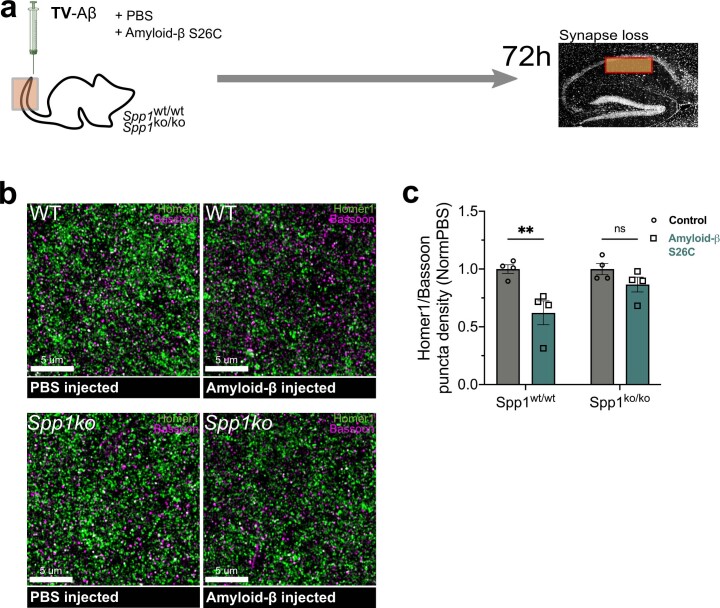
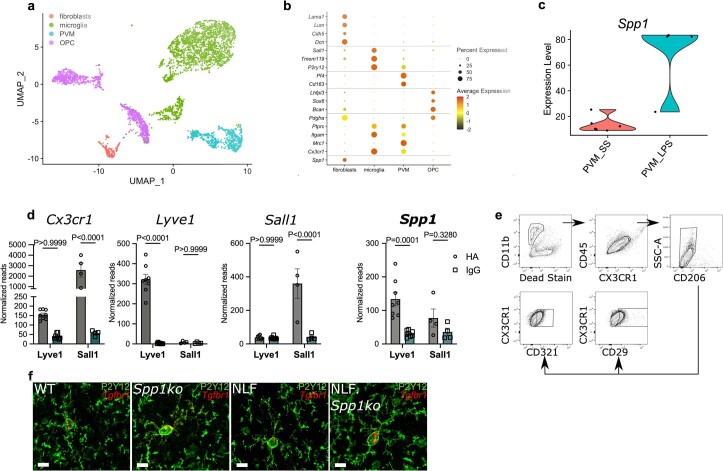
Alzheimer's disease (AD) is characterized by synaptic loss, which can result from dysfunctional microglial phagocytosis and complement activation. However, what signals drive aberrant microglia-mediated engulfment of synapses in AD is unclear. Here we report that secreted phosphoprotein 1 (SPP1/osteopontin) is upregulated predominantly by perivascular macrophages and, to a lesser extent, by perivascular fibroblasts. Perivascular SPP1 is required for microglia to engulf synapses and upregulate phagocytic markers including C1qa, Grn and Ctsb in presence of amyloid-β oligomers. Absence of Spp1 expression in AD mouse models results in prevention of synaptic loss. Furthermore, single-cell RNA sequencing and putative cell-cell interaction analyses reveal that perivascular SPP1 induces microglial phagocytic states in the hippocampus of a mouse model of AD. Altogether, we suggest a functional role for SPP1 in perivascular cells-to-microglia crosstalk, whereby SPP1 modulates microglia-mediated synaptic engulfment in mouse models of AD.


Conflict of interest statement

The authors declare no competing interests.

Figures

Fig. 1
Fig. 1. SPP1 upregulation at onset of microglia–synapse phagocytosis.
a, Representative 3D reconstructed images showing Homer1 engulfment within CD68+ lysosomes of P2Y12+ microglia in 6-month AppWT (WT) versus AppNL-F CA1 hippocampal SLM. Scale bar represents 5 µm. b, Quantification of Homer1 engulfment in 6-month WT and AppNL-F P2Y12+ microglia. One datapoint represents one individual P2Y12+ microglia with a total of 24–27 ROIs pooled from n = 4 animals per genotype examined over two independent experiments. P values from two-tailed unpaired Student’s t-test. c, Representative confocal images of C1q protein expression in 6-month WT versus AppNL-F mice. Insert represents C1qa mRNA within Tmem119+ microglia. Scale bar represents 20 µm. Data are representative of two mice per genotype examined over at least five independent experiments. d, Quantification of C1q puncta in 6-month WT and AppNL-F CA1 hippocampus. One datapoint represents one ROI per mouse from n = 9 WT mice and n = 8 AppNL-F mice examined over two independent experiments. Average amount of cells per datapoint is 30–40. P values from two-tailed Mann–Whitney test. e,f, 3D-τ-STED imaging of secreted SPP1 in 6-month WT and AppNL-F SLM (e) and quantification of SPP1 total fluorescence particles (f). One datapoint represents one ROI per mouse, with total of n = 3 mice examined over one independent experiment. P values from two-tailed Mann–Whitney test. Scale bar represents 2 µm. g,h, Quantification of Spp1 expression within hippocampus of 6-month WT versus AppNL-F as measured by smFISH in hippocampus (g) or via qPCR on hippocampal homogenates (h). One datapoint represents one individual value per mouse, with total of n = 5–6 mice (per genotype) (g) or 4–5 mice (per genotype) (h) examined over two independent experiments. P values from two-tailed Mann–Whitney test. i, Representative 3D reconstruction of SPP1 adjacent to GLUT1+ vasculature in SLM of 6-month AppNL-F. Scale bar represents 10 µm. Image representative of two AppNL-F mice examined over four independent experiments. j, Representative images of SPP1 expression along vasculature in postmortem hippocampal brain slices of three AD patients. Images are representative of six AD patients (see also Supplementary Table 1). Scale bar represents 20 µm. Data are shown as mean ± s.e.m. Source data
Fig. 2
Fig. 2. SPP1 is expressed by PVMs and fibroblasts.
ac, Representative images of Spp1 mRNA expression juxtaposed to GLUT1+ vasculature, colocalizing with pan-PVM markers Cd163 (a), CD206 (b) and PVF (Pdgfra+) (c) in 6-month AppNL-F SLM as characterized by smFISH-IHC. Scale bar represents 10 µm. Data are representative of four AppNL-F mice examined over two independent experiments. df, Representative FACS plots to identify PVMs (CX3CR1+CD45+CD11b+CD206+ (d), microglia CX3CR1highCD45+CD11b+ (e) or gated on total TdT expressing cells isolated from Spp1TdT hippocampal homogenates and quantification (f)). One datapoint represents one cell type per mouse (PVM, PVF and microglia) pooled from n = 7 mice examined over two independent experiments (f). P values from one-way ANOVA, Kruskal–Wallis test. g, Three-dimensional reconstruction of CD206+ PVMs expressing SPP1-Td along GLUT1+ vessels in SLM from Spp1TdT mice. Scale bar represents 7 µm. Data are representative of three Spp1TdT mice examined over two independent experiments. h, Representative single serial section SEM backscatter electron image of a representative SPP1-TdT-positive PVM as identified by CLEM (Upper). SPP1-TdT-positive cell manually pseudocolored red, together with neuropil (pink), astrocytes (lilac), smooth muscle cells (purple), endothelial cells (cyan) and other perivascular cells (green), shown with reduced opacity over the electron microscopy data (lower). Accompanying confocal overlays and correlation images shown in Extended Data Fig. 3e,d array tomography data shown in Supplementary Video 1. Scale bar represents 10 µm. i, Representative image of perivascular SPP1 in AD postmortem hippocampal tissue, costained with CD206. Scale bar represents 25 µm. Data are representative of n = 6, six different patient tissues (Supplementary Table 1). Data are shown as mean ± s.e.m. TdT, TdTomato. Source data
Fig. 3
Fig. 3. Spp1 modulates complement activation and microglial synaptic engulfment upon acute oAβ challenge.
a, Scheme illustrating ICV injection of S26C oAβ versus PBS in WT versus Spp1KO/KO mice, 18 h before tissue collection and analysis. b, Quantification of SPP1 immunoreactivity within SLM of 3-month WT mice injected with oAβ versus PBS control, at either 18 h or 72 h post-ICV injection. One datapoint represents one ROI per mouse hippocampus, with total of n = 3 mice per genotype and time point, examined over one independent experiment. P values from two-way ANOVA. c, Representative images of C1q expression in SLM of 3-month PBS versus oAβ-injected WT mice. Scale bar represents 20 µm. d, Representative 3D reconstructed images showing Homer1 engulfment within CD68+ lysosomes of P2Y12+ microglia from WT mice injected with oAβ. Scale bar represents 5 µm. e, Representative images of C1q expression in Spp1KO/KO mice injected with PBS versus oAβ. f, Representative 3D reconstructed images showing Homer1 engulfment within CD68+ lysosomes of microglia from Spp1KO/KO mice injected with oAβ. Scale bar represents 5 µm. g, Quantification of C1q particles (puncta) in WT or Spp1KO/KO mice treated with either PBS or oAβ, as in c and e. One datapoint represents one ROI, with total of 10 (WT) and 9 (Spp1KO/KO) ROIs pooled from n = 3 mice per genotype, examined over two independent experiments. P values from two-way ANOVA. h, Quantification of Homer1 engulfment in WT or Spp1KO/KO P2Y12+ microglia, ICV treated with either PBS or oAβ, as in d and f. One datapoint represents one individual P2Y12+ microglia with a total of 15–16 cells pooled from n = 2 animals per genotype examined over two independent experiments. P values from two-way ANOVA. Data are shown as mean ± s.e.m. Source data
Fig. 4
Fig. 4. SPP1 drives microglial engulfment of synapses in AD context.
ad, Representative image of 3D reconstructed P2Y12+ microglia expressing phagocytic markers Ctsb (a,b) and Grn (c,d) assessed by smFISH-IHC in 6-month WT, Spp1KO/KO, AppNL-F and AppNL-F·Spp1KO/KO SLM. Scale bar represents 7 µm. Quantification of Ctsb (b) and Grn (d) mRNA levels expression within P2Y12+ microglia. One datapoint represents one individual P2Y12+ microglia with a total of 18 microglia (b) and 18 (WT, Spp1KO/KO), 17 (AppNL-F) and 15 (AppNL-F·Spp1KO/KO) microglia (d) pooled from n = 3 mice per genotype examined over two independent experiments. P values from one-way ANOVA, Kruskal–Wallis test. e, Representative 3D reconstructed images showing Homer1 engulfment within CD68+ lysosomes of P2Y12+ microglia in 6-month AppNL-F versus AppNL-F·Spp1KO/KO SLM. Scale bar represents 7 µm. f, Quantification of Homer1 engulfment ratio in P2Y12+ microglia of WT versus Spp1KO/KO versus AppNL-F versus AppNL-F·Spp1KO/KO mice. One datapoint represents one individual P2Y12+ microglia with a total of 23 (WT, AppNL-F), 24 (Spp1KO/KO) and 25 (AppNL-F·Spp1KO/KO) microglia pooled from n = 3 mice per genotype examined over two independent experiments. P values from one-way ANOVA, Kruskal–Wallis. g, Representative super-resolution images of Homer1 and Bassoon puncta colocalization in 6-month WT, Spp1KO/KO, AppNL-F and AppNL-F·Spp1KO/KO SLM. Scale bar represents 5 µm. h, Quantification of Homer1/Bassoon colocalization density normalized to WT or Spp1KO/KO accordingly. One datapoint represents the average of one animal (3–5 ROIs per animal) with a total of n = 4 animals per genotype. P < 0.0066 (WT) and 0.0831 (Spp1KO/KO) from two-way ANOVA, Bonferroni’s multiple comparison test. Data are shown as mean ± s.e.m. Source data
Fig. 5
Fig. 5. Spp1 regulates perivascular–microglial interaction networks.
a, Expression level of selected ligands expressed by cell types known to express Spp1 (PVF and PVM), by cell type and genotype. Radius of dot is proportional to the percentage of cells expressing the gene; color is the scaled gene expression level. b, Predicted receptor genes for ligands represented in a, which show differential expression in microglia (receiver cells). Color represents the predicted interaction potential. c, Predicted target genes downstream of receptors identified in b, which show differential expression in microglia (receiver cells). Color represents the predicted regulatory potential. d, Expression of predicted receptor genes in microglia, by genotype. Radius of dot is proportional to the percentage of cells expressing the gene; color is the scaled gene expression level. e, Quantification of Tgfbr1 and Itgb5 mRNA levels expressed by P2Y12+ microglia assessed by smFISH-IHC in 6-month WT, Spp1KO/KO, AppNL-F and AppNL-F·Spp1KO/KO SLM. One datapoint represents one individual P2Y12+ microglia with a total of 11 (WT, AppNL-F·Spp1KO/KO) and 12 (Spp1KO/KO, AppNL-F) microglia (Itgb5) or 16 (WT, AppNL-F), 17 (Spp1KO/KO) and 18 (AppNL-F·Spp1KO/KO) microglia (Tgfbr1) pooled from n = 3 animals per genotype examined over one independent experiment. P values from one-way ANOVA, Kruskal–Wallis test with Dunn’s multiple comparisons test. f, Quantification of NicheNet hits CD29 (Itgb1) and CD321 (F11r) on microglia (CX3CR1highCD45+CD11b+ CD206-) isolated from hippocampal homogenates of 6-month WT, Spp1KO/KO, AppNL-F and AppNL-F·Spp1KO/KO animals. One datapoint represents one individual mouse (microglia) pooled from n = 3 mice from one experiment. P values from one-way ANOVA, Kruskal–Wallis test with Dunn’s multiple comparisons test. g, Flow cytometry profiles of the protein expression intensity of CD29 and CD321 on microglia of the four genotypes. Data are shown as mean ± s.e.m. See also Extended Data Fig. 6 and Supplementary Table 2. Source data
Extended Data Fig. 1
Extended Data Fig. 1. Pre-plaque vascular Aβ deposition in AppNL-F mice.
(a, b) Quantification of SPP1 immunoreactivity in CA1 hippocampus (a) versus cerebellum as control region (b), as measured by confocal imaging. 1 datapoint represents 1 ROI per mouse hippocampus, with total of 8 (CA1, a) and 7 (CRB, b) ROI from n = 3 mice per genotype examined over 2 independent experiments. P Values from Two-tailed Mann-Whitney test. Data are shown as Mean ± SEM. (c) Validation of SPP1 antibody (left) and anti-Spp1 probe for smFISH (right) in 3 mo Spp1KO/KO hippocampal tissue. Scale bar represents 10 µm. Data representative of n = 4 Spp1KO/KO mice examined over 1 independent experiment. (d) Representative confocal image of Spp1 mRNA expression along GLUT1+ vasculature in SLM of 6 mo AppNL-F mice as characterized by smFISH-IHC. Scale bar represents 20 µm. Insert: 3D reconstruction. Scale bar represents 5 µm. Data are representative of 3 AppNL-F mice examined over at least 4 independent experiments. (e) Representative confocal images showing 6E10 plaque staining in hippocampus of 6 mo versus 15 mo AppNL-F mice. Scale bar represents 100 µm. Data representative of n = 3 AppNL-F mice mice per time point, examined over 2 independent experiments. (f) Representative confocal images showing oAβ around GLUT1+ blood vessels as characterized by NAB61 immunoreactivity in 6 mo WT versus 6 mo AppNL-F SLM. Scale bar represents 10 µm. Data representative of n = 3 mice per genotype, examined over 2 independent experiments. (g) Representative confocal images showing vascular oAβ deposition using alternative antibodies 4G8 and HJ3.4 that recognize Aβ17-24 and Aβ1-13, respectively, in 6 mo AppNL-F SLM. Scale bar represents 10 µm. Data representative of n = 3 AppNL-F mice examined over 2 independent experiments. (h) Representative confocal images showing vascular oAβ (NAB61) in 15 mo WT versus AppNL-F SLM. Scale bar represents 20 µm. Source data
Extended Data Fig. 2
Extended Data Fig. 2. Spp1 is expressed in perivascular cells.
(a) Representative confocal image showing Spp1 and Tmem119 mRNA expression within P2Y12+ microglia of 6 mo AppNL-F SLM as characterized by smFISH-IHC. Scale bar represents 20 µm. Data representative of n = 8 AppNL-F mice examined over 3 independent experiments. (b) Representative confocal image showing Spp1 mRNA in P2Y12 microglia associated with 6E10+ plaques in 15 mo AppNL-F SLM. Scale bar represents 5 µm. Data representative of n = 3 AppNL-F mice examined over 2 independent experiments. (c) Representative confocal images of SPP1 protein expression in CD206+ PVMs (arrow head) and CX3CR1GFP myeloid cells of 3 mo Cx3cr1GFP/WT SLM. Scale bar represents 20 µm. Data are representative of n = 2 Cx3cr1GFP/WT mice examined over at least 3 independent experiments. (d) Representative confocal image showing Spp1 mRNA expression occasionally colocalizing with pan-PVM markers Cd163 and Pf4 in 6 mo AppNL-F SLM as identified by smFISH. Scale bar represents 50 µm. Data representative of n = 6 AppNL-F mice examined over 2 independent experiments. (e, f) Violin plots of Spp1 (e) and Pdgfra (f) expression reanalyzed from Zeisel et al.. VLMC, vascular leptomeningeal cells; ABC, Arachnoid barrier cells; VECA, Arterial vascular endothelial cells; PVM, Perivascular macrophage; MGL, Microglia.
Extended Data Fig. 3
Extended Data Fig. 3. Spp1TdT reporter mouse development.
(a) Design of the knock-in allele is shown, with an IRES and TdTomato (TdT) reporter inserted at the stop codon in exon 7 in the mouse Spp1 locus. Top, the mouse locus with locations of primers used for validation of the inserted construct and later genotyping for the reporter construct is shown. Below, schematic displays the upstream (5’HA) and downstream (3’HA) homology arms in blue; IRES in aqua; TdT reporter gene in red; and bovine growth hormone poly(A) region in yellow. (b) PCR primers used to confirm incorporation of construct are listed, with primer names based on genomic locations as shown in B. Gel shows appropriate size bands for incorporation of plasmid construct (lane 1), for left arm integration event (lane 2) and right arm integration event (lane 3). Primer pairs for plasmid backbone alone are negative (lanes 4 and 5). (c) Representative confocal image showing SPP1-TdT expression along GLUT1+ vessels in hippocampus of 3 mo Spp1TdT reporter mice. (d) Left panels show low magnification overview of SPP1-TdT+ cell (red), and all nuclei (blue) in the hippocampus, as shown in Fig. 2h, scale bar 50 µm. Top, maximum intensity projection of confocal stack; middle, maximum intensity projection shown at reduced opacity over the correlated back scattered electron image of serial section 79 of the same region of the CLEM sample; bottom, back scattered electron image of serial section 79 of the same region of the CLEM sample alone. Box highlights region acquired across 200 serial sections. Right panels show boxed region at higher magnification with serial section 85. Scale bar represents 10 µm. Data representative of n = 4 Spp1TdT mice examined over 2 independent experiments. (e) Two additional CLEM examples of SPP1-TdT+ cells targeted and correlated with volume electron microscopy. Left panels show maximum intensity projection of confocal stack; middle panels, maximum intensity projection shown at reduced opacity over the correlated back scattered electron image of a central serial section of the same region of the CLEM sample; right panels, back scattered electron image of the same region of the CLEM sample alone. Scale bar represent 5 µm. Data representative of n = 4 Spp1TdT mice examined over 2 independent experiments.
Extended Data Fig. 4
Extended Data Fig. 4. Primary microglia engulf synaptosomes through extrinsic SPP1.
(a) Schematic illustrating in vitro engulfment assay whereby primary microglia isolated from WT or Spp1KO/KO mice phagocytose S26C oAβ-treated synaptosomes that are tagged with pHrodo upon PBS or recombinant SPP1 treatment. (b) Representative images showing engulfment of pHrodo-synaptosomes by primary microglia isolated from WT mice (upper panel) or Spp1KO/KO mice (lower panel), treated with vehicle (left) or 100 nM recombinant SPP1 (right). Data are representative of primary microglial cultures prepared from n = 6−8 neonates per genotype, examined over 2 independent experiments. Scale bar represents 100 µm. (c) Representative FACS plot showing pHrodo signal in CD11b+ cells collected from primary microglial culture (upper). No pHrodo signal was observed after Bafilomycin treatment, confirming lysosomal acidification as the source of pHrodo signal (lower). Data are representative of 2 independent experiments. (d) pHrodo fluorescence (arbitary fluorescence units) over 600 min (3–5 min intervals, synaptosomes added at t = 0) in primary microglia isolated from WT mice or Spp1KO/KO mice, treated with control versus 100 nM recombinant SPP1. 1 datapoint represents 2–4 ROIs (approximately 40 microglia per ROI). Primary microglial cultures have been prepared from n = 6−8 neonates per genotype, examined over of 2 independent experiments. Data are shown as Mean ± SEM. (e) Area under curve quantification of pHrodo-synaptosome engulfment within primary WT versus Spp1KO/KO microglia (d), treated with control versus 100 nM recombinant SPP1. 1 datapoint represents area under the curve (AUC) at 3 h of 2–4 ROIs (approximately 40 microglia per ROI). Primary microglial cultures have been prepared from n = 6−8 neonates per genotype, examined over of 2 independent experiments. P Values from two way ANOVA, Bonferroni’s multiple comparison test. Data are shown as Mean ± SEM. (f) Graph showing fluorescence intensity of pHrodo within primary WT microglial lysosomes over time (min), either in the presence of control or 1, 10 and 100 nM recombinant SPP1. Representative of 2 independent experiments. Source data
Extended Data Fig. 5
Extended Data Fig. 5. SPP1 deficiency prevents synapse loss upon oAβ challenge.
(a) Scheme illustrating tail vein (TV) injection of 100ng S26C oAβ versus PBS in WT versus Spp1KO/KO mice, 72 h before tissue collection and analysis. (b) Representative super-resolution images of Homer1 and Bassoon puncta colocalization in 3 mo WT and Spp1KO/KO SR injected with oAβ versus PBS control, at 72 h post-TV injection. Scale bar represents 5 µm. (c) Quantification of Homer1/Bassoon colocalization density, represented as S26C oAβ-injected mice normalized to PBS injected mice. 1 datapoint represents the average of 1 animal (3–5 ROIs per animal, 40 cells per ROI) with a total of n = 4 mice per genotype. Data are from one experiment. P Values from two-way ANOVA, Bonferroni’s multiple comparison test. Data are shown as Mean ± SEM. Source data
Extended Data Fig. 6
Extended Data Fig. 6. scRNA-seq and translatome analysis of perivascular cells and microglia.
(a) UMAP plot of 4,238 cells, color-coded based on the inferred cell type. (b) DotPlot of gene expression for a series of known cell type markers for fibroblasts (Lama1, Lum, Cdh5, Dcn), microglia (Sall1, Tmem119, P2ry12), PVMs (Pf4, Cd163), and OPC (Lhfpl3, Sox6, Bcan). Expression of genes encoding for markers used for FACS of cells prior to scRNA-seq (Pdgfra, Ptprc, Itgam, Mrc1, Cx3cr1) and for Spp1 is also included. Radius of dot is proportional to the percentage of cells expressing the gene, color is the scaled gene expression level. (c) Violin plot of Spp1 expression reanalyzed from Jung-Seok Kim et al.. (d) RiboTag-based translatome analysis of pooled oAβ and PBS-challenged brain homogenates of Cx3cr1ccre:Lyve1ncre (n = 8 mice) and Cx3cr1ccreSall1ncre:RiboTag-mice (n = 4 mice). Normalized reads of pan macrophage marker (Cx3cr1), PVM marker (Lyve1), microglia marker (Sall1) and Spp1. P Values from two-way ANOVA, Bonferroni’s multiple comparison test. Data are shown as Mean ± SEM. Data are from 1 independent experiment. (e) Gating strategy to identify CD321 (F11r) and CD29 (Itgb1) expression in microglia (CX3CR1highCD45+ CD206- CD11b+). (f) Representative image of P2Y12+ microglia expressing tgfbr1, assessed by smFISH-IHC in 6 mo AppNL-F and AppNL-F.Spp1KO/KO SLM. Scale bar represents 10 µm. Data representative of n = 3 mice per genotype examined over 1 independent experiment.

Similar articles

Cited by

References

    1. Arandjelovic, S. & Ravichandran, K. S. Phagocytosis of apoptotic cells in homeostasis. Nat. Immunol.16, 907–917 (2015). - PMC - PubMed
    1. Kierdorf, K., Masuda, T., Jordão, M. J. C. & Prinz, M. Macrophages at CNS interfaces: ontogeny and function in health and disease. Nat. Rev. Neurosci.20, 547–562 (2019). - PubMed
    1. Schafer, D. P. et al. Microglia sculpt postnatal neural circuits in an activity and complement-dependent manner. Neuron74, 691–705 (2012). - PMC - PubMed
    1. Cserép, C. et al. Microglia monitor and protect neuronal function through specialized somatic purinergic junctions. Science367, 528–537 (2020). - PubMed
    1. Paolicelli, R. C. et al. Synaptic pruning by microglia is necessary for normal brain development. Science1456, 10–13 (2013). - PubMed

Publication types