. 2023 Feb;9(2):238-254.
doi: 10.1038/s41477-022-01333-5. Epub 2023 Feb 6.

Newly identified sex chromosomes in the Sphagnum (peat moss) genome alter carbon sequestration and ecosystem dynamics

Affiliations

Newly identified sex chromosomes in the Sphagnum (peat moss) genome alter carbon sequestration and ecosystem dynamics

Adam L Healey et al. Nat Plants. 2023 Feb.

Abstract

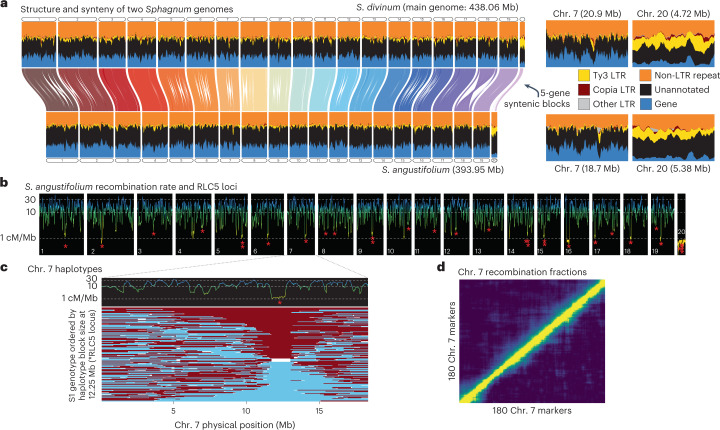
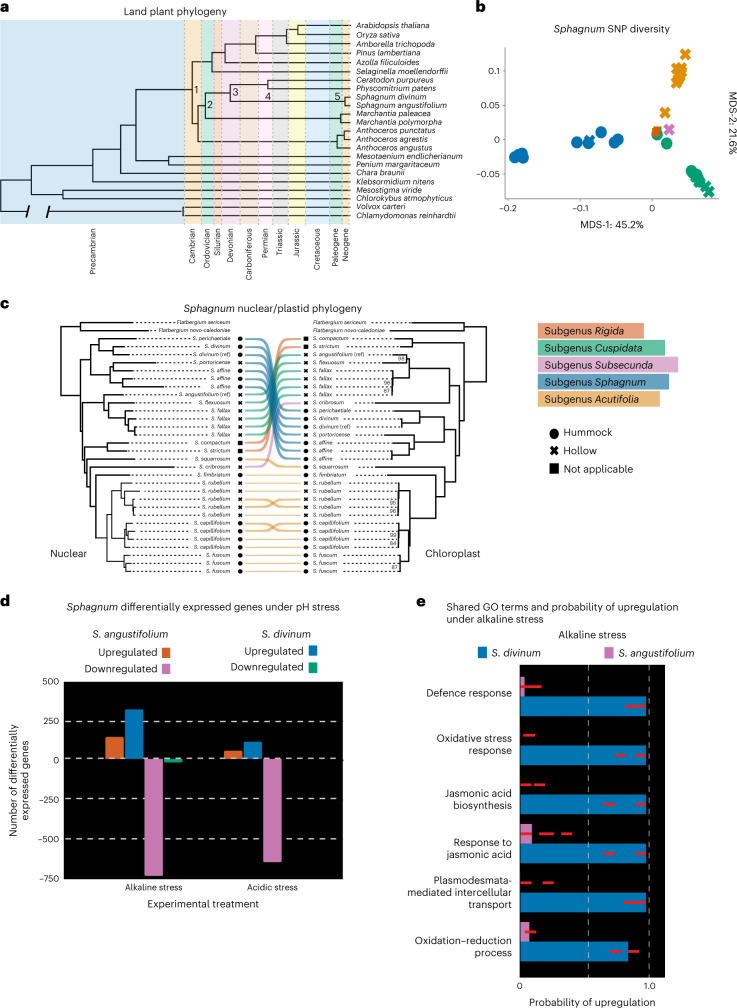
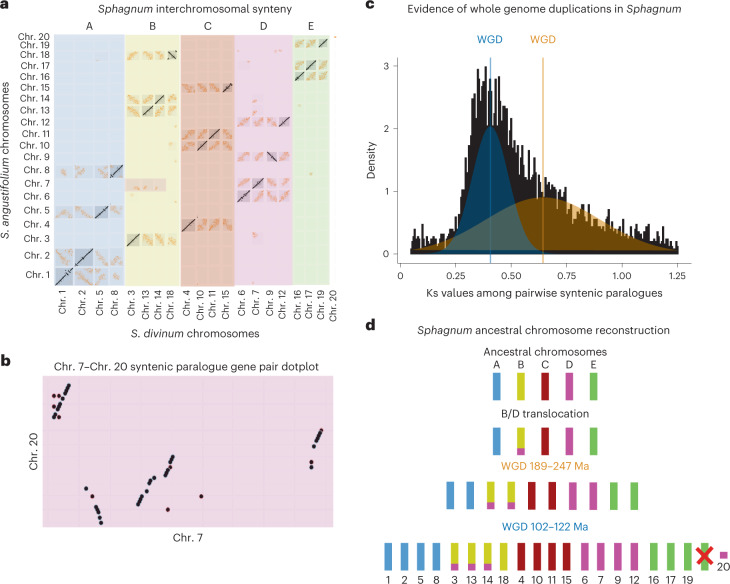
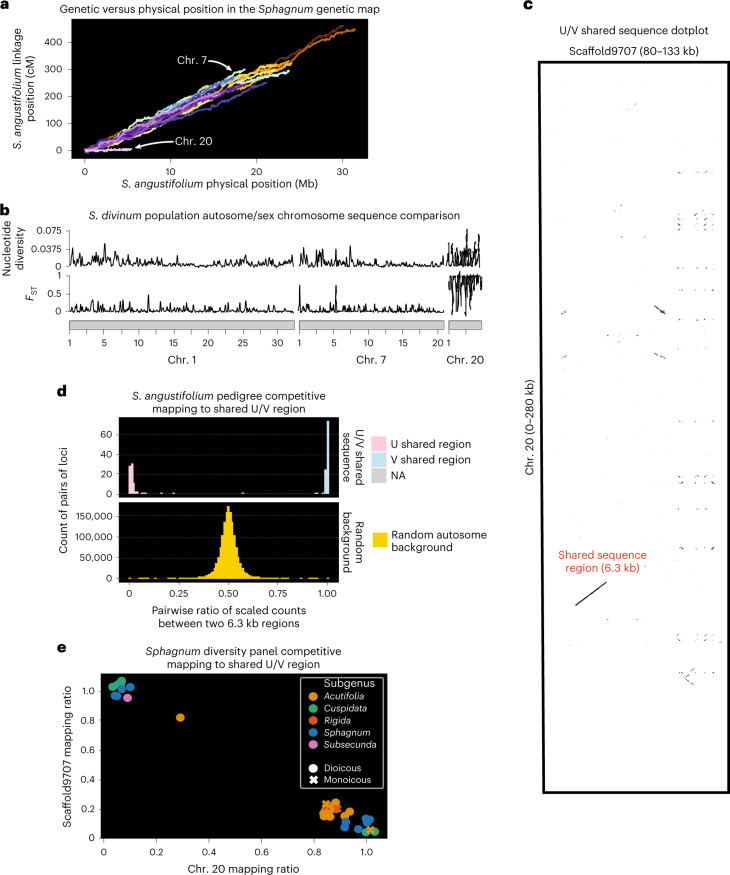
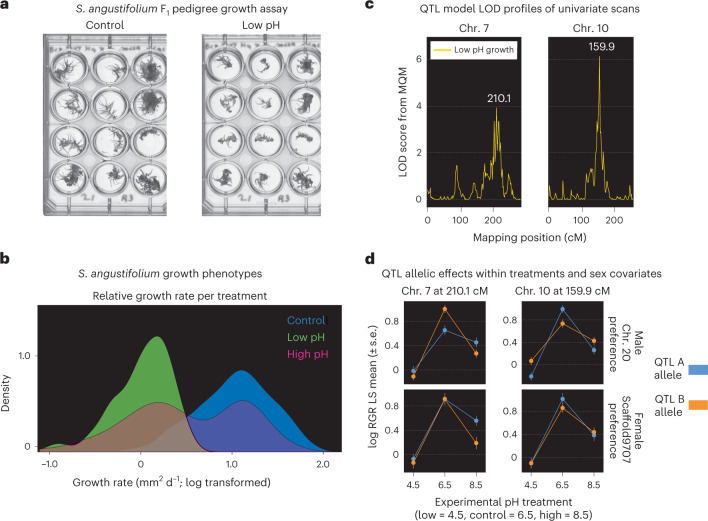
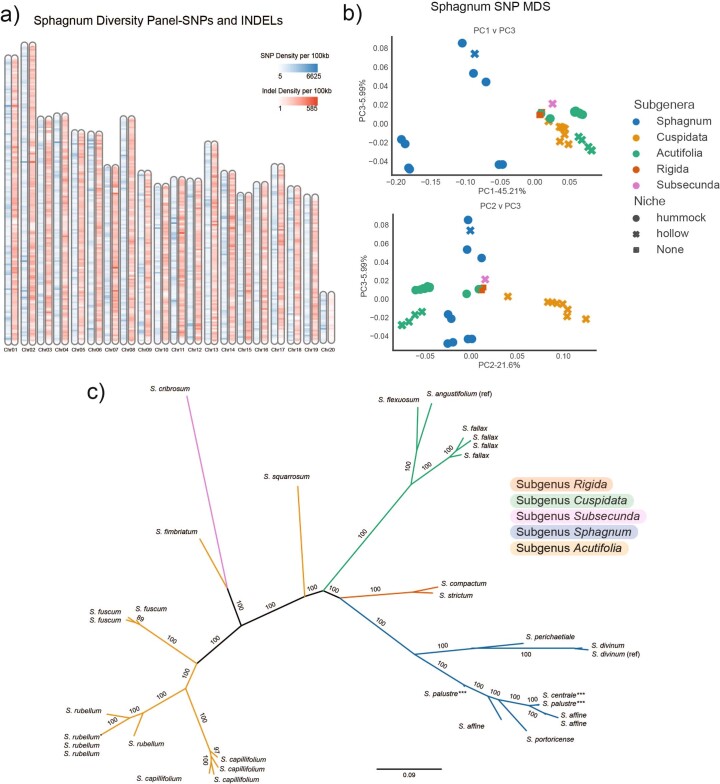
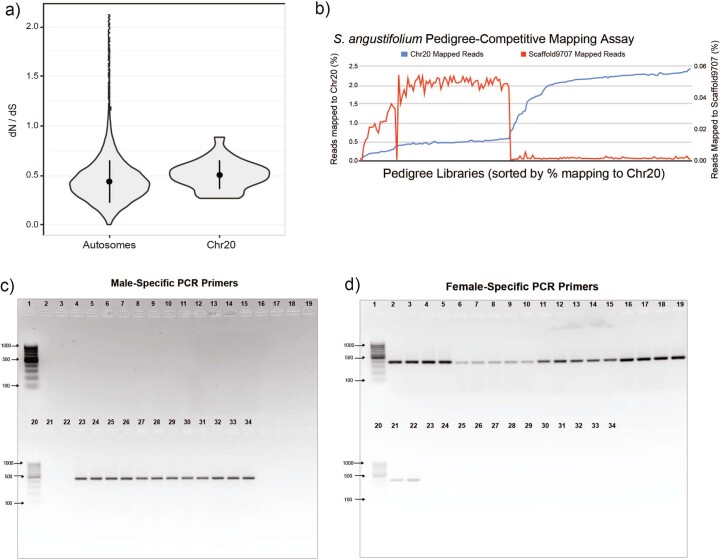
Peatlands are crucial sinks for atmospheric carbon but are critically threatened due to warming climates. Sphagnum (peat moss) species are keystone members of peatland communities where they actively engineer hyperacidic conditions, which improves their competitive advantage and accelerates ecosystem-level carbon sequestration. To dissect the molecular and physiological sources of this unique biology, we generated chromosome-scale genomes of two Sphagnum species: S. divinum and S. angustifolium. Sphagnum genomes show no gene colinearity with any other reference genome to date, demonstrating that Sphagnum represents an unsampled lineage of land plant evolution. The genomes also revealed an average recombination rate an order of magnitude higher than vascular land plants and short putative U/V sex chromosomes. These newly described sex chromosomes interact with autosomal loci that significantly impact growth across diverse pH conditions. This discovery demonstrates that the ability of Sphagnum to sequester carbon in acidic peat bogs is mediated by interactions between sex, autosomes and environment.


Conflict of interest statement

The authors declare no competing interests.

Figures

Fig. 1
Fig. 1. Comparative genomics of Sphagnum.
a, Syntenic mapping between chromosomes, comparing gene density and repeat content. The orientation of chr. 9 (marked *) is reversed for visualization purposes. Chr. 7 and chr. 20 are duplicated with expanded axes to the right of the main plot to highlight the differences in repeat content. b, S. angustifolium recombination rate (calculated from the S. angustifolium genetic map) with putative centromere positions, denoted with red asterisks showing RLC5 cluster positions. Lines are coloured on the basis of y axis position to better highlight regions of low recombination (yellow) c, Zoomed in look at the RLC5 cluster region on chr. 7. Top panel shows recombination rate from the S. angustifolium genetic map (coloured by position on y axis), showing a drop in recombination coinciding with the RLC5 cluster. Bottom panel shows the recombination haplotypes (maroon and blue) within the F1-haploid pedigree (n = 184; denoted on the y axis), finding no recombined haplotypes in the region overlapping with the RLC5 cluster. d, Recombination/LOD score heatmap for chr. 7 to show high recombination rate in pedigree and tight linkage among markers. Source data
Fig. 2
Fig. 2. Sphagnum phylogenetics and response to pH stress.
a, Fossil calibrated land plant phylogeny, with the branch separating the chlorophyte algae Chlamydomonas and Volvox from other species shortened for clarity and showing only terminal tips representative of major vascular plant lineages. Node ages (Ma) of note include: (1) Bryophyte divergence (515 Ma), (2) liverwort–moss divergence (473 Ma), (3) Sphagnopsida divergence (391 Ma), (4) P. patensC. purpureus divergence (268 Ma) and (5) Sphagnum radiation (16 Ma). b, Sphagnum diversity panel SNP MDS plot. Species are coloured by subgenera and niche ecosystem preference (closed circle, hummock; cross, hollow). c, Phylogenetic relationships among haploid samples in the diversity panel using nuclear and chloroplast data suggest cytonuclear discordance. Branch support reflects ultrafast bootstrap values and nodes not labelled received maximal support. d, The pH stress response among S. angustifolium and S. divinum. e, Sign test among shared GO terms under alkaline stress. Results show that genes with shared terms are upregulated in S. divinum and downregulated in S. angustifolium. Red dashed lines represent the 95% confidence intervals. Source data
Fig. 3
Fig. 3. WGDs and ancestral chromosome reconstruction in Sphagnum.
a, Interchromosomal synteny between S. divinum and S. angustifolium. S. divinum chromosomes are re-ordered to group paralogous chromosomes together while S. angustifolium chromosomes are arranged in increasing order (1–20). Ancestral B–D synteny on chr. 3, 13 and 14 is highlighted. b, Synonymous mutation rate among paralogous gene pairs in S. divinum. Two distributions derived from WGD are shown with the median of each peak (0.406; 0.643) marked with a coloured vertical line. c, Paralogous gene pairs among chr. 7 and chr. 20. Chr. 20 shares best-hit synteny with chr. 7. d, Ancestral chromosome reconstruction in Sphagnum. Little interchromosomal rearrangement has occurred after each WGD, except for the loss of one of the ancestral E chromosome homologues (noted with a red X). Genome duplication ages from ref. . Source data
Fig. 4
Fig. 4. U/V chromosome detection and analysis.
a, Recombination rate per chromosome, finding chr. 20 has a much lower rate of recombination than expected from the other 19 chromosomes. b, Sliding window analyses (100,000 bp window, 10,000 bp jump) of nucleotide diversity and FST between S. divinum chr. 20 SNP clusters. c, Exact k-mer dotplot with word size 15 for the shared sequence region between chr. 20 (putative V) and Scaffold9707 (putative U fragment), assembled from suspected female genotypes. d, S. angustifolium competitive mapping assay between chr. 20 and Scaffold9707. Ratio of reads mapped to the shared U/V region are shown, with individuals mapping to one sequence or the other (NA-ambiguous mapping ratio). Null distribution of autosome pairwise ratios is shown in yellow. e, Sphagnum diversity panel competitive mapping assay. Regardless of subgenera, individuals either mapped preferentially to the shared region of chr. 20 or Scaffold9707. Monoicous species (S. squarrosum, S. compactum, S. strictum and S. fimbriatum) each preferentially mapped to chr. 20. Positions on plot have been randomly ‘jittered’ by 0.1 units to improve readability among points. Source data
Fig. 5
Fig. 5. S. angustifolium pedigree QTL mapping in response to pH stress.
a, Growth of pedigree genotypes under control and acidic stress conditions. b, Relative growth rates for the S. angustifolium pedigree under control, high (pH 8.5) and low (pH 4.5) pH conditions (n = 150). c, QTL mapping of low pH growth differences. Two QTL peaks were detected on chr. 7 and chr. 10. LOD scores, conditional on other QTL in a multiple QTL model, are presented. d, QTL effect plots. The connected line plots (shown with error bars) show the differences in growth for the variant alleles underlying each QTL loci. Each QTL is dependent on sex and autosomal parental allele (blue, A allele; orange, B allele). Panels are ordered by low (pH 4.5), control (pH 6.5) and high (pH 8.5) conditions, with data presented as mean values ± s.e. MQM, multiple QTL mapping; RGR LS, relative growth rate least squares. Source data
Extended Data Fig. 1
Extended Data Fig. 1. Sphagnum diversity panel genomic variation.
a) Sphagnum diversity panel chromosome variation. SNPs and INDELS are relative to the S. angustifolium reference genome. The minor allele frequency (MAF) < 0.05 and sites with > 20% missing data were excluded. Any variant within 25 basepairs of a repeat element was excluded. Figure shows variant counts within non-overlapping 100 Kb windows. b) Multidimensional scaling (MDS) plots for Sphagnum SNP variation, relative to the S. angustifolium reference genome. Principal coordinates (PCs) were calculated after subsetting SNPs based on linkage disequilibrium (LD-see methods for description). Each point are colored by subgenera and shaped by environmental niche preference. c) Unrooted maximum likelihood SNP phylogeny for the Sphagnum diversity panel. Branch color represents the subgenus, branch support values represent the ultrafast bootstrap values, and branch lengths represent the number of substitutions per site. Polyploid species are labeled with asterisks (***). Source data
Extended Data Fig. 2
Extended Data Fig. 2. Sphagnum phylogenetics and introgression.
a) Plot of f-branch statistics (fb) showing excess allele sharing between branches of the Sphagnum phylogeny (y-axis) and extant species of Sphagnum (x-axis). Dotted lines on the y-axis represent the most recent common ancestor for branches underneath each line. The maximum likelihood tree generated from 16,171 orthologs was used to calculate the f-branch statistic. Matrix entries colored by f-branch values are significantly different (P<0.05) than zero. Tests that are inconsistent with the given tree topology are shaded in grey. b) Dmin statistics for trios of haploid Sphagnum species (same subgenus, different subgenera, all species) estimated from SNP data. Histograms represent the proportion of trios for which Dmin is significantly different from zero (P<0.05; <0.01; <0.001) based on shading (lightest to darkest, respectively). Dots represent Dmin values for significant trios. c) Phylogenetic relationships of Sphagnum resequencing samples (sample ID appended to species name) estimated from maximum likelihood ortholog genealogies using ASTRAL. Branch support values reflect local posterior probability and branch lengths are in coalescent units. Source data
Extended Data Fig. 3
Extended Data Fig. 3. Analysis of Chr20 as a sex chromosome.
a) Violin plot depicting gene-wide rate ratios of non-synonymous (dN) to synonymous (dS) substitution for genes on autosomes (n = 1,425) and chr.20 (n = 30) across the Sphagnum diversity panel. Higher values of dN/dS in genes on chr.20 suggest relaxation in the strength of purifying selection, positive selection, or a combination of both positive and relaxed purifying selection as compared to autosomal genes. Dots and bars represent mean values ± one standard deviation, respectively. b) S. angustifolium pedigree competitive mapping assay. Reads from each pedigree library were mapped to the genome assembly of S.angustifolium, along with the scaffold sequence Scaffold9707. Reads mapped to chr. 20 and Scaffold9707 are expressed as the total percentage per reads within the fastq file. c and d) Polymerase chain reaction results of male-specific (panel c) and female specific (panel d) primers used for amplification with Sphagnum samples of known sex (metadata details provided in Supplementary Table 12), Expected amplicon size for the PCR reaction is 444 bp (panel c) and 394 bp (panel d). PCR amplicons were separated on a 2% agarose gel, run for 2 hours at 80 volts. GeneRuler DNA ladder was run in lanes 1 and 20. DNA from female Sphagnum samples were loaded into lanes 2–19;21–22 and DNA from males was loaded into lanes 23–34. Individual gel results were not replicated but were independently consistent (for example male samples were 100% positive for male specific primers (panel c) and 100% negative for female-specific primers (panel d). Source data

Comment in

References

    1. Yu, Z., Loisel, J., Brosseau, D. P., Beilman, D. W. & Hunt, S. J. Global peatland dynamics since the Last Glacial Maximum. Geophys. Res. Lett.37, L13402 (2010).
    1. van Breemen N. How Sphagnum bogs down other plants. Trends Ecol. Evol. 1995;10:270–275. doi: 10.1016/0169-5347(95)90007-1. - DOI - PubMed
    1. Johnson MG, et al. Evolution of niche preference in Sphagnum peat mosses. Evolution. 2015;69:90–103. doi: 10.1111/evo.12547. - DOI - PubMed
    1. Piatkowski, B. T. From Genes to Traits and Ecosystems: Evolutionary Ecology of Sphagnum (Peat Moss). PhD dissertation, Duke Univ. (2020).
    1. Rydin, H. & Jeglum, J. K. The Biology of Peatlands (Oxford Univ. Press, 2013).

Publication types