. 2023 Apr;19(4):518-528.
doi: 10.1038/s41589-022-01252-8. Epub 2023 Feb 6.

Programmable synthetic biomolecular condensates for cellular control

Affiliations

Programmable synthetic biomolecular condensates for cellular control

Yifan Dai et al. Nat Chem Biol. 2023 Apr.

Abstract

The formation of biomolecular condensates mediated by a coupling of associative and segregative phase transitions plays a critical role in controlling diverse cellular functions in nature. This has inspired the use of phase transitions to design synthetic systems. While design rules of phase transitions have been established for many synthetic intrinsically disordered proteins, most efforts have focused on investigating their phase behaviors in a test tube. Here, we present a rational engineering approach to program the formation and physical properties of synthetic condensates to achieve intended cellular functions. We demonstrate this approach through targeted plasmid sequestration and transcription regulation in bacteria and modulation of a protein circuit in mammalian cells. Our approach lays the foundation for engineering designer condensates for synthetic biology applications.


Conflict of interest statement

COMPETING INTERESTS STATEMENT

The authors declare no competing interesting for this work.

Figures

Extended Data Fig 1.
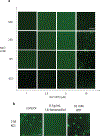
Extended Data Fig 1.. Evaluation of the effects of protein domain on condensate formation in cell.
a, Confocal fluorescence images of cells containing dParB DNA binding domain (DBD) (126–254)-mEGFP fusion and dParB DNA binding domain and dimerization domain (DBD-DD) (126–304)-mEGFP fusion. Neither of the constructs were able to show distinct puncta in cell. n=3 independent biological repeats with similar results. Scale bar is 10 μm. b, Confocal differential interference channel (DIC) images for the evaluations of condensate formation in cells containing constructs expressing RLPWT, RLPWT-DBD, RLPWT-DBD-DD after 1 h of induction. n=3 independent biological repeats with similar results. c, Estimation of intracellular protein concentrations by purified mEGFP protein. To establish a calibration curve, different concentrations of purified mEGFP protein were titrated into the cellular sample as shown in the top left panel to obtain an accurate calibration at the imaging Z coordinate. Because of the significant difference between the dense phase and the dilute phase, to prevent oversaturation of fluorescence signal while capable of obtaining accurate fluorescence intensity measurement, the energy of the WLL laser, the percentage of the intensity of the excitation laser, the detector range and pin hole size were tuned to cover the fluorescence signal of the dense and the dilute phase. If the dense phase signal is oversaturated or the dilute phase signal is similar to the non-fluorescence background sample, then the tuning process would start again until the range is covered. The background fluorescence intensity per pixel was analyzed by LAS X built-in module. The fluorescence intensity corresponding to different concentrations of purified mEGFP was utilized to construct the calibration curve (top right panel), which is utilized to estimate the intracellular protein concentration. The estimated intracellular dilute and dense phase concentration are shown in the bottom panel. Scale bar is 2.5 μm. n = 4 biologically independent samples. Error bar represents standard deviation.
Extended Data Fig 2.
Extended Data Fig 2.. Phase separation assay investigations of resilin-like polypeptide in response to various biochemical conditions.
a, Salt-dependent and concentration-dependent formation of condensate based on different concentrations of RLPWT ([GRGDSPYS]20) (with 10% RLPWT-sfGFP) in 50 mM Tris with different concentrations of NaCl at pH 7.2, confirming its salt-sensitivity and the contribution of electrostatic interaction in condensate formation. Scale bar is 10 μm. n=3 independent biological repeats with similar results. b, Evaluation of responsive phase behavior using 5 μM of RLPWT ([GRGDSPYS]20) (with 10% RLPWT-sfGFP) in 50 mM Tris and 2M KCl at pH 7.2. Reentrant condensate formation at high-salt condition using 2M KCl, indicating the contribution of hydrophobic residues to the condensate formation. Treating the condensate with hydrophobic molecule 1,6-hexanediol, which is known to disrupt non-ionic interactions in condensate74, dissolves the condensate. In the meantime, treating the condensate with adenosine triphosphate (ATP), which is known to disrupt electrostatic interaction in the condensate, shows no effect on condensate integrity. The above results confirmed the contributions of non-ionic residues to condensate stability. Overall, the biochemical tests demonstrated that synIDPs can also be modulated by various biochemical cues just as its native orthologs. Scale bar is 10 μm. n=3 independent biological repeats with similar results.
Extended Data Fig 3.
Extended Data Fig 3.. Characterization of rationally designed synIDPs based on modifications of the WT RLP sequence [GRGDSPYS]20 using sedimentation assay and fluorescent recovery after photobleaching.
a, Designs of synIDPs by repatterning the charge residues. Charged residues are segregated into individual repetitive motif as shown in the sequences GRGRSPYS/GDGDSPYS. b, c, Sedimentation assay evaluation of the dilute phase concentration(Cdilute) and the dense phase concentration (Cdense) of the designed synIDPs. The segregation of charged residues increases the phase separation propensity with lowered left binodal; in the meantime, no significant change of the dense phase concentration was observed. Above results suggested that enhanced electrostatic interaction by segregation of the oppositely charged residues in a zwitterionic IDP can promote phase separation propensity. d, Designs of synIDPs by varying the uniformity and the quantity of the aromatic residues,. For changing the uniformity of the aromatic residues, tyrosine (Y) residues are clustered into a single motif by exchanging with the spacer residue serine (S) as shown in the sequences GRGDSPSS/GRGDYPYS. For reducing the number of aromatic residues, 50% of tyrosine is substituted by valine (V). e, f, Evaluation of the dilute phase concentration (Cdilute) and the dense phase concentration (Cdense) of the designed IDPs by sedimentation assay. Cluster of aromatic residues enhances both phase separation propensity and the dense phase concentration. Decreasing the number of tyrosine residues decreases both phase separation propensity and the dense phase concentration. Above results demonstrated that pi-based interactions can modulate both phase separation propensity and dense phase property. n=3 different experiments. Mean ± SD.
Extended Data Fig 4.
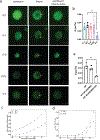
Extended Data Fig 4.. FRAP and computational analysis of condensates formed by synIDPs.
Proteins was prepared at 50 µM (in buffer containing 50 mM Tris, 125 mM NaCl, pH 7.2) to ensure all the samples have visible condensates. a, FRAP images and recovery curves of condensates formed by different types of synIDPs (doped with 10% of sfGFP labeled IDPs). Scale bar is 5 μm. b, Comparison of derived apparent diffusion coefficients of condensates formed by different artificial IDPs based on recovery curve fitted by single exponential fitting equation and the corresponding bleaching area75. c, Mean square displacement (MSD) values of chains in WT (black) or S-Y (blue) condensates. MSD values are in square lattice units per 2.5×10⁷ total system Monte Carlo moves. Standard errors from the mean across 5 independent simulations are smaller than the marker sizes. d, Evaluation of the likelihood for a chain to exit the condensates after 5×10⁹ Monte Carlo moves by comparing the amounts of chain still in the condensates with the amounts of chain moving out of the condensates. e, Comparison of derived apparent diffusion coefficients of condensates formed by different protein components. n = 3 independent experiments. Bar graph represents mean ± SD. *, p<0.025; **, p<0.006 by a two-tailed unpair t-test.
Extended Data Fig 5.
Extended Data Fig 5.. Evaluation of heterotypic driving force on the formation of DNA condensate and the partition of RNAP into the DNA condensate.
a, DNA condensate constituted by 500 nM of RLPWT-DBD-DD (doped with 10% RLPWT-DBD-DD -sfGFP) and 25 nM cy3-DNA containing one or two parS sites. Scale bar is 10 μm. b, Mixture of 500 nM of RLPWT-DBD (doped with 10% RLPWT-DBD-sfGFP) and 25 nM cy3-DNA containing no parS site did not result the formation of condensate. Scale bar is 10 μm. c, Fluorescence based sedimentation assay measurements of the dilute/dense phase concentrations of RLPWT-DBD (doped with 10% RLPWT-DBD-sfGFP) in the presence of 25 nM DNA with different number of parS binding sites. For measuring the dilute phase, the fluorescence was directly quantified from the supernatant after sedimentation (see Supplementary Methods). For measuring the dense phase, 1 µL of the dense phase was extracted and dissolved into 49 µL buffer before taking the measurements. n=6 independent experiments. *, p=0.0134; **, p=0.0012; **, p=0.0015 by a two-tailed unpair t-test. Error bar represents standard deviation. d, Normalized fluorescence recovery curve of DNA channel based on the DNA condensate formed by different components. For evaluation of the mobility of cy3-DNA, the protein component was not doped with sfGFP labeled protein. e, Normalized fluorescence recovery curve of Dextran (150 KDa) channel based on the DNA condensate formed in Fig 3g. n=3 independent experiments. Data point represents mean ± SD. f, Evaluation of partition coefficient of Alexa488-labeled T7 RNAP into different DNA condensates containing 1 µM of RLP-dParB and 25 nM of DNA containing one parS site. n=5 independent experiments. Bar graph represents mean ± SD. ****, p<0.0001; ***, p<0.0005 by a two-tailed unpair t-test
Extended Data Fig 6.
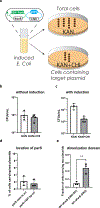
Extended Data Fig 6.. Evaluation of condensate mediated plasmid partition.
a, Experimental procedure to measure plasmid loss. b, c, Evaluation of change of total cell counts based on different testing conditions under the selection of kanamycin or kanamycin and chloramphenicol after 5 h of growth with/without induction. n=4 biologically independent samples. Bar graph represents mean ± SD. d, Comparison of change of fraction of cells carrying both plasmids based on the location of the parS site after 5 h of induction with 0.5 mM IPTG. n=3 biologically independent samples. Bar graph represents mean ± SD. e, Evaluation of the contribution of dimerization domain on modulating the fraction of cells carrying two plasmids after 90 min of induction with 0.5 mM IPTG. n=3 biologically independent samples. **, p=0.0079 by a two-tailed unpair t-test. Bar graph represents mean ± SD.
Extended Data Fig. 7.
Extended Data Fig. 7.. Modulation of cellular functions using synIDPs with different phase behaviors.
a, Computational simulation demonstrates the influences of the critical concentration of phase separation on plasmid partition efficiency. Enhancing plasmid partition follows the trend of decreasing critical concentration for phase separation. b, Effects of different synIDP-DBD-DD constructs on asymmetric plasmid partition at different time points after induction with IPTG induction level at 0.1 mM IPTG and 0.2 % arabinose by evaluating the fraction of progenitor cells (the amount of cells carries both plasmids). n=3 biologically independent samples. Bar graph represents mean ± SD. c, Experimental data fitted ODE models of different synIDP-DBD-DD constructs on asymmetric plasmid partition at different time points after induction with IPTG induction level at 0.1 mM IPTG and 0.2 % arabinose. n=3 biologically independent samples. d, Correlation between experimental evaluated biochemical property of IDP (concentration at dilute phase) and simulated β value (an artificial value indicating the effects of phase separation on asymmetric plasmid partition). Black line is the linear fit of the data with an R-square value of 0.846.
Extended Data Fig. 8.
Extended Data Fig. 8.. Evaluation of phase separation on modulating protein activity in mammalian cells.
a, Evaluation of cell viability with or without the transfection of plasmid containing RLPS-Y-Nzipper after 48 h of transfection. n=3 biologically independent samples. Bar graph represents mean ± SD. b, Time-dependent formation of synthetic condensates and recruitment of reporter protein. c, FRAP analysis of RLPS-Y-mCherry-Nzipper and Czipper-Citrine-DHFR within condensates in HEK293 cells. n=3 independent experiments. Data point represents mean ± SD. d, Dose-dependent modulation of protein activity. Cells was transfected with different amounts of plasmid containing RLPS-Y-mCherry-Nzipper and 0.5 µg of plasmid containing Czipper-Citrine-DHFR. Right panel shows representative confocal images after 48 h of transfection.
Fig. 1 |
Fig. 1 |. Engineering strategy for programmable functional synthetic condensates.
a, Condensate mediated DNA sequestration inhibits genetic materials (plasmid) from access of cellular machinery, inducing asymmetric plasmid partition. b, Condensate mediated concentration of transcriptional machinery and target gene for transcription amplification. c, A dynamically arrested and exclusionary condensate limits the exchange of molecules with the surrounding, thereby inhibiting a targeted functions in the cell. d, A labile and inclusive condensate recruits and enriches key components, thereby amplifying a targeted function in the cell. e, Design of modular protein components for the construction of synthetic condensate. The figure also summarizes characteristics of synthetic IDPs that affect different condensate properties. f, Establishing the phase diagram based on different synIDPs and combinations of functional domains. g, Evaluating functionally critical physical properties of synthetic condensates, including macromolecular permeability and diffusivity. h, Computationally modeling the effects of different types of synthetic condensates on regulating cellular functions.
Fig. 2 |
Fig. 2 |. Formation of synthetic condensate through phase separation in living cells and in vitro.
a, Confocal fluorescence images of intracellular condensate formation of RLPWT-mEGFP, RLPWT-DBD-mEGFP, RLPWT-DBD-DD-mEGFP as a function of induction time. Magnified view of cells at 90 min time point shows that different numbers and sizes of intracellular condensates were observed for different synIDP fusions. Scale bar is 10 µm. b, Quantification of the area fraction of the condensates in cell. Area fraction is calculated as following: Fractionofcondensatesincells=area ofallcondensatesareaofallcells. The area fraction grows with induction time. Data points represent mean± SD (n>121 cells for each time point). c, Confocal fluorescence images of purified proteins (doped with 10% of sfGFP- fused to the C-terminus of the protein) for in vitro visualization of their concentration-dependent phase separation. The samples were prepared in buffer containing 50 mM Tris, 150 mM NaCl, 10% PEG 8000, 1 mM EDTA, pH 7.2 and incubated at 37°C for 3 h before imaging. Scale bar is 10 µm. d, Quantification of Cdilute of each construct using sedimentation assay. The protein samples were prepared at a total concentration of 30 μM and incubated as for the phase separation assay and quantified after centrifugation by analyzing the supernatant. e, Quantification of Cdense of each construct using sedimentation assay. The protein samples were prepared at a total concentration of 30 μM and incubated as for the phase separation assay and quantified after centrifugation by removing and redissovling the dense phase pellet.
Fig. 3 |
Fig. 3 |. Evaluations of the molecular dynamics and permeability of synthetic DNA condensates.
a, Condensates formed by 500 nM WT-dParB (DBD) (doped with 10% WT-DBD-sfGFP) with 10 nM DNA (cy3-labeled) containing 1 parS site. Scale bar is 10 µm. WT-DBD is labeled green (left panel). DNA is labeled red (middle panel). b, Super-resolution images showing deconvoluted 3D construction of a single DNA condensate. WT-DBD is labeled green (left panel). DNA is labeled red (middle panel). c, Condensates formed by 500 nM WT-DBD (doped with 10% RLPWT-DBD-sfGFP) with 10 nM Cy3-labeled DNA containing 2 parS site. Scale bar is 10 µm. d, Representative FRAP images and derived diffusion coefficients of 500 nM synIDP-DBD-DD in the DNA condensates (doped with 10% synIDP-DBD-DD-sfGFP). Scale bar is 5 µm. n = 3 independent experiments. **, p=0.0092 by two-tailed unpaired t-test. e, Permeability of the DNA condensates formed by RLPS-Y and RLPWT -DBD-DD-DNA to fluorescein labeled dextran 40 kDa. Both RLPS-Y and RLPWT mediated DNA condensate exclude 40 kDa dextran with a partition coefficient smaller than 1. Condensates are shown in the bright-field images in the middle. Scale bar is 10 µm. n = 6 independent experiments. f, Representative FRAP images and derived diffusion coefficients of 500 nM synIDP-DBD in the DNA condensates (doped with 10% synIDP-DBD-sfGFP). Scale bar is 5 µm. ns, non-significant, p=0.1173 by two-tailed unpaired t-test. n = 3 independent experiments. g, Permeability of the condensates formed by RLPWT and RLPR-D2-DBD with DNA to Antonia red labeled dextran 150 kDa. Both RLPWT and RLPRD2 mediated DNA condensates are permeable to 150 kDa dextran with a partition coefficient larger than 1. Condensates are shown in the green fluorescence channel in the middle. Scale bar is 10 µm. n = 6 independent experiments. h, Representative FRAP images and fraction of recovery of different condensates in living cells. Scale bar is 5 µm. n = 3 independent experiments. Bar graph represents mean± SD
Fig. 4 |
Fig. 4 |. Condensate mediated DNA sequestration to control gene flow.
a, Programmable plasmid segregation depends on the formation of a dynamically arrested condensate. Condensate formation enables asymmetric partitioning of the target plasmid, resulting in its loss in a daughter cell. b, Circuit design: The synIDP-DBD-DD is under the control of a lac promoter and in a plasmid with kanamycin resistance and a pBR322 ori. A target DNA containing a parS binding site is placed on a plasmid containing chloramphenicol resistance and a p15A ori. c, The percentage of cells carrying two plasmids measured by selective plating after 5 h of induction. n = 3 independent biological repeats. d, Sequential confocal fluorescence images of cells (before and after induction) containing the WT-DBD-DD and target gene marked by CFP. The left panel shows the mEGFP fluorescent signal from the segregation apparatus; the middle panel shows the CFP fluorescent signal from the target gene; the right panel shows DIC images of cells. Sequential lasers were set at 433 nm and 490 nm respectively for excitations. Detectors were set at 455–485 nm, 510–550 nm respectively for emissions. n=3 independent biological repeats with similar results. Scale bar is 7.5 μm. e, Condensates sequester the mobilizable plasmid to inhibit horizontal gene transfer in the population. Target plasmid containing oriT is transferable by F helper plasmid. The induction of DNA segregation apparatus (DSA) inhibits the conjugation mediated horizontal gene transfer. f, Comparison of conjugation efficiency based on target plasmid containing oriT or oriT and parS. n = 3 independent biological repeats. **, p=0.0059 by two-tailed unpaired t-test. Bar graph represents mean± SD.
Fig. 5 |
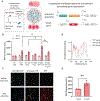
Fig. 5 |. Condensate mediated transcriptional amplification.
a, A dynamic condensate clusters key transcriptional machinery and plasmids, amplifying transcription because of the increased local concentrations of transcriptional activator and RNA polymerase in the condensate. Synthetic transcriptional machinery is constructed by synIDP-DBD directed condensate formation on parS sites and synIDP-SoxS (R93A) mediated recruitments of RNA polymerase to a weak promoter J23117. The synIDP-mediated condensate formation activates expression of the target gene. Expression of synIDP-dParB and synIDP-SoxS (R93A) is controlled by a T7 promoter. b, Comparison of RFP fluorescence signal based on the combinations of different components, DBD, synIDP, SoxS (R93A) after 2h of induction of the components of the transcription activation apparatus. n = 4 independent biological repeats. *, p<0.025 and **, p<0.009 by two-tailed unpaired t-test. c, Confocal fluorescence images of cells carrying activation apparatus (fused with fluorescent protein markers) and target gene. Sequential fluorescence images were acquired at distinct wavelengths for excitation laser and emission detector (433, 515, and 587 nm respectively for excitations, 440–475, 518–540, and 590–610 nm respectively for emission). Scale bar is 7.5 μm. n=3 independent biological repeats with similar results. d, Normalized fluorescence signal profile over distance across the cell. Fluorescence signal of each channel was converted into gray scale and profiled across the cell. e, Regulation of transcription performance through programming heterotypic interactions. Increasing the number of synthetic enhancer sites demonstrates significant increase of the RFP signal after 2 h of induction. n = 4 independent biological repeats. **, p<0.009 by two-tailed unpaired t-test. Bar graph represents mean± SD
Fig. 6 |
Fig. 6 |. Condensate mediated regulation of protein activity in mammalian cell.
a, A synIDP capable of mediating the formation of dynamically arrested condensate was implemented for targeted protein sequestration in mammalian cell. A synIDP-Nzipper fusion was implemented to recruit Citrine fused with Czipper and DHFR degron (Czipper-Citrine-DHFR) into the synthetic condensate. The DHFR degron is targeted by the cellular degradation machinery. b, Condensate formation excludes the degradation machinery from the target protein, thereby restoring citrine fluorescence signal. c, Flow cytometry analysis of Citrine fluorescence after 48 h of transfection. Cells were transfected with a plasmid encoding Czipper-Citrine-DHFR and a plasmid encoding RLPS-Y-Nzipper or Nzipper alone or RLPS-Y alone. Positive control was cells transfected with Czipper-Citrine-DHFR plasmid with addition of TMP. Negative control was cells transfected with only Czipper-Citrine-DHFR plasmid. n = 3 independent biological repeats. **, p=0.0024, ***, p<0.001 and ****, p<0.0001 by a two-tailed unpair t-test. Bar graph represents mean± SD. d, Super-resolution confocal fluorescence images of HEK293 cells carrying plasmids containing different constructs with Czipper-Citrine-DHFR plasmid. For Citrine detection, the excitation wavelength was set at 516 nm with a detector range at 520–565 nm and a stimulated emission depletion laser at 592 nm. For mCherry detection, the excitation wavelength was set at 588 nm with a detector range at 590–650 nm and a stimulated emission depletion lasers set at 660 nm. Scale bar is 5 μm. n=4 independent biological repeats with similar results.

Similar articles

Cited by

References

    1. Brangwynne CP et al. Germline P Granules Are Liquid Droplets That Localize by Controlled Dissolution/Condensation. Science 324, 1729–1732 (2009). - PubMed
    1. Molliex A et al. Phase Separation by Low Complexity Domains Promotes Stress Granule Assembly and Drives Pathological Fibrillization. Cell 163, 123–133 (2015). - PMC - PubMed
    1. Lyon AS, Peeples WB & Rosen MK A framework for understanding the functions of biomolecular condensates across scales. Nature Reviews Molecular Cell Biology 22, 215–235 (2021). - PMC - PubMed
    1. Tsang B, Pritišanac I, Scherer SW, Moses AM & Forman-Kay JD Phase Separation as a Missing Mechanism for Interpretation of Disease Mutations. Cell 183, 1742–1756 (2020). - PubMed
    1. Roden Christine A. et al. Double-stranded RNA drives SARS-CoV-2 nucleocapsid protein to undergo phase separation at specific temperatures. Nucleic Acids Research 50, 8168–8192 (2022). - PMC - PubMed

Publication types

Substances