. 2023 Mar;25(3):404-414.
doi: 10.1038/s41556-023-01091-2. Epub 2023 Feb 6.

Actin cytoskeleton vulnerability to disulfide stress mediates disulfidptosis

Affiliations

Actin cytoskeleton vulnerability to disulfide stress mediates disulfidptosis

Xiaoguang Liu et al. Nat Cell Biol. 2023 Mar.

Abstract

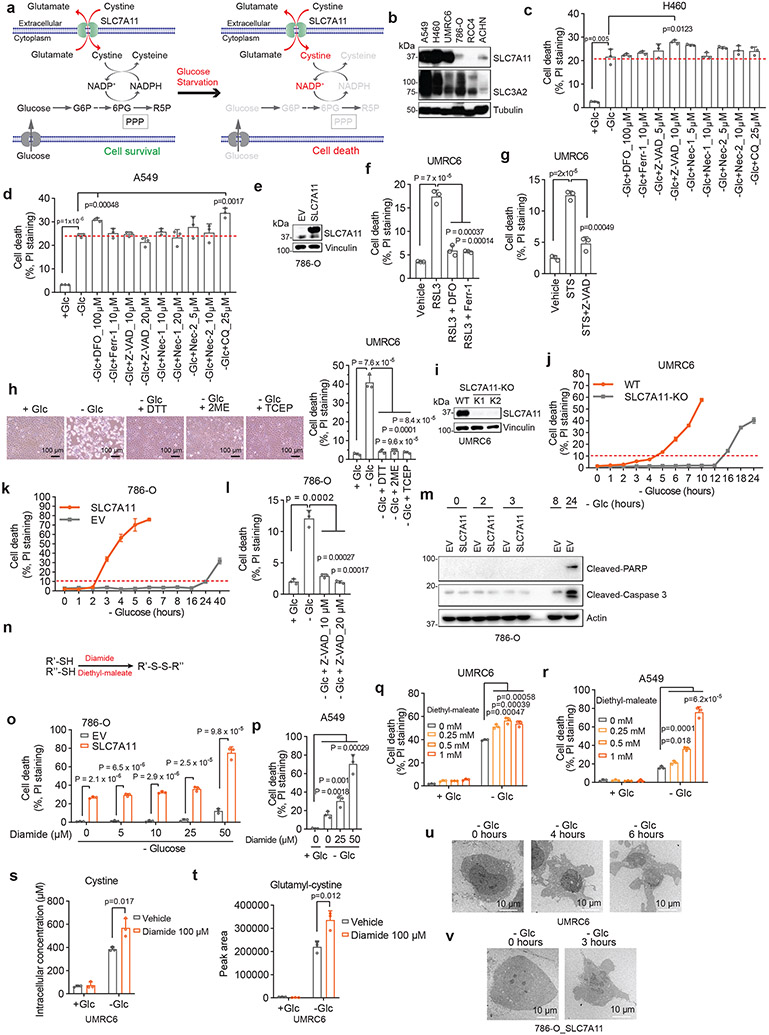
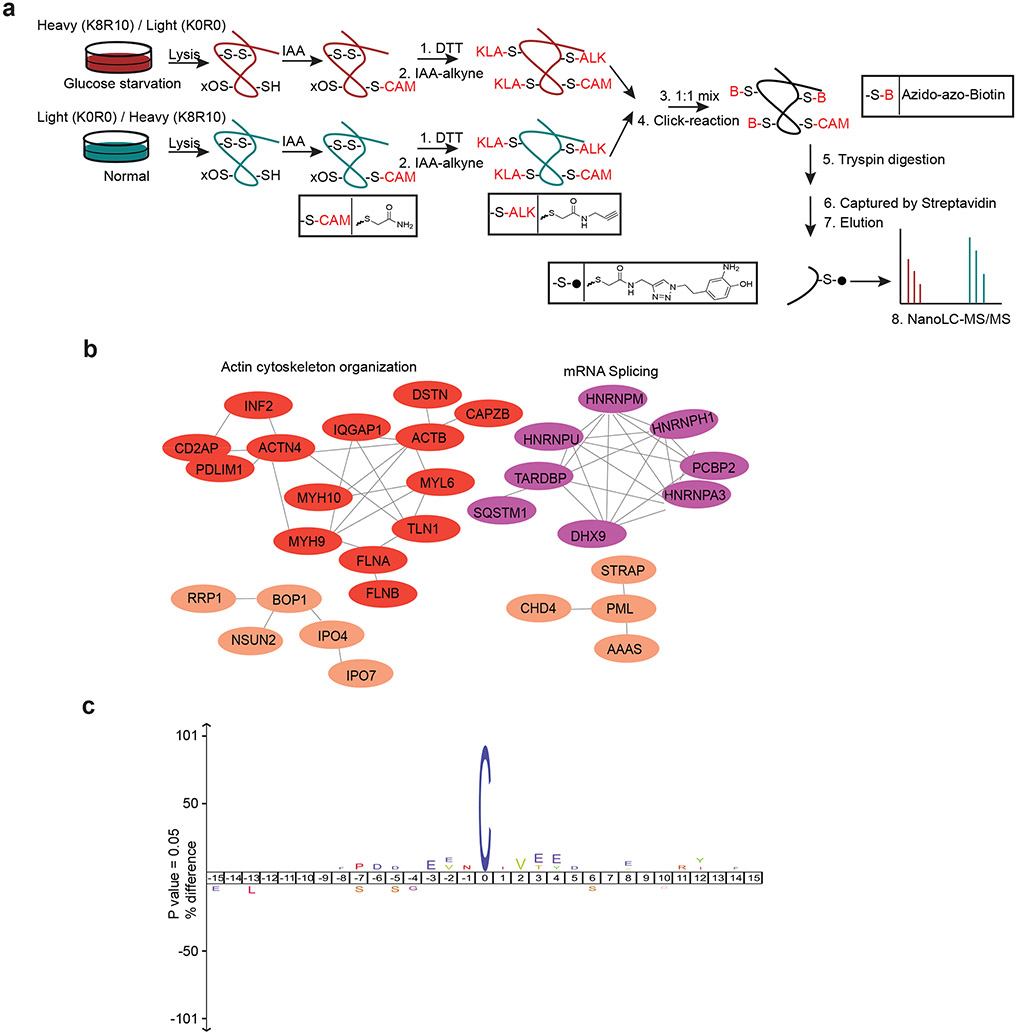
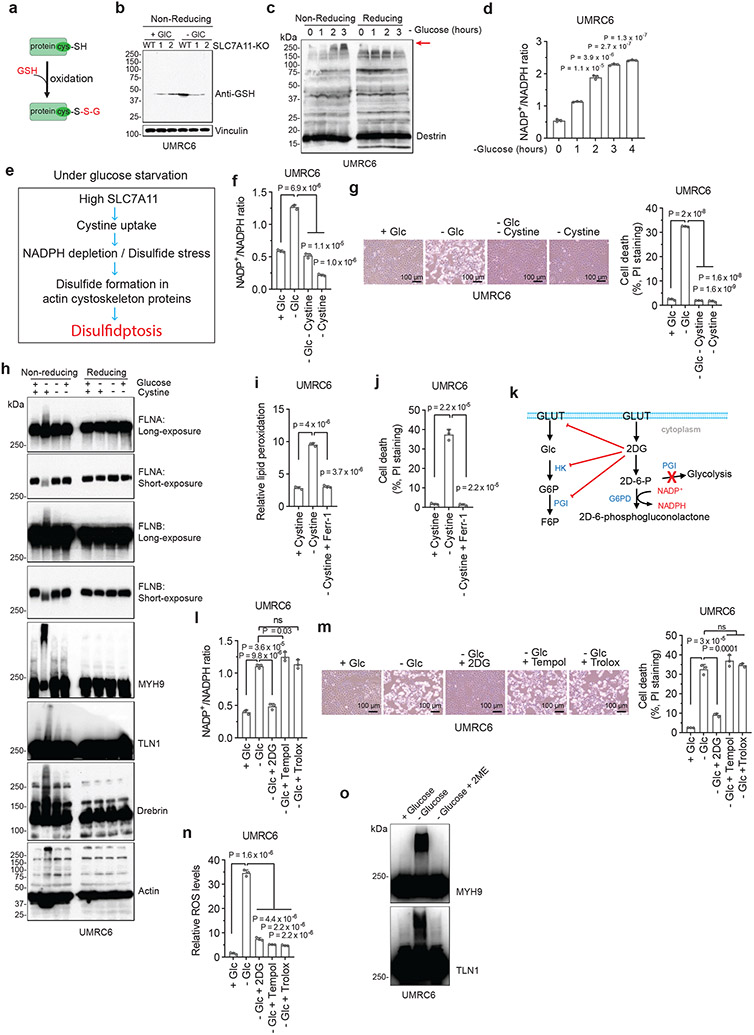
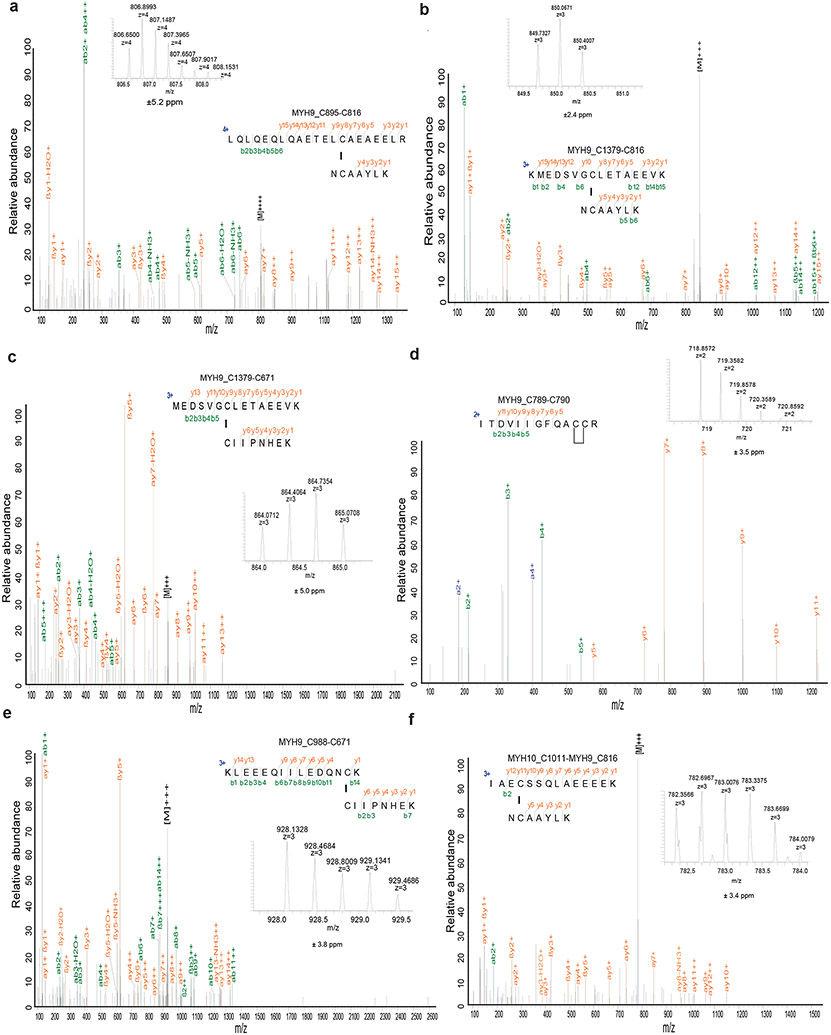
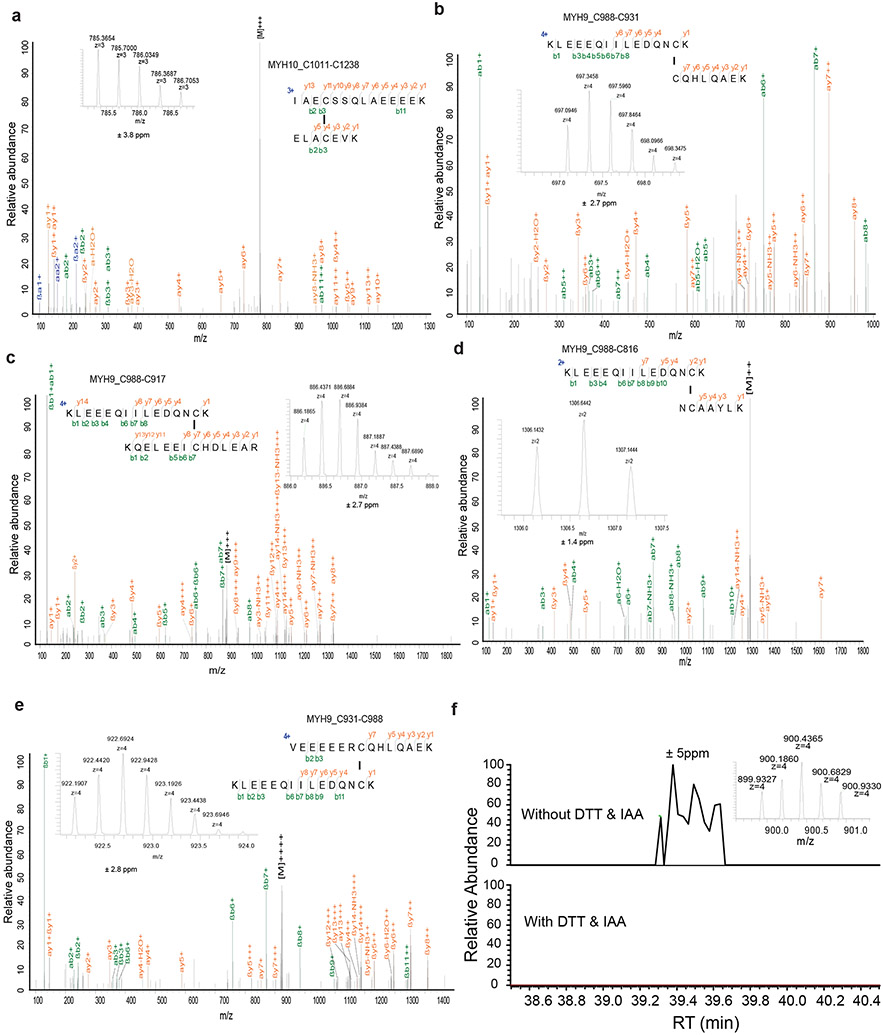
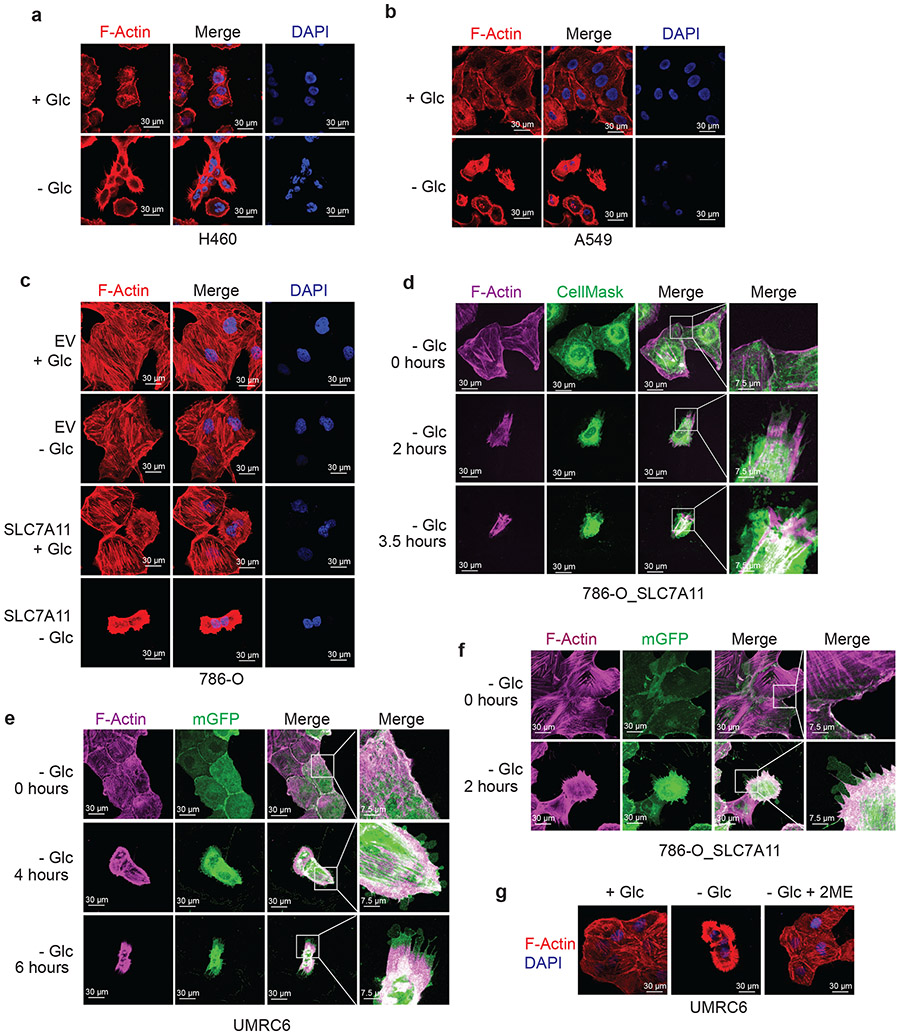
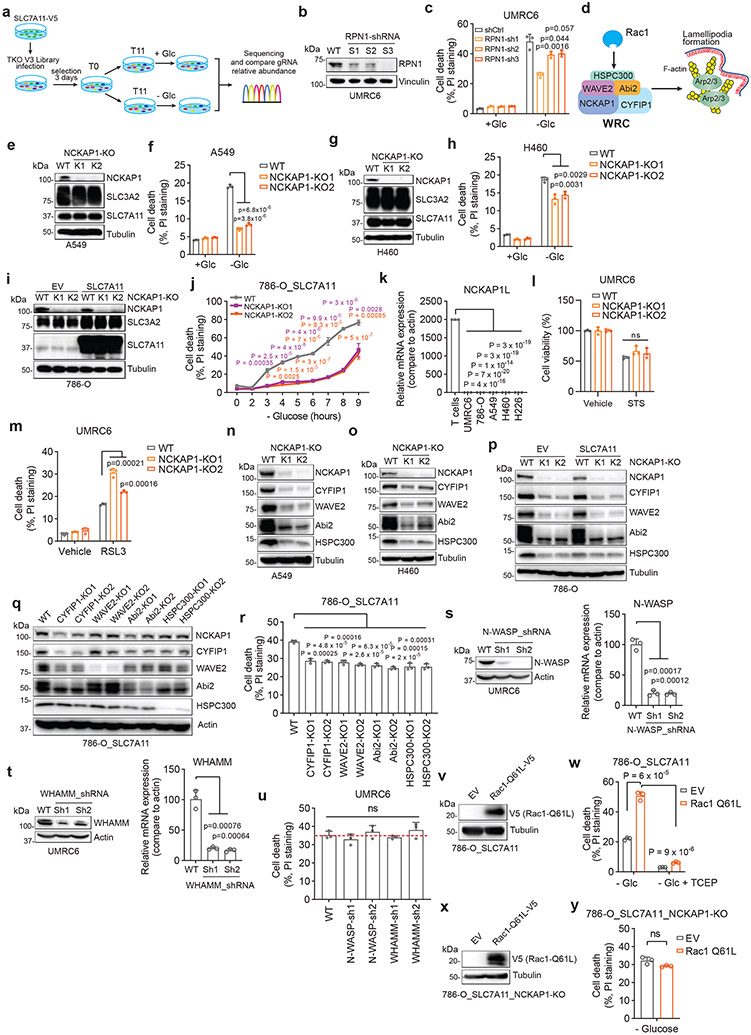
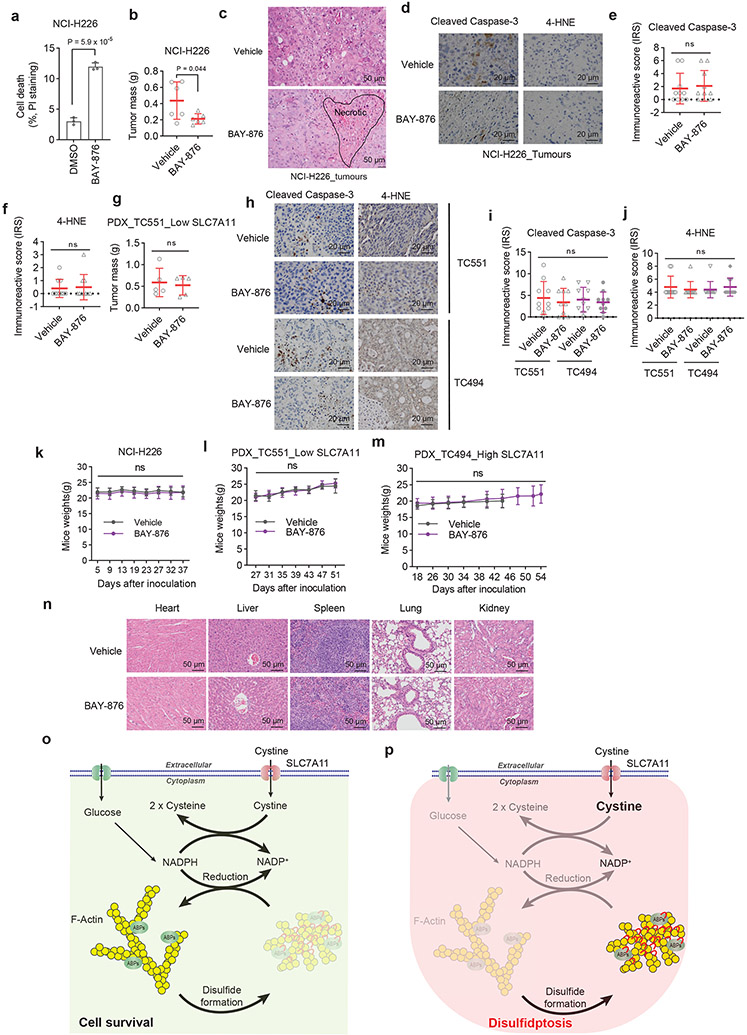
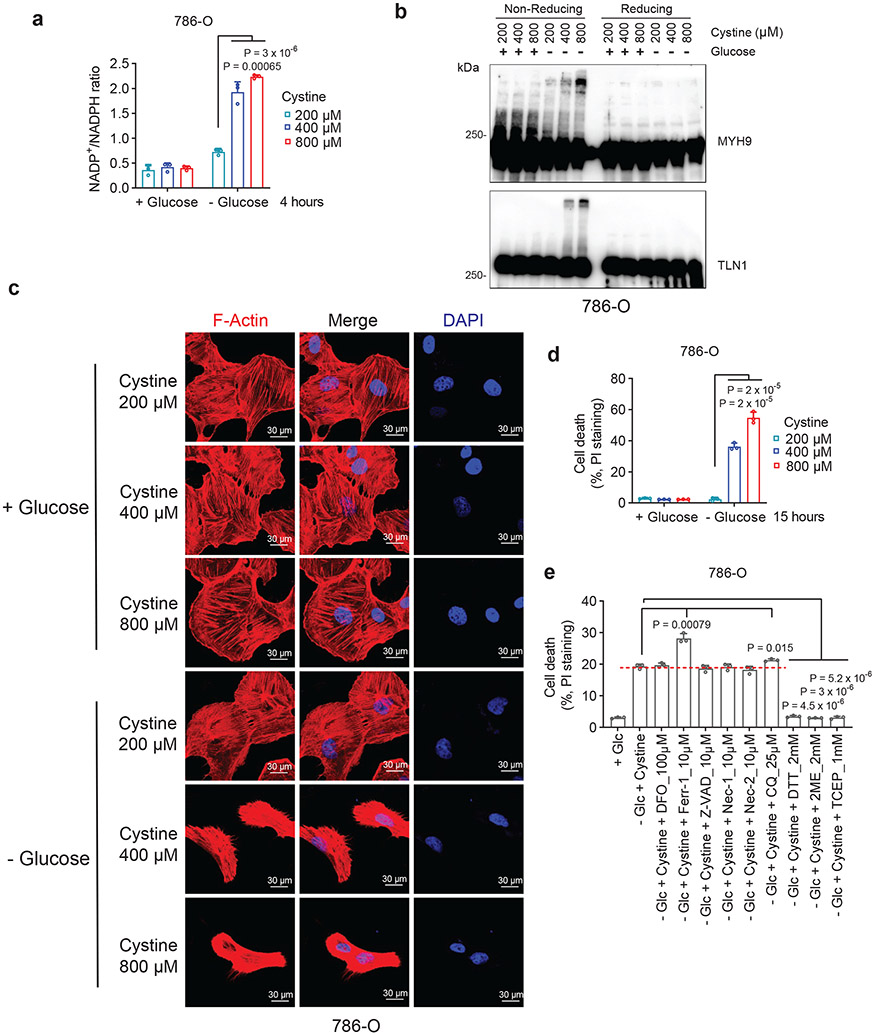
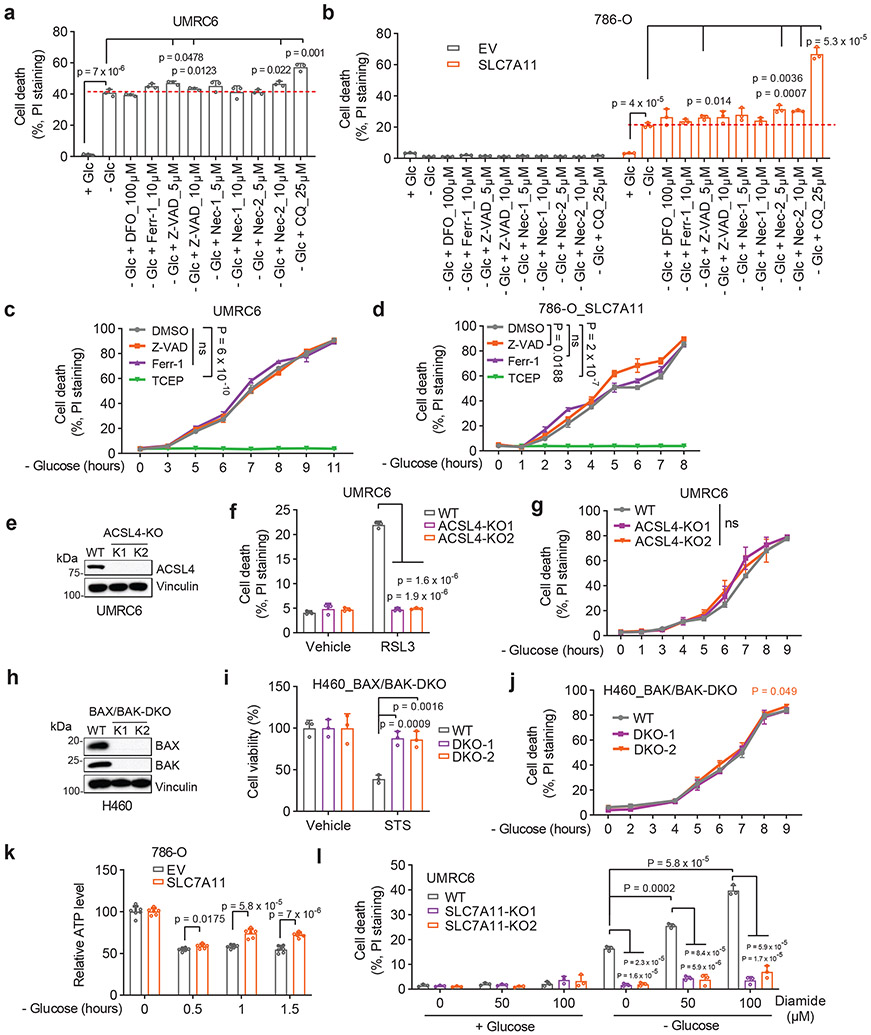
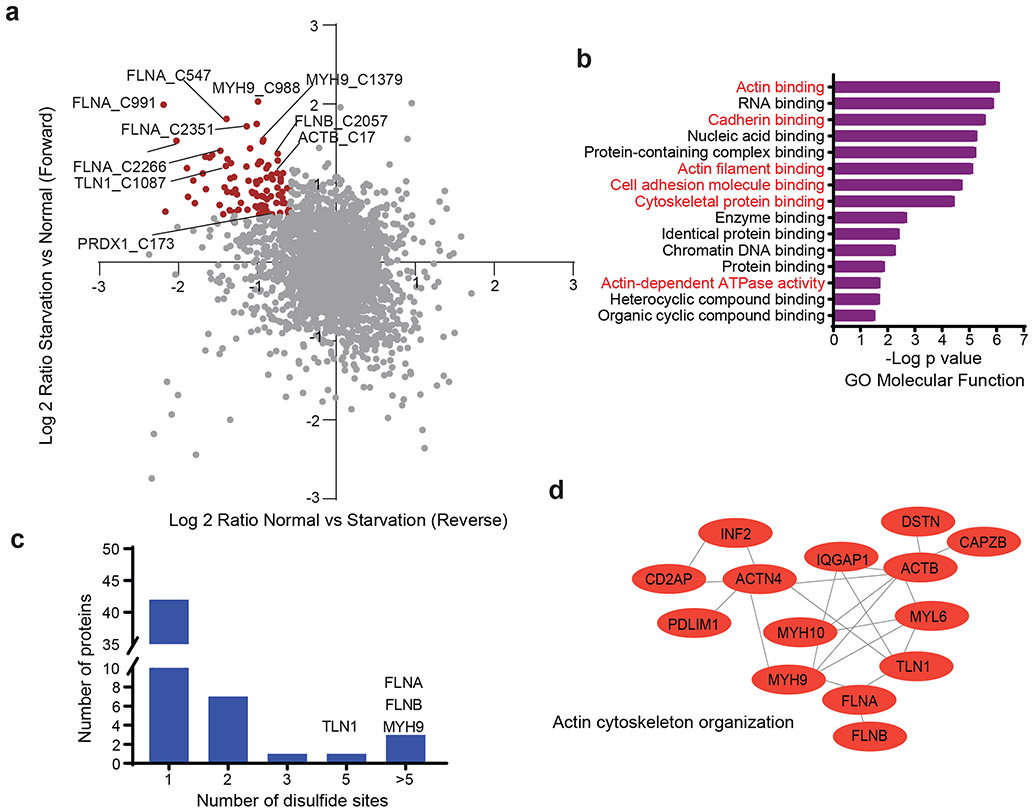
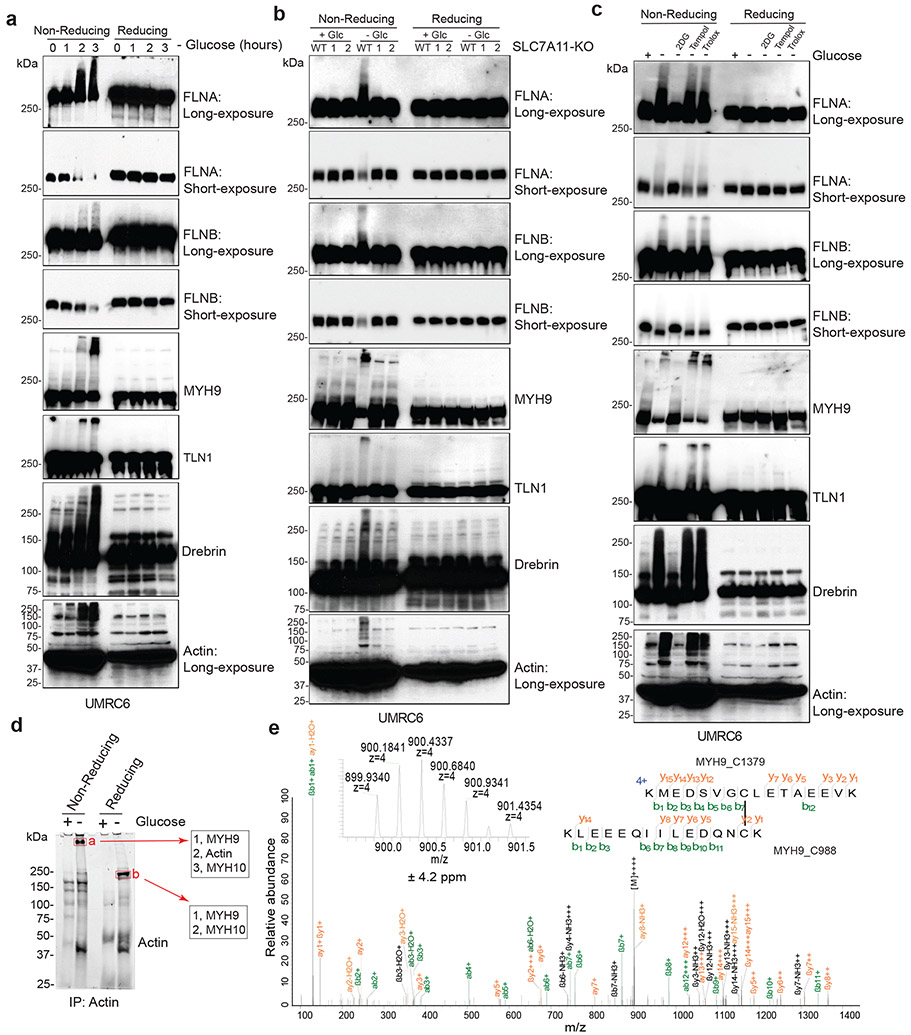
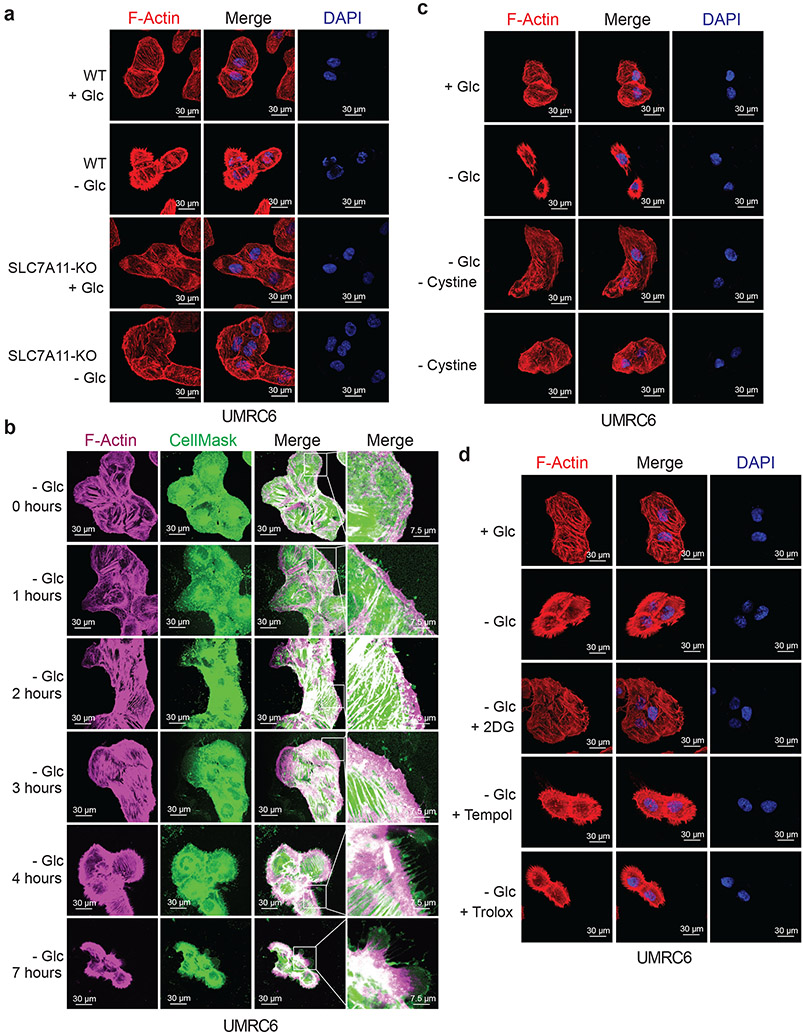
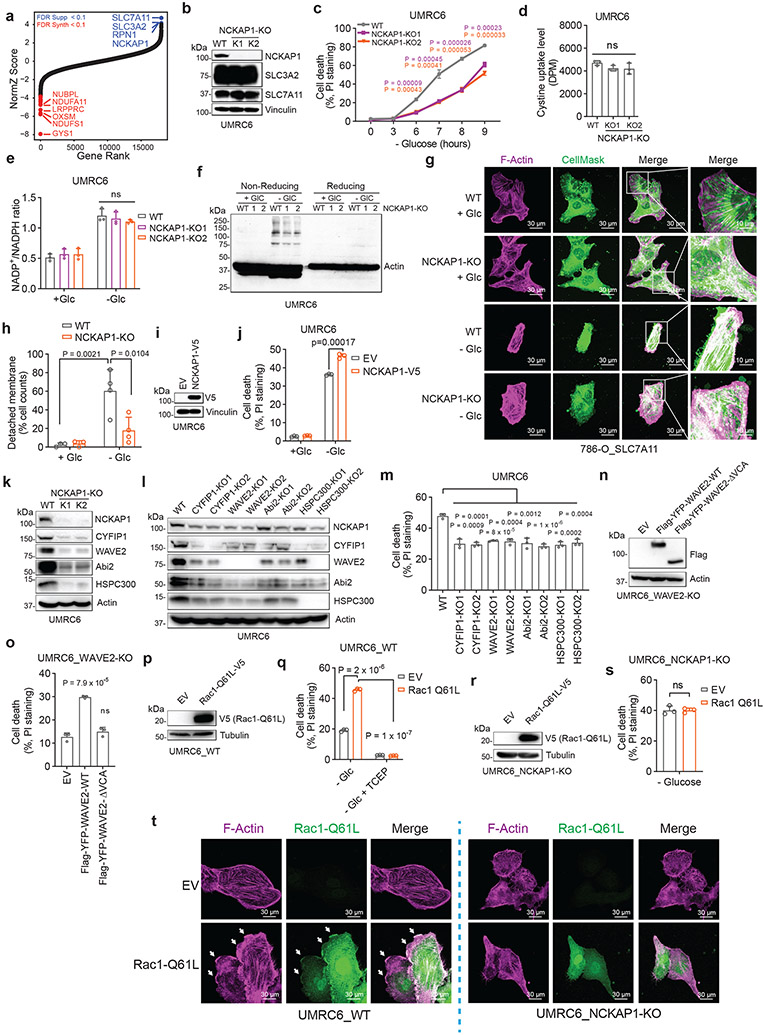
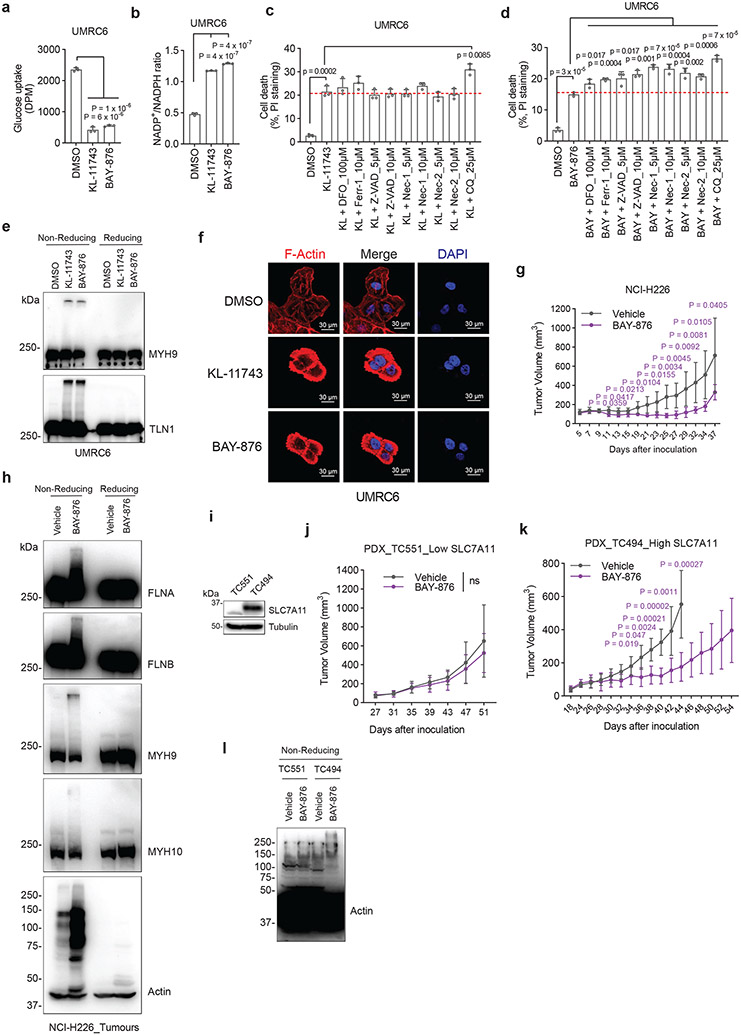
SLC7A11-mediated cystine uptake suppresses ferroptosis yet promotes cell death under glucose starvation; the nature of the latter cell death remains unknown. Here we show that aberrant accumulation of intracellular disulfides in SLC7A11high cells under glucose starvation induces a previously uncharacterized form of cell death distinct from apoptosis and ferroptosis. We term this cell death disulfidptosis. Chemical proteomics and cell biological analyses showed that glucose starvation in SLC7A11high cells induces aberrant disulfide bonds in actin cytoskeleton proteins and F-actin collapse in a SLC7A11-dependent manner. CRISPR screens and functional studies revealed that inactivation of the WAVE regulatory complex (which promotes actin polymerization and lamellipodia formation) suppresses disulfidptosis, whereas constitutive activation of Rac promotes disulfidptosis. We further show that glucose transporter inhibitors induce disulfidptosis in SLC7A11high cancer cells and suppress SLC7A11high tumour growth. Our results reveal that the susceptibility of the actin cytoskeleton to disulfide stress mediates disulfidptosis and suggest a therapeutic strategy to target disulfidptosis in cancer treatment.


Figures

Extended Data Figure 1.
Extended Data Figure 1.. A unique form of cell death in glucose-starved SLC7A11high cells.
a, Diagrams showing cystine metabolism and glucose-derived pentose phosphate pathway (PPP) metabolism. G6P: glucose-6-phosphate; 6PG: 6-phosphogluconate; R5P: ribose-5-phosphate; F6P: fructose-6-phosphate. b, SLC7A11 western blotting in different cell lines. c, d, Cell death in H460 cells (c) or A549 cells (d) cultured in glucose-containing (+ Glc) or glucose-free (− Glc) medium with or without indicated concentrations of DFO, Ferr-1, Z-VAD, Nec-1, Nec-2, CQ for 5 (c) or 15 hours (d). e, SLC7A11 western blotting in indicated 786-O cells. f, Cell death in UMRC6 cells treated with vehicle (DMSO) or with 0.1 μM RSL3 with or without 100 μM DFO or 10 μM Ferr-1 for 8 hours. g, Cell death in UMRC6 cells treated with vehicle (DMSO) or with 1 μM STS with or without 20 μM Z-VAD for 16 hours. h, Representative phase-contrast images and cell death measurement of UMRC6 cells cultured in indicated medium with or without 2mM DTT, 2mM 2ME or 1mM TCEP for 7 hours. i, SLC7A11 western blotting in the WT and SLC7A11-KO (K1/K2) UMRC6 cells. j, k, Cell death in indicated cell lines cultured in glucose-free medium for indicated times. l, Cell death in 786-O cells cultured in indicated medium with or without Z-VAD for 30 hours. m, Western blotting analysis of apoptosis markers in indicated 786-O cells in glucose-free medium for indicated times. n, Diagrams illustrating the mechanism of thiol-oxidizing agents diamide and diethyl-maleate. o, Cell death in indicated 786-O cells cultured in indicated medium for 3 hours. p, Cell death in A549 cells cultured in indicated medium for 15 hours. q, r, Cell death in UMRC6 cells (q) or A549 cells (r) cultured in indicated medium for 7 hours (q) or 15 hours (r). s, t, Intracellular cystine (s), and glutamyl-cystine (t) in UMRC6 cells cultured in indicated medium for 2 hours. u, v, Typical transmission electron microscopic images of UMRC6 (u) cells or 786-O cells overexpressing SLC7A11 (786-O_SLC7A11) (v) cultured in glucose-free medium for indicated times. All P values were calculated using two-tailed unpaired Student t-test. Data are mean ± s.d., n = 3 independent repeats. All Western blotting was repeated three times, independently, with similar results.
Extended Data Figure 2.
Extended Data Figure 2.. Proteomic analyses in glucose-starved SLC7A11high cells.
a, Approach to identify disulfide-containing peptides. -S-CAM is the cysteine blocked with iodoacetamide, -S-ALK is the cysteine blocked with iodoacetamide-alkyne, while -S-B is the product after click reaction between -S-ALK and azido-azo-biotin. b, Protein-protein interaction network of the proteins with disulfide bonds increased at least 1.5-fold upon glucose starvation from Figure 2a. The network was generated by the STRING database with medium confidence (0.7) and visualized by Cytoscape (v3.8.2). c, Flanking sequence analysis of the “disulfide” cysteine sites of the proteins with disulfide bonds increased at least 1.5-fold upon glucose starvation from Figure 2a.
Extended Data Figure 3.
Extended Data Figure 3.. Disulfide bonding in cytoskeleton proteins in disulfidptosis.
a, Diagrams illustrating the glutathionylation. b, Western blotting showing glutathionylation in indicated UMRC6 cells cultured in glucose-containing (+ Glc) or glucose-free (− Glc) medium for 3 hours. c, Western blotting showing destrin in UMRC6 cells cultured in glucose-free medium for 0 to 3 hours. Red arrow indicates the slow migrated band of Destrin proteins. d, NADP+/NADPH ratios of UMRC6 cells cultured in glucose-free medium for 0 to 4 hours. e, Workflow of SLC7A11high-mediated cystine uptake and disulfidptosis under glucose starvation. f, NADP+/NADPH ratios of UMRC6 cells cultured in indicated medium for 1 hour. g, Representative phase-contrast images and cell death of UMRC6 cells cultured in indicated medium for 7 hours. h, Western blotting analysis of UMRC6 cells cultured in indicated medium for 3 hours. i, j, The relative lipid peroxidation levels (i) and cell death (j) of UMRC6 cells cultured in indicated medium with or without ferroptosis inhibitor 10 μM Ferr-1 for 36 (i) or 48 (j) hours. k, Diagrams illustrating the metabolism of glucose and 2DG. HK: hexokinase; PGI: phosphoglucose isomerase; G6PD: glucose-6-phosphate dehydrogenase; 2D-6-P: 2-deoxyglucose-6-phosphate. l, NADP+/NADPH ratios of UMRC6 cells cultured in indicated medium with or without 2 mM 2DG, 25 μM Tempol, or 100 μM Trolox for 1 hour. m, Representative phase-contrast images and cell death of UMRC6 cells cultured in indicated medium with or without 2 mM 2DG, 25 μM Tempol, or 100 μM Trolox for 7 hours. n, Relative ROS levels of UMRC6 cells cultured in indicated medium with or without 2 mM 2DG, 25 μM Tempol, or 100 μM Trolox for 4 hours. o, Western blotting analysis of MYH9 and TLN1 in UMRC6 cells cultured in indicated medium with or without 1 mM 2ME treatment for 3 hours. All P values were calculated using two-tailed unpaired Student t-test. Data are mean ± s.d., n = 3 independent repeats. ns: not significant (P > 0.05). All Western blotting was repeated at least twice, independently, with similar results.
Extended Data Figure 4.
Extended Data Figure 4.. Annotated MS/MS spectra of disulfide-linked peptides.
Insets show the precursor ions mass with deviation.
Extended Data Figure 5.
Extended Data Figure 5.. Annotated MS/MS spectra of disulfide-linked peptides.
a-e, Insets show the precursor ions mass with deviation. f, Extracted ion chromatograms (XICs) for the precursor ion of the quadruply charged disulfide (MYH9_C988-C1379) peptides shown in Figure 3e in non-reduced (without DTT treatment) and reduced (with DTT treatment) samples. The MS/MS spectrum identified in these non-reduced samples was the same as shown in Figure 3e. The extracted ion chromatograms were set with ± 5 ppm deviation.
Extended Data Figure 6.
Extended Data Figure 6.. F-actin contraction during disulfidptosis.
a, b, Fluorescent staining of F-actin with phalloidin in H460 (a) or A549 (b) cells cultured in glucose-containing (+ Glc) or glucose-free (− Glc) medium for 4 (a) and 9 hours (b), respectively. Nuclei were stained by DAPI. c, Fluorescent staining of F-actin with phalloidin in 786-O cells overexpressing SLC7A11 and transfected with empty vector (EV) cultured in glucose-containing or glucose-free medium for 2 hours. Nuclei were stained by DAPI. d, Fluorescent staining of F-actin (red) and membrane (green) in the 786-O cells overexpressing SLC7A11 (786-O_SLC7A11) cultured in glucose-free medium for indicated times. e, f, Fluorescent staining of F-actin (red) in UMRC6 cells (e) or 786-O_SLC7A11 cells (f) overexpressing membrane-bound green fluorescent protein (mGFP) cultured in glucose-free medium for indicated times. g, Fluorescent staining of F-actin in UMRC6 cells cultured in glucose-containing or glucose-free medium with or without 1 mM 2ME for 4 hours. Nuclei were stained by DAPI. All experiments were repeated at least twice, independently, with similar results.
Extended Data Figure 7.
Extended Data Figure 7.. The WAVE regulatory complex and Rac regulate disulfidptosis.
a, Workflow of CRISPR/Cas9 screenings. b, RPN1 western blotting in indicated UMRC6 cells. c, Cell death in the WT and RPN1-knockdown (sh1-3) UMRC6 cells cultured in glucose-containing (+ Glc) or glucose-free (− Glc) medium for 8 hours. d, Schematic illustrating the Rac1-WRC-Arp2/3 signaling axis. e, g, i, Western blotting in the WT and NCKAP1-KO (K1/K2) A549 cells (e), H460 cells (g), and indicated 786-O cells (i). f, h, j, Cell death in the WT and NCKAP1-KO A549 cells (f), H460 cells (h), and 786-O cells overexpressing SLC7A11 (j) cultured in indicated medium for 15 hours (f), 5 hours (h) or indicated times (j), respectively. k, Relative NCKAP1L mRNA levels in indicated cells. l, Cell viability in indicated UMRC6 cells treated with vehicle or 1 μM STS for 16 hours. m, Cell death in indicated UMRC6 cells treated with vehicle or 1 μM RSL3 for 8 hours. n-q, Western blotting in the WT cells and KO counterparts with deficiency of indicated genes. r, Cell death in indicated 786-O cells overexpressing SLC7A11 cultured in glucose-free medium for 4 hours. s, t, Western blotting (left) and RT-PCR (right) analysis of indicated UMRC6 cells. u, Cell death in indicated UMRC6 cells cultured in glucose-free medium for 7 hours. v, x, Western blotting analysis in indicated cell lines. w, Cell death in indicated 786-O_SLC7A11 cells cultured in glucose-free medium with or without 1 mM TCEP for 3 hours. y, Cell death in indicated NCKAP1-KO 786-O_SLC7A11 cells cultured in glucose-free medium for 7 hours. All P values were calculated using two-tailed unpaired Student t-test. Data are mean ± s.d., n = 3 independent repeats. ns: not significant (P > 0.05). All Western blotting was repeated at least twice, independently, with similar results.
Extended Data Figure 8.
Extended Data Figure 8.. GLUT inhibitors induce disulfidptosis in SLC7A11high tumours.
a, Cell death measured by PI staining in NCI-H226 cells treated with vehicle DMSO and 5 μM BAY-876 for 6 hours. b, End-point weights of NCI-H226 xenograft with indicated treatments. Data are mean ± s.d., n = 6 mice. c, Hematoxylin and eosin staining of NCI-H226 tumours with indicated treatments. Tumour areas with necrotic cell death are indicated. d-f, Representative immunochemical images (d) from NCI-H226 tumours with indicated treatments and corresponding immunoreactive scores of cleaved caspase-3 (e) and 4-HNE (f). g, End-point tumor weights of TC551 xenografts with indicated treatments. Data are mean ± s.d., n = 5 mice. h-j, Representative immunochemical images (h) from TC551 and TC494 PDX models with indicated treatments and corresponding immunoreactive scores of cleaved caspase-3 (i) and 4-HNE (j). k-m, Mice weights of NCI-H226 (k), TC551 (l), or TC494 (m) xenografts with indicated treatments over time. Data are mean ± s.d., n = 6 (k), 5 (l), or 8 (m) mice. n, Representative hematoxylin and eosin staining of major organs from mice treated with vehicle or BAY-876. The experiment was repeated twice, independently, with similar results. o, p, The working model depicting how glucose and SLC7A11 coordinately regulate the disulfide homeostasis of the actin cytoskeleton. See Discussion for detailed description. ABPs: actin-binding proteins; small red arc: disulfide bond. All P values were calculated using two-tailed unpaired Student t-test. Data are mean ± s.d., n = 3 independent repeats unless specified. ns: not significant (P > 0.05).
Extended Data Figure 9.
Extended Data Figure 9.. The induction of disulfidptosis in SLC7A11low cells.
a, NADP+/NADPH ratios of 786-O cells cultured in glucose-containing or glucose-free medium with indicated concentrations of cystine for 4 hours. b, Non-reducing and reducing Western blotting analysis of MYH9 and TLN1 in 786-O cells cultured in glucose-containing or glucose-free medium with indicated concentrations of cystine for 7 hours. c, Fluorescent staining of F-actin in 786-O cells cultured in glucose-containing or glucose-free medium with indicated concentrations of cystine for 8 hours. Nuclei were stained by DAPI. d, Cell death measured by propidium iodide (PI) staining in 786-O cells cultured in glucose-containing or glucose-free medium with indicated concentrations of cystine for 15 hours. e, Cell death measured by PI staining in the 786-O cells cultured in glucose-containing or glucose-free medium containing 400 μM cystine with or without indicated concentrations of DFO, Ferr-1, Z-VAD, Nec-1, Nec-2, CQ, DTT, 2ME, TCEP for 15 hours (DTT, 2ME, and TCEP were replenished at 7-hour time point). All P values were calculated using two-tailed unpaired Student t-test. Data are mean ± s.d., n = 3 independent repeats. All Western blotting was repeated at least twice, independently, with similar results.
Extended Data Figure 10.
Extended Data Figure 10.. An example for the gating strategy of Flow Cytometry.
Initial cell population gating (FSC-Height VS SSC-Height) was adopted to make sure only single cells were used for analysis.
Figure 1.
Figure 1.. A unique form of cell death in glucose-starved SLC7A11high cells.
a, b, Cell death measurement in SLC7A11high UMRC6 cells (a) or 786-O cells overexpressing SLC7A11 and transfected with empty vector (EV) (b) cultured in glucose-containing (+ Glc) or glucose-free (− Glc) medium with or without indicated concentrations of deferoxamine (DFO), Ferr-1, Z-VAD, Nec-1, Nec-2, and CQ for 7 hours (UMRC6 cells) or 3 hours (786-O cells). c, d, Cell death measurement in UMRC6 cells (c) or 786-O cells overexpressing SLC7A11 (d) cultured in glucose-free medium with vehicle DMSO, 10 μM Z-VAD, 10 μM Ferr-1, and 1 mM TCEP for indicated times. e, Western blotting showing ACSL4 protein levels in wild-type (WT) control and ACSL4 knockout (KO) (K1, K2) UMRC6 cells. f, Cell death measurement in WT and ACSL4-KO UMRC6 cells treated with vehicle or 1 μM RSL3 for 8 hours. g, Cell death measurement in WT and ACSL4-KO UMRC6 cells cultured in glucose-free medium for indicated times. h, Western blotting showing BAX and BAK protein levels in WT and BAX/BAK double knockout (DKO) (K1/K2) H460 cells. i, Cell viability measurement in WT and BAX/BAK-DKO H460 cells treated with vehicle or 1 μM STS for 16 hours. j, Cell death measurement in WT and BAX/BAK-DKO H460 cells cultured in glucose-free medium for indicated times. k, Relative ATP levels of 786-O cells overexpressing SLC7A11 and transfected with empty vector (EV) cultured in glucose-free medium for indicated times. l, Cell death measurement in WT and SLC7A11-KO UMRC6 cells cultured in indicated medium for 6 hours. All P values were calculated using two-tailed unpaired Student t-test. Data are mean ± s.d., n = 3 independent repeats except (k) (6 independent repeats). ns: not significant (P > 0.05). All Western blotting was repeated at least twice, independently, with similar results.
Figure 2.
Figure 2.. Proteomic analyses in glucose-starved SLC7A11high cells.
a, Scatterplot of disulfide-containing peptides (dots) from forward and reverse experiments. Brown dots represent peptides upregulated at least 1.5-fold in glucose starvation samples compared to control samples in both forward and reverse experiments. The experiment was repeated 8 times, independently, with similar results identifying actin cytoskeleton proteins as top proteins. b, The result of Gene Ontology (GO) enrichment analysis from Gene Ontology Resource. The enriched molecular function pathway was ranked by −log false discovery rate. The actin cytoskeleton–related and cell adhesion–related processes/pathways are in red. c, Histogram showing the number of different disulfide-containing cysteine sites per protein with disulfide bonds increased at least 1.5-fold upon glucose starvation from (a). d, Protein-protein interaction network of actin-related proteins among the proteins with disulfide bonds increased at least 1.5-fold upon glucose starvation from (b). The network was generated by the STRING database with medium confidence (0.7) and visualized by Cytoscape (version 3.8.2).
Figure 3.
Figure 3.. Disulfide bonding in cytoskeleton proteins in disulfidptosis.
a, Non-reducing and reducing Western blotting analysis of indicated actin cytoskeleton proteins in UMRC6 cells cultured in glucose-free medium for 0 to 3 hours. b, Non-reducing and reducing Western blotting analysis of indicated actin cytoskeleton proteins in WT and SLC7A11-KO (1/2) UMRC6 cells cultured in glucose-containing or glucose-free medium for 3 hours. c, Non-reducing and reducing Western blotting analysis of indicated actin cytoskeleton proteins in UMRC6 cells cultured in glucose-containing or glucose-free medium with or without 2 mM 2DG, 25 μM Tempol, or 100 μM Trolox for 3 hours. d, Immunoprecipitation (Coomassie blue staining, left) and mass spectrometry analysis (right) of actin-associated proteins. The right shows the most abundant proteins from each band ranked by intensity-based absolute quantification (iBAQ). e, The annotated MS/MS spectrum of a quadruply charged disulfide (MYH9_C988-C1379) peptide. Insets show the precursor ion mass with deviation. All experiments were repeated at least twice, independently, with similar results.
Figure 4.
Figure 4.. F-actin contraction during disulfidptosis.
a, Fluorescent staining of F-actin with phalloidin in WT and SLC7A11-KO UMRC6 cells cultured in glucose-containing (+ Glc) or glucose-free (− Glc) medium for 4 hours. Nuclei were stained by DAPI. b, Fluorescent staining of F-actin (red) and membrane (green) in UMRC6 cells cultured in glucose-free medium for indicated times. c, Fluorescent staining of F-actin with phalloidin in UMRC6 cells cultured in glucose-containing, glucose-free, glucose- and cystine-free (− Glc - Cystine), or cystine-free (− Cystine) medium for 6 hours. Nuclei were stained by DAPI. d, Fluorescent staining of F-actin with phalloidin in UMRC6 cells cultured in glucose-containing or glucose-free medium with or without 2 mM 2DG, 25 μM Tempol, or 100 μM Trolox for 4 hours. Nuclei were stained by DAPI. All experiments were repeated at least twice, independently, with similar results.
Figure 5.
Figure 5.. The WAVE regulatory complex and Rac regulate disulfidptosis.
a, NormZ score plot showing the top suppressor (blue) and synergistic (red) hits from CRISPR/Cas9 screenings. b-h, Western blotting analysis (b), cell death measurement (c), cystine uptake measurement (d), NADP+/NADPH ratio measurement (e), Western blotting analysis (f), and fluorescent staining (g) and corresponding quantification (h) of F-actin (red) and membrane (green) in the WT and NCKAP1-KO (K1/K2) UMRC6 cells (b-f) or 786-O_SLC7A11 cells (g, h) under indicated conditions. Cell were cultured in glucose-containing or glucose-free medium for 1 (e), 3 (f), and 2 hours (g, h), respectively. i, j, Western blotting analysis (i) and cell death measurement (j) in UMRC6 cells expressing empty vector (EV) or NCKAP1-V5 and cultured in glucose-containing (+ Glc) or glucose-free (− Glc) medium for 7 hours. k-m, Western blotting analysis (k, l) and cell death measurement (m) in the WT UMRC6 cells and KO counterparts of indicated genes in glucose-free medium for 7 hours. n, o, Western blotting analysis (n) and cell death measurement (o) in WAVE-2-KO UMRC6 cells expressing EV or Flag-YFP-WAVE-2-WT/ΔVCA cultured in glucose-free medium for 5 hours. p, q, Western blotting analysis (p) and cell death measurement (q) in UMRC6 cells expressing Rac1-Q61L-V5 and those transfected with EV cultured in glucose-free medium with or without 1mM TCEP for 5 hours. r, s, Western blotting analysis (r) and cell death measurement (s) in NCKAP1-KO UMRC6 cells expressing EV or Rac1-Q61L-V5 cultured in glucose-free medium for 9 hours. t, Fluorescent staining of F-actin and Rac1 in indicated UMRC6 cells. White arrows indicate lamellipodia. All P values were calculated using two-tailed unpaired Student t-test. Data are mean ± s.d., n = 3 independent repeats except (h) (n = 4 randomly selected magnification fields). ns: not significant (P > 0.05). All Western blotting was repeated at least twice, independently, with similar results.
Figure 6.
Figure 6.. GLUT inhibitors induce disulfidptosis in SLC7A11high cells.
a, b, Glucose uptake levels (a) and NADP+/NADPH ratios (b) in UMRC6 cells treated with vehicle DMSO, 5 μM KL-11743, or 5 μM BAY-876 for 2 hours. c, d, Cell death measured by PI staining in UMRC6 cells treated with vehicle DMSO, 5 μM KL-11743 (c), or 5 μM BAY-876 (d) with or without co-treatment with deferoxamine (DFO), Ferr-1, Z-VAD, Nec-1, Nec-2, and CQ at indicated concentrations for 7 hours. e, Non-reducing and reducing Western blotting analysis of MYH9 and TLN1 in UMRC6 cells treated with vehicle DMSO, 5 μM KL-11743, and 5 μM BAY-876 for 3 hours. f, Fluorescent staining of F-actin with phalloidin in UMRC6 cells treated with vehicle DMSO, 5 μM KL-11743, and 5 μM BAY-876 for 4 hours. Nuclei were stained by DAPI. g, Tumour volumes of NCI-H226 xenografts with indicated treatments over time. Data are mean ± s.d., n = 6 mice. h, Non-reducing and reducing Western blotting analysis of NCI-H226 tumours with indicated treatments. i, Western blotting analysis of SLC7A11 protein levels in indicated PDX models. j, k, Tumour volumes of TC551 (j) and TC494 (k) PDX model with indicated treatments over time. Data are mean ± s.d., n = 8 mice. l, Non-reducing Western blotting analysis of actin in PDX tumours with indicated treatments. All P values were calculated using two-tailed unpaired Student t-test. Data are mean ± s.d., n = 3 independent repeats unless specified. ns: not significant (P > 0.05). All Western blotting was repeated at least twice, independently, with similar results.

Comment in

References

    1. Liu X et al. Cystine transporter regulation of pentose phosphate pathway dependency and disulfide stress exposes a targetable metabolic vulnerability in cancer. Nat Cell Biol 22, 476–486 (2020). - PMC - PubMed
    1. Joly JH, Delfarah A, Phung PS, Parrish S & Graham NA A synthetic lethal drug combination mimics glucose deprivation-induced cancer cell death in the presence of glucose. J Biol Chem 295, 1350–1365 (2020). - PMC - PubMed
    1. Jiang X, Stockwell BR & Conrad M Ferroptosis: mechanisms, biology and role in disease. Nat Rev Mol Cell Biol 22, 266–282 (2021). - PMC - PubMed
    1. El Mjiyad N, Caro-Maldonado A, Ramirez-Peinado S & Munoz-Pinedo C Sugar-free approaches to cancer cell killing. Oncogene 30, 253–264 (2011). - PubMed
    1. Pereira DJ, Schoolwerth AC & Pais VM Cystinuria: current concepts and future directions. Clin Nephrol 83, 138–146 (2015). - PubMed

Methods-only references

    1. Dai F et al. BAP1 inhibits the ER stress gene regulatory network and modulates metabolic stress response. Proc Natl Acad Sci U S A 114, 3192–3197 (2017). - PMC - PubMed
    1. Zhang Y et al. H2A Monoubiquitination Links Glucose Availability to Epigenetic Regulation of the Endoplasmic Reticulum Stress Response and Cancer Cell Death. Cancer Res 80, 2243–2256 (2020). - PMC - PubMed
    1. Lei G et al. Ferroptosis as a mechanism to mediate p53 function in tumor radiosensitivity. Oncogene 40, 3533–3547 (2021). - PMC - PubMed
    1. Koppula P, Zhang Y, Shi J, Li W & Gan B The glutamate/cystine antiporter SLC7A11/xCT enhances cancer cell dependency on glucose by exporting glutamate. J Biol Chem 292, 14240–14249 (2017). - PMC - PubMed
    1. Zhang Y et al. BAP1 links metabolic regulation of ferroptosis to tumour suppression. Nat Cell Biol 20, 1181–1192 (2018). - PMC - PubMed

Publication types