. 2023 Feb 21;57(7):2958-2969.
doi: 10.1021/acs.est.2c06674. Epub 2023 Feb 6.

Co-Processing Agricultural Residues and Wet Organic Waste Can Produce Lower-Cost Carbon-Negative Fuels and Bioplastics

Affiliations

Co-Processing Agricultural Residues and Wet Organic Waste Can Produce Lower-Cost Carbon-Negative Fuels and Bioplastics

Yan Wang et al. Environ Sci Technol. .

Abstract

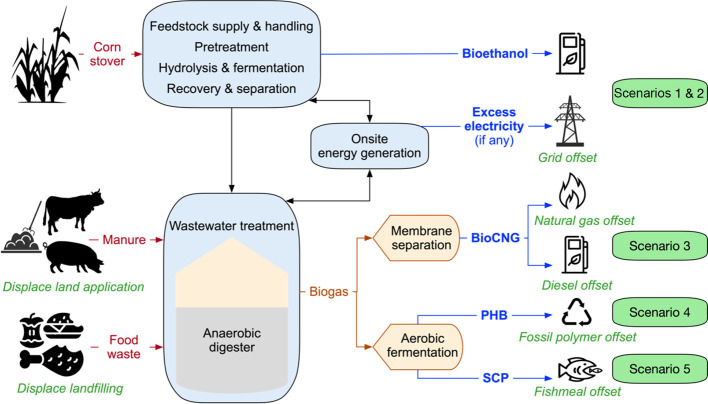
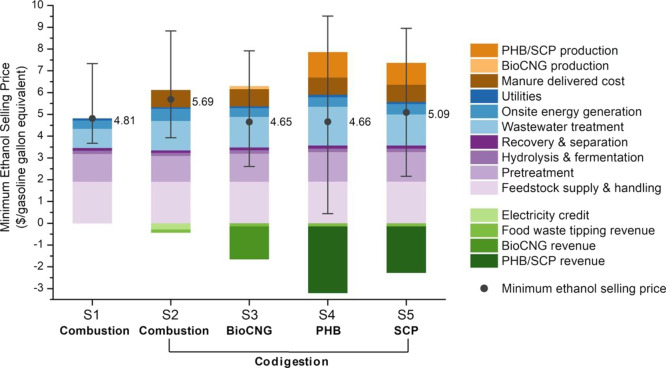
Scalable, low-cost biofuel and biochemical production can accelerate progress on the path to a more circular carbon economy and reduced dependence on crude oil. Rather than producing a single fuel product, lignocellulosic biorefineries have the potential to serve as hubs for the production of fuels, production of petrochemical replacements, and treatment of high-moisture organic waste. A detailed techno-economic analysis and life-cycle greenhouse gas assessment are developed to explore the cost and emission impacts of integrated corn stover-to-ethanol biorefineries that incorporate both codigestion of organic wastes and different strategies for utilizing biogas, including onsite energy generation, upgrading to bio-compressed natural gas (bioCNG), conversion to poly(3-hydroxybutyrate) (PHB) bioplastic, and conversion to single-cell protein (SCP). We find that codigesting manure or a combination of manure and food waste alongside process wastewater can reduce the biorefinery's total costs per metric ton of CO2 equivalent mitigated by half or more. Upgrading biogas to bioCNG is the most cost-effective climate mitigation strategy, while upgrading biogas to PHB or SCP is competitive with combusting biogas onsite.

Keywords: bioeconomy; biogas upgrading; greenhouse gas emissions; integrated biorefinery; life-cycle assessment; manure management; poly(3-hydroxybutyrate); single-cell protein; techno-economic analysis.


Conflict of interest statement

The authors declare no competing financial interest.

Figures

Figure 1
Figure 1
Cradle-to-gate system boundary for TEA and LCA. The environmental credits applicable to this multi-input multi-output biorefinery are indicated by the text in green. CNG: compressed natural gas, SCP: single-cell protein, PHB: poly(3-hydroxybutyrate). Additional details for each scenario are available in Figure 2.
Figure 2
Figure 2
Process flow diagrams for four scenarios, including (a) corn stover-to-ethanol biorefinery incorporating codigestion of organic wastes and an expanded biorefinery further incorporating (b) bioCNG, (c) PHB, and (d) SCP production, respectively. DMR: deacetylation and mechanical refining, CNG: compressed natural gas, SCP: single-cell protein, PHB: poly(3-hydroxybutyrate).
Figure 3
Figure 3
TEA results of biorefineries for bioethanol production incorporating codigestion of organic wastes and biogas utilization routes for bioCNG, PHB, and SCP production. The contribution to the MESP ($/gasoline gallon equivalent) is shown by process areas and credits (electricity export, food waste tipping revenue, and revenues from selling bioCNG, PHB, and SCP). S1: biorefinery with biogas onsite combustion. S2: integrated biorefinery with codigestion of organic wastes and biogas onsite combustion. S3: integrated biorefinery with codigestion of organic wastes and biogas upgrading to bioCNG. S4: integrated biorefinery with codigestion of organic wastes and biogas conversion to PHB. S5: integrated biorefinery with codigestion of organic wastes and biogas conversion to SCP. The amounts of organic wastes for codigestion are 4600, 1100, and 400 wet metric tons/day for hog manure, cattle manure, and food waste, respectively. The MESP values (labeled on the right of each bar) were determined using the baseline values of input parameters. Uncertainty bars represent the final MESP values for the pessimistic worst case and the optimistic best case considering the minimum and maximum values of key input parameters (Table S1). The numeric values for this figure are compiled in Table S7.
Figure 4
Figure 4
TEA results of the biorefineries incorporating codigestion of organic wastes with varying types and quantities and the biogas utilization route to PHB. The contribution to the MESP ($/gasoline gallon equivalent) is shown by process areas and credits (electricity export, food waste tipping revenue, and PHB selling revenue). S1: biorefinery with biogas onsite combustion. S2 and S2-FW (food waste): integrated biorefinery with codigestion of organic wastes and biogas onsite combustion. S4 and S4-FW: integrated biorefinery with codigestion of organic wastes and biogas conversion to PHB. Blends of hog manure, cattle manure, and food waste are considered in S2 and S4, while only food waste is considered in S2-FW and S4-FW. The quantities of organic wastes vary in S4 and S4-FW; a decrease by half and an increase by 50% relative to average resource availability (X, a total of 6100 wet metric tons/day) were modeled for comparison. The MESP values (labeled on top of each bar) were determined using the baseline values for input parameters. Uncertainty bars represent the sensitivity of the PHB selling price. The numeric values for this figure are compiled in Table S8.
Figure 5
Figure 5
Life-cycle GHG emissions for different scenarios. (a) Contribution to the GHG emissions is shown by input categories and offset credits (outlined in Figure 1). S1: biorefinery with biogas onsite combustion. S2: integrated biorefinery with codigestion of organic wastes and biogas onsite combustion. S3: integrated biorefinery with codigestion of organic wastes and biogas upgrading to bioCNG. S4: integrated biorefinery with codigestion of organic wastes and biogas conversion to PHB. S5: integrated biorefinery with codigestion of organic wastes and biogas conversion to SCP. The amounts of organic wastes for codigestion are 4600, 1100, and 400 wet metric tons/day for hog manure, cattle manure, and food waste, respectively. The GHG emissions were determined using the baseline values for inputs and offset credits (with bioCNG for offsetting diesel fuel). Uncertainty bars capture variations in all inputs and offset credits. The numeric values for (a) are compiled in Table S9. (b) Change in the life-cycle GHG emissions as a function of the electric power projections (2020–2050). Projection data (Figure S5) for two electricity subregions were considered to represent the direct electricity source for the Corn Belt region, including midcontinent independent system operator west and central. The average U.S. electricity mix was considered as the source of indirect (upstream) electricity.
Figure 6
Figure 6
Minimum required price per metric ton of CO2e mitigation at a fixed bioethanol selling price ($3/gasoline gallon equivalent, $2.05/gallon ethanol) for different scenarios. S1: biorefinery with biogas onsite combustion. S2: integrated biorefinery with codigestion of organic wastes and biogas onsite combustion. S3: integrated biorefinery with codigestion of organic wastes and biogas upgrading to bioCNG. S4: integrated biorefinery with codigestion of organic wastes and biogas conversion to PHB. S5: integrated biorefinery with codigestion of organic wastes and biogas conversion to SCP.

Similar articles

References

    1. Baker S.; Stolaroff J.; Peridas G.; Pang S.; Goldstein H.; Lucci F.; Li W.; Slessarev E.; Pett-Ridge J.; Ryerson F.. Getting to neutral: options for negative carbon emissions in California; Lawrence Livermore National Laboratory (LLNL): Livermore, CA (United States), 2019.
    1. Lynd L. R.; Beckham G. T.; Guss A. M.; Jayakody L. N.; Karp E. M.; Maranas C.; McCormick R. L.; Amador-Noguez D.; Bomble Y. J.; Davison B. H.; Foster C.; Himmel M. E.; Holwerda E. K.; Laser M. S.; Ng C. Y.; Olson D. G.; Román-Leshkov Y.; Trinh C. T.; Tuskan G. A.; Upadhayay V.; Vardon D. R.; Wang L.; Wyman C. E. Toward low-cost biological and hybrid biological/catalytic conversion of cellulosic biomass to fuels. Energy Environ. Sci. 2022, 15, 938–990. 10.1039/D1EE02540F. - DOI
    1. https://www.epa.gov/renewable-fuel-standard-program/overview-renewable-fuel-standard

    1. https://www.epa.gov/renewable-fuel-standard-program/final-volume-standards-2020-2021-and-2022

    1. Taptich M. N.; Scown C. D.; Piscopo K.; Horvath A. Drop-in biofuels offer strategies for meeting California’s 2030 climate mandate. Environ. Res. Lett. 2018, 13, 09401810.1088/1748-9326/aadcb2. - DOI

Publication types