[Preprint]. 2023 Jan 24:rs.3.rs-2412371.
doi: 10.21203/rs.3.rs-2412371/v1.

Scanless two-photon voltage imaging

Affiliations

Scanless two-photon voltage imaging

Ruth R Sims et al. Res Sq. .

Update in

  • Scanless two-photon voltage imaging.
    Sims RR, Bendifallah I, Grimm C, Lafirdeen ASM, Domínguez S, Chan CY, Lu X, Forget BC, St-Pierre F, Papagiakoumou E, Emiliani V. Sims RR, et al. Nat Commun. 2024 Jun 14;15(1):5095. doi: 10.1038/s41467-024-49192-2. Nat Commun. 2024. PMID: 38876987 Free PMC article.

Abstract

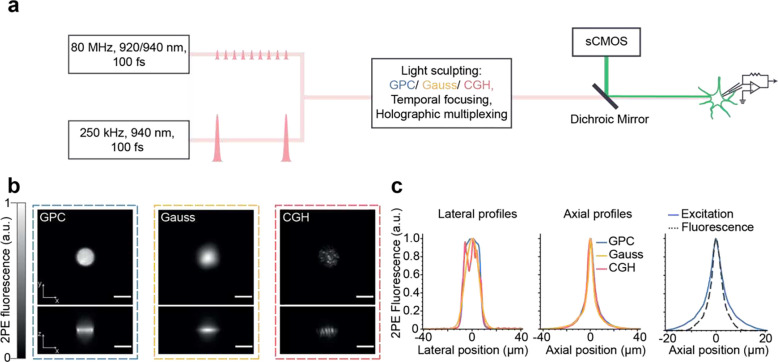
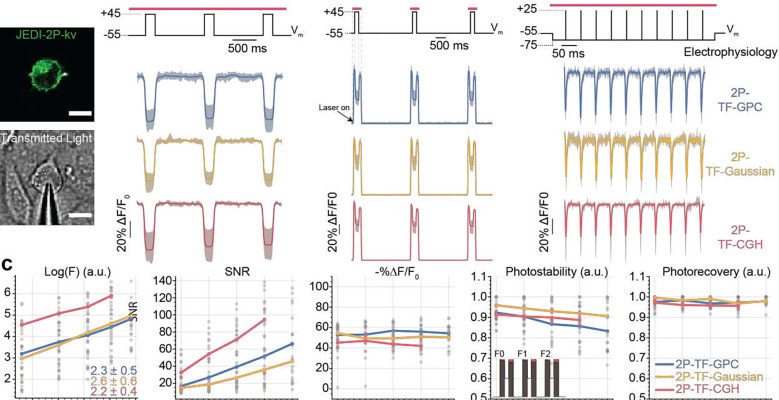
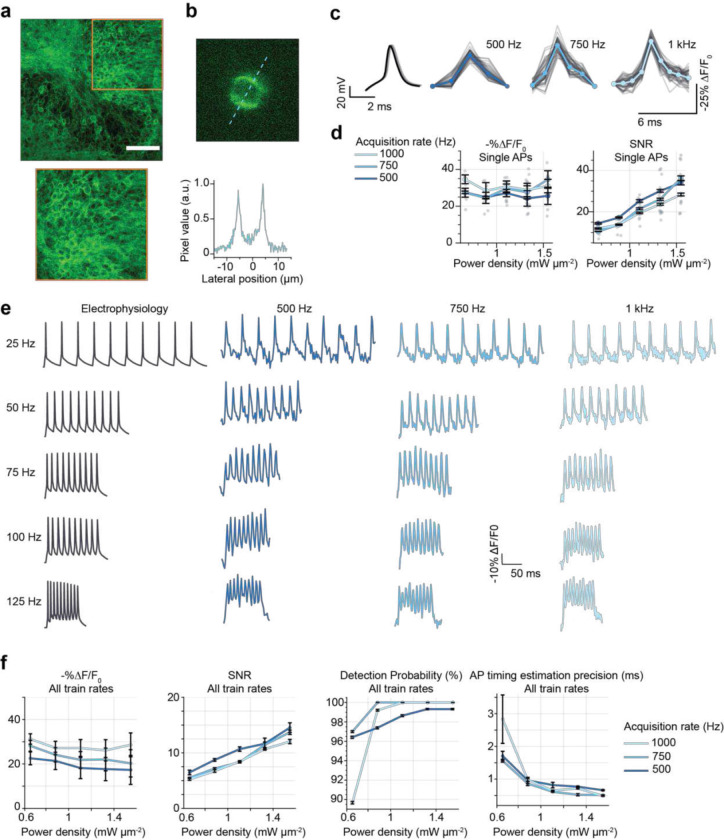
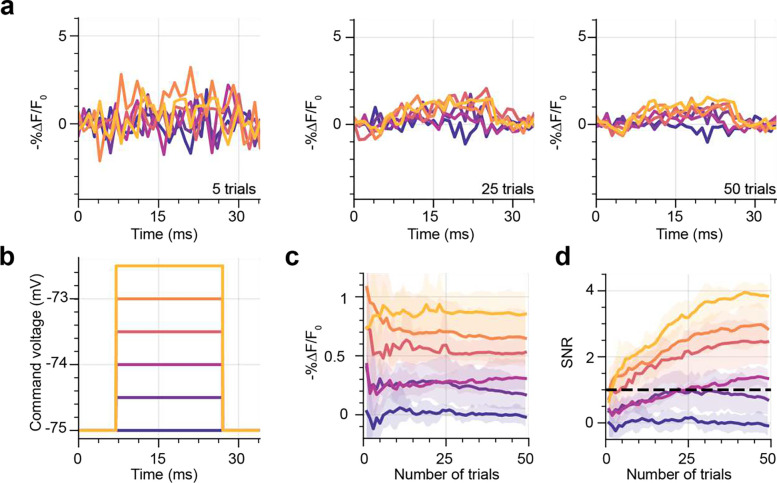
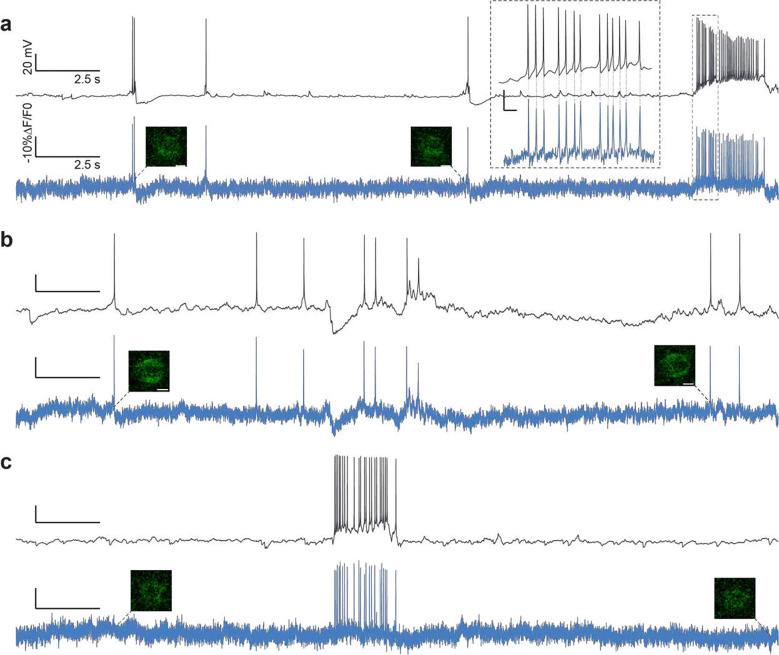
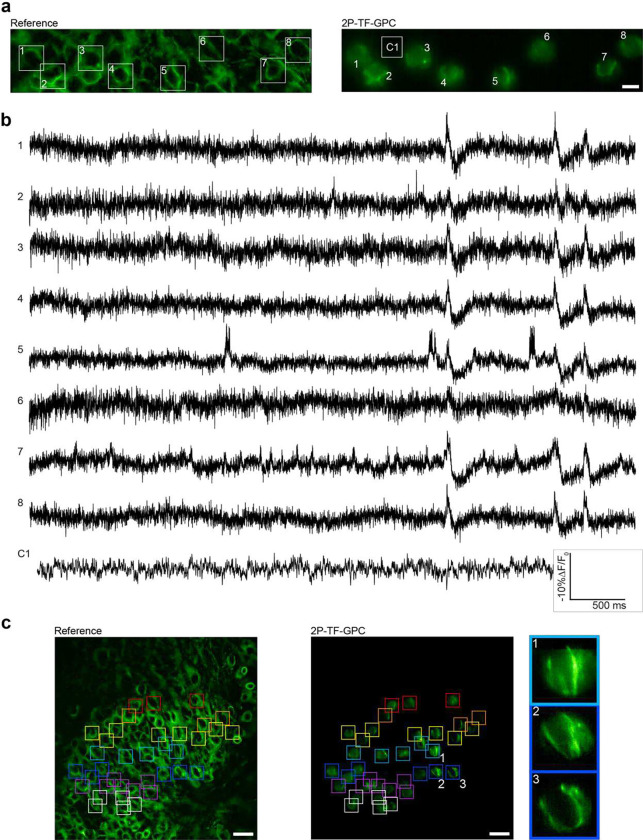
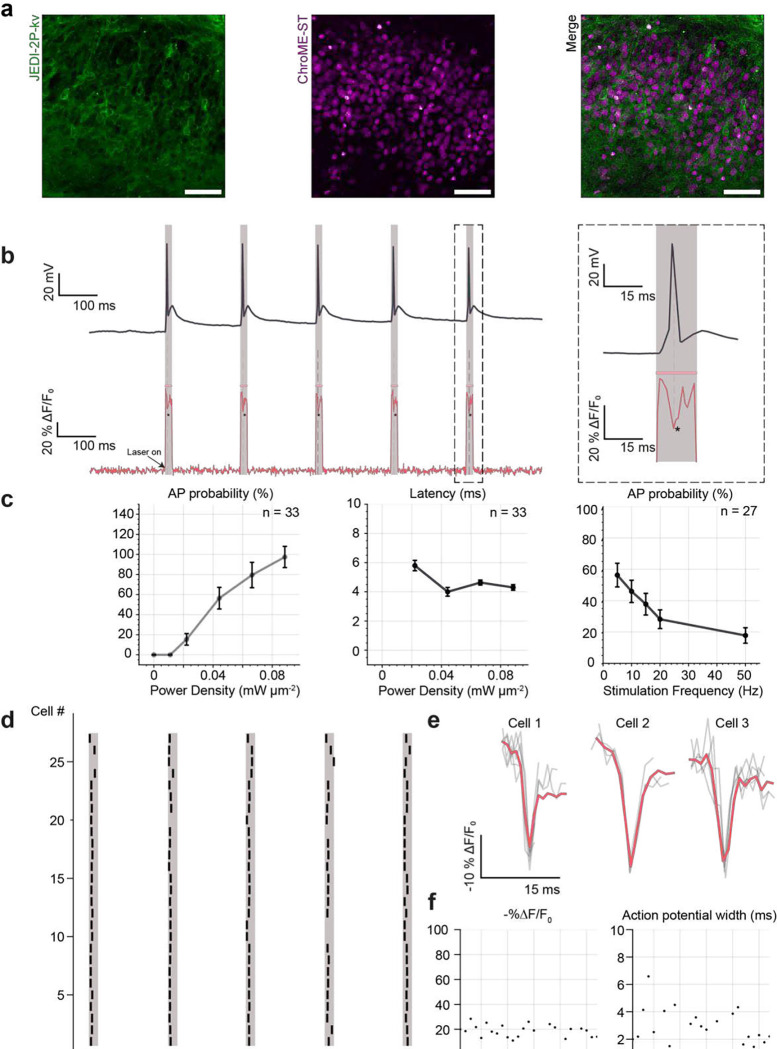
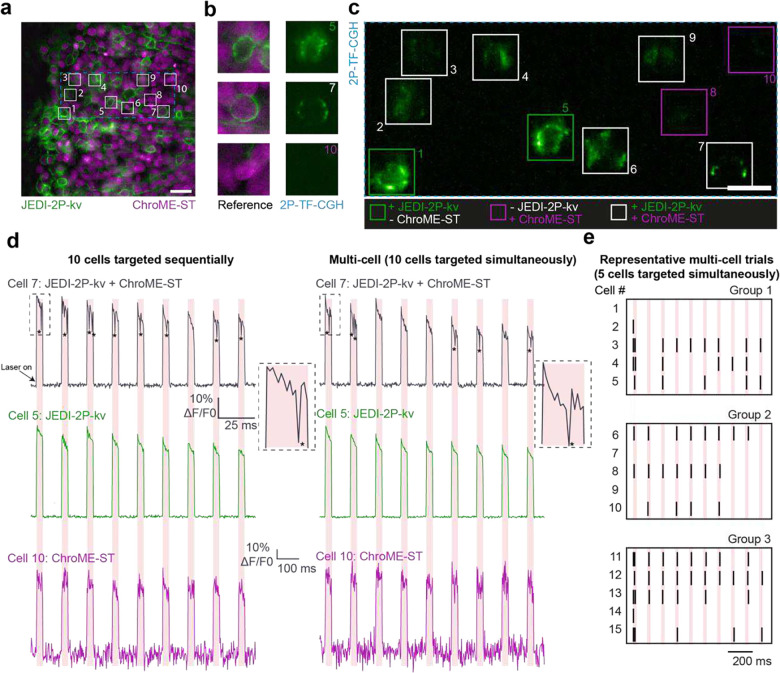
Parallel light-sculpting methods have been used to perform scanless two-photon photostimulation of multiple neurons simultaneously during all-optical neurophysiology experiments. We demonstrate that scanless two-photon excitation also enables high-resolution, high-contrast, voltage imaging by efficiently exciting fluorescence in a large fraction of the cellular soma. We present a thorough characterisation of scanless two-photon voltage imaging using existing parallel approaches and lasers with different repetition rates. We demonstrate voltage recordings of high frequency spike trains and sub-threshold depolarizations in intact brain tissue from neurons expressing the soma-targeted genetically encoded voltage indicator JEDI-2P-kv. Using a low repetition-rate laser, we perform recordings from up to ten neurons simultaneously. Finally, by co-expressing JEDI-2P-kv and the channelrhodopsin ChroME-ST in neurons of hippocampal organotypic slices, we perform single-beam, simultaneous, two-photon voltage imaging and photostimulation. This enables in-situ validation of the precise number and timing of light evoked action potentials and will pave the way for rapid and scalable identification of functional brain connections in intact neural circuits.

Keywords: Two-photon microscopy; computer-generated holography; optogenetics; temporal focusing; voltage imaging.


Figures

Figure 1
Figure 1. Schematic and characterization of the optical setup developed for scanless two-photon voltage imaging
(a) Summary of the optical setup designed to generate 12 μm (Full Width Half Maximum), temporally focused, Gaussian, Generalised Phase Contrast (GPC) and holographic (CGH) spots. The setup was equipped with three lasers, two of them delivering nJ-pulse energies at 80 MHz (Coherent Discovery, 1 W, 80 MHz, 100 fs tuned to 920, 940 or 1030 nm; Spark Alcor, 4 W, 80 MHz, 100 fs, 920 nm) and the third a custom Optical Parametric Amplifier (OPA) pumped by an amplified fibre laser, with fixed wavelength output (Amplitude Satsuma Niji, 0.5–0.6 W, 250 kHz, 100 fs, 940 nm). Fluorescence signals were acquired using an sCMOS camera. The microscope was equipped for electrophysiology patch-clamp recordings. (b) Lateral and axial cross sections of two-photon excited fluorescence generated with Gaussian (yellow), GPC (blue) and GCH (red) beams, as indicated in the legend. Scale bars represent 10 μm. (c) Lateral and axial profiles of two-photon excited fluorescence generated with each excitation modality, and the corresponding system response, demonstrating single-cell resolution.
Figure 2
Figure 2. In-vitro electrophysiological characterisation of scanless two-photon voltage imaging in cultured CHO cells.
(a) Confocal image of a JEDI-2P-kv expressing CHO cell (upper) and transmitted light image of a patched CHO cell (lower). Scale bars represent 10 μm. (b) Data from three protocols used to test the performance of each of the three different parallel illumination modalities for two-photon voltage imaging. Responses are reported as the fluorescence change (ΔF) normalized by the baseline fluorescence (F0), expressed as a percentage of the baseline fluorescence (%ΔF/F0). The average trace and 95 percent confidence interval from all cells imaged with each modality are plotted (blue – GPC, yellow – Gaussian, red – CGH). The corresponding electrophysiology control signals are plotted in black. The red bar above the electrophysiology trace indicates the illumination epoch. (c) Quantification of data for all cells from protocol 2. Log(F), SNR, −%ΔF/F0, photobleaching and photorecovery are plotted as a function of power density (power density: 0.66 – 1.55 mW μm−2, 75 – 175 mW per cell, n = 8 – 13), see also Supplementary Figure 9. Each point represents a measurement from an individual cell. The mean is plotted for each condition. Photostability is defined as the ratio between the integral of the baseline fluorescent trace to F0*nt where F0 represents the fluorescence in the first frame and nt the number of baseline fluorescence timepoints (see schematic diagram, fourth panel, inset). Photorecovery is defined as the average ratio of the fluorescence prior to the 100-mV depolarization in each illumination epoch (for instance F1/F0 as defined in the schematic diagram, fourth panel, inset). All data was acquired with laser A tuned to 940 nm and camera A (See Supplementary Figure 1 and Supplementary Tables 1 and 2).
Figure 3
Figure 3. Recording electrically evoked single action potentials and high-frequency spike trains in JEDI-2P-kv expressing hippocampal organotypic slices with 2P-TF-GPC.
(a) Upper: confocal image of a representative organotypic slice bulk-infected with JEDI-2P-kv. Scale bar represents 75 μm. Lower: zoom (x2) of densely expressing region where data was recorded. (b) Upper: representative single frame from data acquired with TF-GPC (1 ms exposure time), Lower: line-profile through the image (indicated by the dashed line) demonstrating that single cells are imaged with high-contrast in densely labelled samples with 2P-TF-GPC. (c) Electrically induced and recorded action potentials (left) and optically recorded (right) were resolved in single trials using 2P-TF-GPC at different acquisition rates. Individual trials are plotted in grey. The average trace across all trials is plotted in a different shade of blue corresponding to each acquisition rate (500 Hz, 750 Hz and 1 kHz, as labelled). Power density: 1.1 mW μm−2 (125 mW per cell). (d) −%ΔF/F0 and SNR plotted as a function of power density in different shades of blue for different acquisition rates (see legend). Error bars represent the standard error of measurements across all cells (n = 4–6). Individual points represent the average value over 50 action potentials for individual cells. All data were acquired using laser A tuned at 940 nm, and camera A (See Supplementary Figure 1 and Supplementary Tables 1 and 2). (e) Representative fluorescence traces recorded from individual cells to different rates of electrically evoked spike trains recorded at the different acquisition rates of 500 Hz, 750 Hz and 1 kHz corresponding to 2 ms, 1,33 ms and 1 ms exposure time (power density: 1.1 mW μm−2, 125 mW per cell). A representative trace of electrically evoked spike trains is also plotted in black (left). (f) −%ΔF/F0, SNR, action potential detection probability and precision of action potential timing estimation (defined as the jitter in timing estimation for all identified action potentials relative to the corresponding electrophysiological recordings) plotted as a function of power density for different acquisition rates (500 Hz, 750 Hz, and 1 kHz, see legend). A lower value indicates superior timing estimation. Data plotted for all train rates (n = 2–5). All data were acquired using laser B fixed at 920 nm, and camera B (See Supplementary Figure 1 and Supplementary Tables 1 and 2
Figure 4
Figure 4. Recording sub-threshold depolarizations in JEDI-2P-kv expressing hippocampal organotypic slices using 2P-TF-GPC.
(a) Average fluorescence traces recorded from neurons after 5, 25 and 50 trials for different magnitudes of sub-threshold depolarizations ranging between 0 and 2.5 mV. Sub-threshold depolarisations < 2.5 mV cannot be reliably resolved in single trials using 2P-TF-GPC and JEDI-2P-kv, however after 25 trials depolarisations greater than or equal to 1 mV can be resolved. Traces were recorded with a 1 ms exposure time and 1.1 mW μm−2 (125 mW per cell). (b) Command voltage steps used to change the membrane potential of patched neurons. (c) Average −%ΔF/F0 and (d) SNR of the fluorescence response to different sub-threshold changes of membrane potential plotted as a function of number of repeats. The 95% confidence interval is also plotted (shaded region). All data (n = 6) were acquired using laser B fixed at 920 nm and camera B (See Supplementary Figure 1 and Supplementary Tables 1 and 2).
Figure 5
Figure 5. Recording spontaneous neural activity in JEDI-2P-kv expressing hippocampal organotypic slices using 2P-TF-GPC
(a-c) Simultaneous current clamp (upper, black) and fluorescence recordings (lower, blue) of spontaneous activity in neurons from hippocampal organotypic slices over a continuous 30 s recording period. Single imaging frames are shown close to the beginning and end of each recording. Scale bars represent 5 μm. Inset, (a) zoomed in portion of the electrophysiological and fluorescence traces. Corresponding action potentials in the electrophysiological and fluorescence traces (average rate: 17 Hz) is indicated by the dashed lines. (Power density: 1.33 mW μm−2, 150 mW per cell, 1 kHz acquisition rate). All data was acquired using laser A tuned to 940 nm and camera A (See Supplementary Figure 1 and Supplementary Tables 1 and 2).
Figure 6
Figure 6. Multi-cell recordings of spontaneous neural activity in JEDI-2P-kv expressing hippocampal organotypic slices using multiplexed 2P-TF-GPC
(a) Reference image of a hippocampal organotypic slice expressing JEDI-2P-kv in the dentate gyrus (left panel) and average projection of the corresponding voltage imaging dataset (right panel). 8 neurons targeted simultaneously with 8, 12-μm 2P-TF-GPC spots can be identified (as numbered and highlighted by the square boxes). The scale bar represents 10 μm. C1 refers to the area used to generate the control trace plotted in (b). This ROI was not targeted with a GPC spot during experiments. (b) Fluorescent traces plotted for each of the neurons indicated in (a), including the control trace. (c) Voltage imaging throughout a large field of view using multiplexed 2P-TF-GPC. Left panel: cross-section of a hippocampal organotypic slice expressing JEDI-2P-kv in the dentate gyrus. Middle panel: combined maximum projections of data from 7 consecutive acquisitions (indicated by the coloured squares), spanning a total area of 200 × 150 μm². Zoom in for best viewing. Scale bars represent 25 μm. Right panel: zoomed in regions of the central panel (indicated by numbering and coloured boxes) showing maximum projections of data acquired from individual cells targeted with multiplexed 2P-TF-GPC. All data was acquired using laser C (940 nm, power density: 0.02 – 0.09 mW μm−2, 2.5 – 10 mW per cell) and camera A with an acquisition rate of 1 kHz (See Supplementary Figure 1 and Supplementary Tables 1 and 2).
Figure 7
Figure 7. Fluorescence recordings of photo-evoked spikes in hippocampal organotypic slices co- expressing JEDI-2P-kv and ChroME-ST, using 2P-TF-CGH.
(a) Cross-sections of hippocampal organotypic slices co-expressing the genetically encoded voltage indicator JEDI-2P-kv and the soma-targeted channelrhodopsin ChroME-ST in the dentate gyrus. Channelrhodopsin-expressing cells were identified according to their nuclear-localized fluorescence (see Methods). Scale bar represents 50 μm. (b) (left) Simultaneous optical and electrophysiological recordings demonstrating that action potentials can be evoked and imaged using a single excitation spot (12 μm diameter, power density 0.02 mW μm−2 (2.5 mW per cell), 15 ms strobed illumination at 5 Hz). (right) Zoom on simultaneous optical and electrophysiological recordings of one action potential. (c) All-optical in-situ characterisation of photo evoked action potentials. Error bars represent the standard error of recordings obtained for 33 cells. The probability of evoking and recording action potentials is plotted as a function of power density. Only cells in which at least one optically evoked action potential was detected are included. The latency of optically evoked action potentials is plotted as a function of power density. The average latency measured all-optically matches that obtained using electrophysiology (Supplementary Figure 20c). The action potential probability is plotted as a function of stimulation frequency. Action potential probability is calculated as the number of action potentials evoked and recorded over five trials (power density: 0.01 – 0.09 mW μm−2, 1.5 – 10 mW per cell). Error bars represent the standard error of recordings obtained for 33 cells. (d) Raster plot of 27 cells showing the number and timing of optically evoked action potentials (black) relative to the imaging/photostimulation epoch (red) (power density: 0.02 – 0.08 mW μm−2, 2.5 – 9 mW per cell). (e) Examples of fluorescence recordings of optically evoked action potentials for three representative cells. Individual trials are plotted in grey. The average trace across all trials is plotted in red (power density: 0.02 – 0.08 mW μm−2, 2.5 – 9 mW per cell). (f) Summary statistics for the amplitude (−%ΔF/F0) and width of the optically evoked action potentials from (d). All data were acquired using laser C fixed at 940 nm and camera A (See Supplementary Figure 1 and Supplementary Tables 1 and 2).
Figure 8
Figure 8. Characterisation of simultaneous multi-target photostimulation and voltage imaging using a single beam scanless two-photon excitation.
(a) Cross-sections of hippocampal organotypic slices co-expressing JEDI-2P-kv and ChroME-ST in the dentate gyrus. The boxes indicate cells that were targeted simultaneously during a representative experiment (as numbered). Scale bar represents 25 μm. (b) Reference widefield images of individual targeted cells (left) and corresponding images obtained using 2P-TF-CGH. Upper: a cell exclusively expressing JEDI-2P-kv. Middle: a cell co-expressing JEDI-2P-kv and ChroME-ST. Lower: a cell exclusively expressing ChroME-ST. (c) Data acquired when the 10 cells identified in (a) were targeted simultaneously using 2P-TF-CGH and imaged at 500 Hz. Scale bar represents 15 μm. (d) Traces from the three cells highlighted in (b) when targeted sequentially (left) or simultaneously (right). Of the three selected cells, as expected, no action potentials were detected for cell 5 (green) or cell 10 (purple), which did not co-express the two constructs. In both the sequential and multi-cell acquisitions, action potentials were only evoked/ recorded in the cells co-expressing JEDI-2P-kv and ChroME-ST (black). (e) Raster plots from 3 further experiments in which 5 cells were targeted simultaneously. Black lines indicate the time at which a cell fired; the red lines indicate the imaging/photostimulation laser. All data were acquired using laser C fixed at 940 nm and camera A (See Supplementary Figure 1 and Supplementary Tables 1 and 2).

References

    1. Scanziani M. & Hausser M. Electrophysiology in the age of light. Nature 461, 930–939 (2009). - PubMed
    1. Emiliani V. et al. Optogenetics for light control of biological systems. Nat. Rev. Methods Prim. 2, 55 (2022). - PMC - PubMed
    1. Abdelfattah A. et al. Neurophotonic Tools for Microscopic Measurements and Manipulation: Status Report. Neurophotonics 9, 1–86 (2022). - PMC - PubMed
    1. Clapham D. E. Calcium Signaling. Cell 131, 1047–1058 (2007). - PubMed
    1. Grienberger C. & Konnerth A. Imaging Calcium in Neurons. Neuron 73, 862–885 (2012). - PubMed

Publication types

LinkOut - more resources