[Preprint]. 2024 Jan 5:2023.01.26.525747.
doi: 10.1101/2023.01.26.525747.

Scientific civility and academic performance

Affiliations

Scientific civility and academic performance

Emma Camacho et al. bioRxiv. .

Abstract

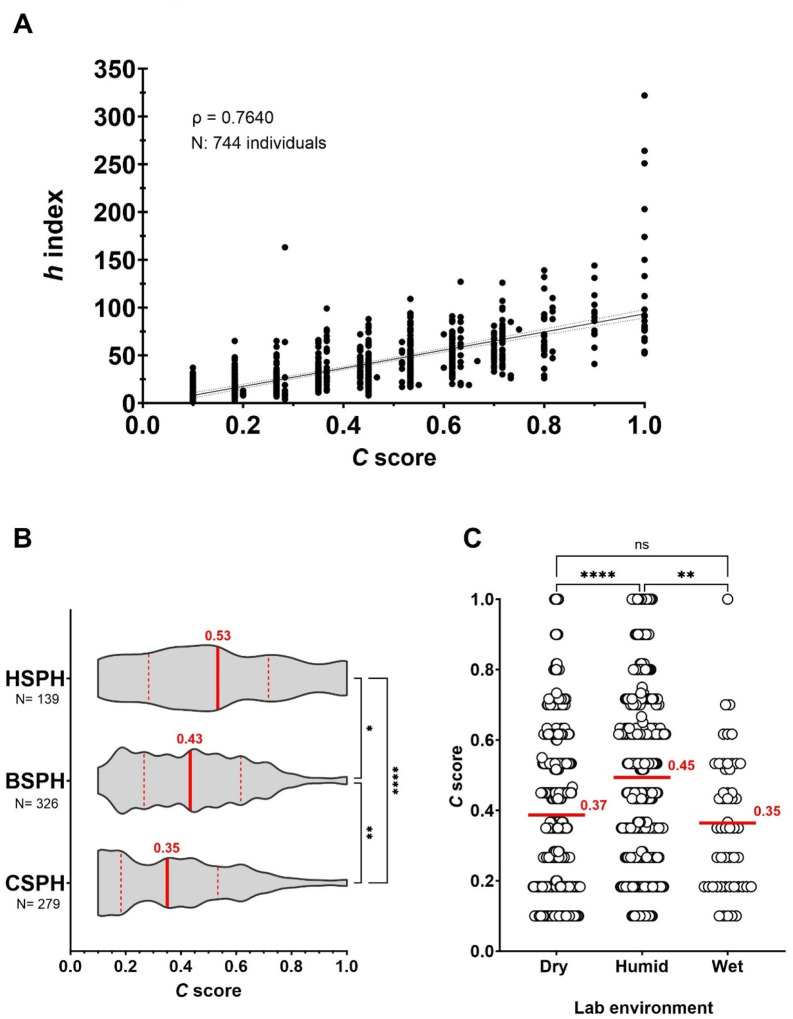
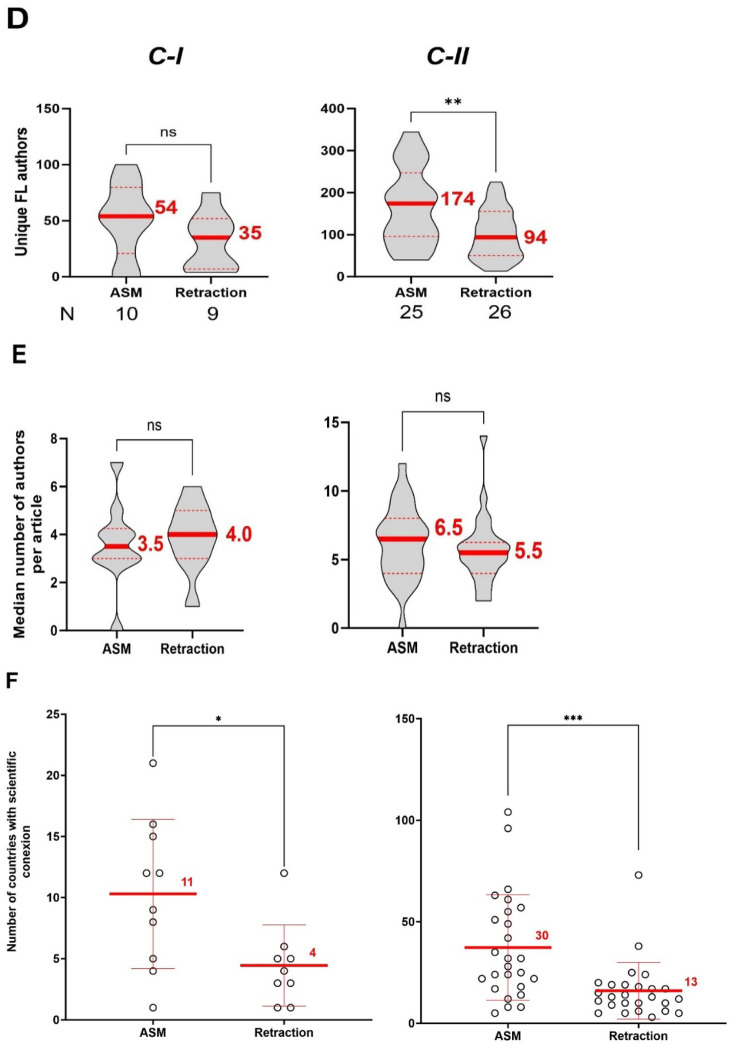
In modern science, interdisciplinary and collaborative research is encouraged among scientists to solve complex problems. However, when the time comes to measure an individual's academic productivity, collaborative efforts are hard to conceptualize and quantify. In this study, we hypothesized that a social behavior coined "scientific civility", which encompasses civility, collaboration, cooperation, or a combination of these, enhances an individual's productivity influencing their academic performance. To facilitate recognition of this unique attribute within the scientific environment, we developed a new indicator: the C score. We examined publicly available data from 1000 academic scientists at the individual-level, focusing on their scholarly output and collaborative networks as a function of geographic distribution and time. Our findings strongly suggest that the C score gauges academic performance from an integral perspective based on a synergistic interaction between productivity and collaborative networks, prevailing over institutionally limited economic resources and minimizing inequalities related to the length of individual's academic career, field of investigation, and gender.


Figures

Fig. 1.
Fig. 1.. Prolific scholarly productivity among scientists in academia is intrinsically motivated.
A) Distribution of research productivity based on the number of published articles per year, or research output per year, (ROY) among tenure-track professors from the Bloomberg Johns Hopkins University School of Public Health (BSPH), Columbia University Mailman School of Public Health (CSPH), Harvard T.H. Chan School of Public Health (HSPH), and Nobel Laureates in Chemistry, Physics, Economic Sciences, and Physiology from 2010 to 2020. B) Distribution of productivity from same population described in panel A but plotted according to their academic ranks: Assistant Professor (Assist. Prof), Associate Professor (Assoc. Prof), and Professor (includes Full Professors, Chairs, and JHU members of the National Academy of Science). C) Distribution of productivity from same population described in panel A but plotted according to their assigned gender.
Fig. 2.
Fig. 2.. Collaborative networks (CN) built during a scientist academic career reflect their sphere of influence.
Diagram of collaborative efforts assessed as a function of geographic distribution and time. Upper panel, Global collaborative network captures the ability to establish interactions (collaborative projects) among diverse socio-cultures structures (culturally diverse individuals) through knowledge representations (e.g. research articles, books, patents, software, or other scholarly output) and the natural world (research institutions across the seven continents) connected via formal or informal flows of information. Middle panel, Long-term collaborations capture the ability to develop and maintain prolific productivity with unique scientists over a decade. Bottom panel, Brand-new collaborations refer to the ability to intellectually engage with new investigators. Thickness of interconnecting lines represents level of engagement between individuals in terms of number of published articles (pa). Dark blue represents an individual’s network that is being assessed.
Fig. 3.
Fig. 3.. C score, a prospective metric to integrally analyze academic output and collaborative initiatives across diverse research domains.
A scientist’s h index shows a positive strong relationship with the C score. A) Case study of three diverse SPHs in the USA: Harvard T.H. Chan School of Public Health (HSPH), Bloomberg Johns Hopkins University School of Public Health (BSPH), and Columbia University Mailman School of Public Health (CSPH). B) C score distribution in each SPH. C) C score distribution by grouping departments according to the type of laboratory environment.
Fig. 4.
Fig. 4.. C score is a strong index to track advancement of an individual’s academic career revealing no gender bias between peers of equal rank.
A) The C score is not affected by the length of an individual’s academic career. B) Median C score of academic ranks reflect progress within the academic career track. C) C score comparisons between male and female professors show strong differences. D) Gender disparities disappeared when comparing C score between peers of equal academic rank.
Fig. 5.
Fig. 5.. The C score reflects the likelihood of being recognized by a prestigious award and does not reflect a cumulative pattern.
A) Case study of Nobel Laurates from 2010–2020 in four categories. B) Individual categories of Nobel Prizes also demonstrated a strong to very strong association between the two variables. C) The C score dynamics during the length of a scientist’s career reflect distinct levels of engagement with collaborative projects. The dotted line refers to the year that the selected scientists were awarded a Nobel prize.
Fig. 6.
Fig. 6.. Active collaborative networks can overcome economic limitations but are unlikely to reflect an individual’s motivation for science.
A) Case study of ASM International Fellows from Middle Income Economies countries shows that intense collaborative efforts serve as catalyst for increased productivity. B) Case study of retracted authors also reveals high collaborative work driving enhanced productivity. C) The C score does not portray the motivational factors impacting productivity.
Fig. 7.
Fig. 7.. Large and sustained collaborative networks bolster an individual’s academic performance in response to distinct motivational needs.
A) Total number of unique collaborators indicates a strong correlation with the C score. B) Number of unique First and Last author collaborators, indicative of efficient collaborative tendencies, reveal a very strong correlation with the C score. C) Using as conceptual framework for human motivation Maslow’s hierarchy of needs, C score levels portray the motivational factors impacting productivity. D) A distinct network size with highly significant increments is shown according to C score level.
Fig. 8
Fig. 8. Size-unique differences in the collaborative networks between female and male scientists do not impact their scientific output nor funding.
A) Peer-comparisons within same C level demonstrate that even female scientists tent to have smaller networks than male size (upper panel), this do not play in disadvantage to female productivity (lower panel). B) The generation of knowledge by research teams typically involves around 3 to 6 individuals. C) A scientist’s sphere of influence shows exponential growth as his/her motivational factors to engage in collaborative efforts move up in the C level categories.
Figure 9.
Figure 9.. Insights on the characteristics of research collaboration networks of two distinguishing sub-groups based on the C score levels.
A) Size of collaborative networks of Nobel Laureates from 2010–2020 and compositional distribution (pie chart) according to prize categories. B) Estimated size of Nobel Laureate’s scientific teams range from 1 to 5 members. C) As for academic tenure-track professors, Nobel Laureate’s sphere of influence expanded in proportion to the size of their collaborative networks. D–F) Structural and evolutive comparisons between collaborative networks of ASM fellow and Retraction-related scientists according to their C level.

References

    1. Fortunato S, Bergstrom CT, Borner K, Evans JA, Helbing D, Milojevic S, et al. Science of science. Science. 2018;359(6379). Epub 2018/03/03. doi: 10.1126/science.aao0185. - DOI - PMC - PubMed
    1. Allison PD, Scott Long J, Krause TK. Cumulative Advantage and Inequality in Science. American Sociological Review. 1982;47(5):615–25.
    1. Petersen AM, Wang F, Stanley HE. Methods for measuring the citations and productivity of scientists across time and discipline. Phys Rev E Stat Nonlin Soft Matter Phys. 2010;81(3 Pt 2):036114. Epub 2010/04/07. doi: 10.1103/PhysRevE.81.036114. - DOI - PubMed
    1. Garfield E, Welljams-Dorof A. Of Nobel class: a citation perspective on high impact research authors. Theor Med. 1992;13(2):117–35. Epub 1992/06/01. doi: 10.1007/BF02163625. - DOI - PubMed
    1. Garfield E. The evolution of the Science Citation Index. Int Microbiol. 2007;10(1):65–9. Epub 2007/04/05. - PubMed

Publication types