[Preprint]. 2023 Jan 26:2023.01.25.525583.
doi: 10.1101/2023.01.25.525583.

Using Mechanistic Models and Machine Learning to Design Single-Color Multiplexed Nascent Chain Tracking Experiments

Affiliations

Using Mechanistic Models and Machine Learning to Design Single-Color Multiplexed Nascent Chain Tracking Experiments

William S Raymond et al. bioRxiv. .

Update in

Abstract

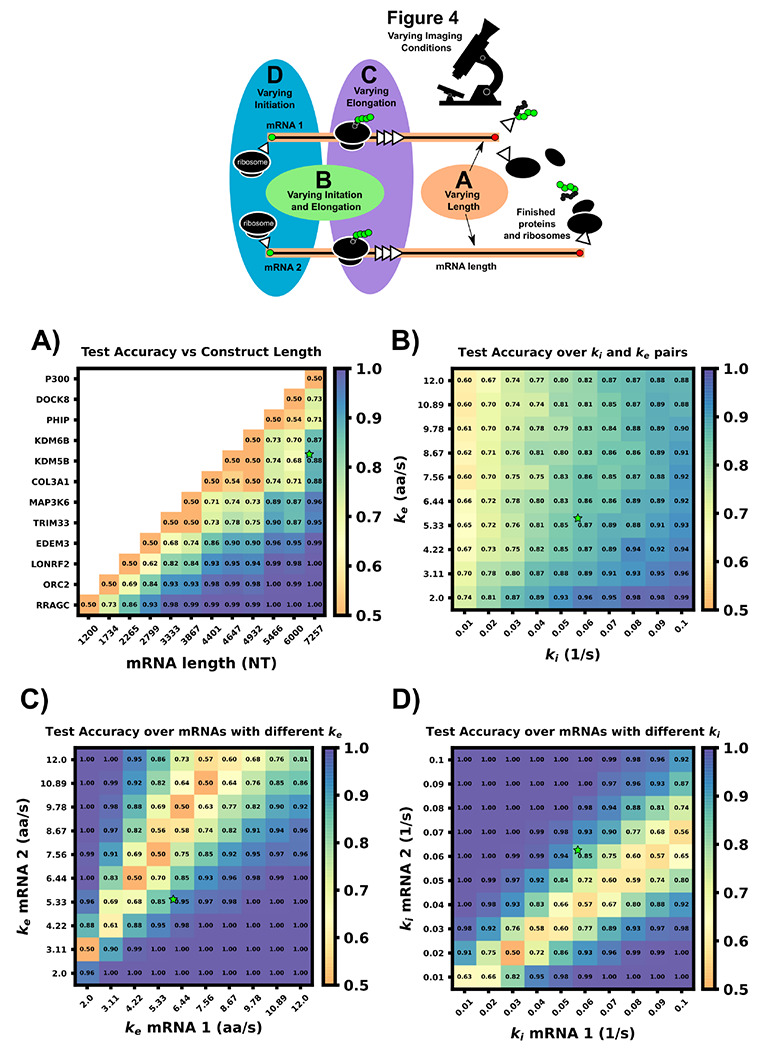
mRNA translation is the ubiquitous cellular process of reading messenger-RNA strands into functional proteins. Over the past decade, large strides in microscopy techniques have allowed observation of mRNA translation at a single-molecule resolution for self-consistent time-series measurements in live cells. Dubbed Nascent chain tracking (NCT), these methods have explored many temporal dynamics in mRNA translation uncaptured by other experimental methods such as ribosomal profiling, smFISH, pSILAC, BONCAT, or FUNCAT-PLA. However, NCT is currently restricted to the observation of one or two mRNA species at a time due to limits in the number of resolvable fluorescent tags. In this work, we propose a hybrid computational pipeline, where detailed mechanistic simulations produce realistic NCT videos, and machine learning is used to assess potential experimental designs for their ability to resolve multiple mRNA species using a single fluorescent color for all species. Through simulation, we show that with careful application, this hybrid design strategy could in principle be used to extend the number of mRNA species that could be watched simultaneously within the same cell. We present a simulated example NCT experiment with seven different mRNA species within the same simulated cell and use our ML labeling to identify these spots with 90% accuracy using only two distinct fluorescent tags. The proposed extension to the NCT color palette should allow experimentalists to access a plethora of new experimental design possibilities, especially for cell signalling applications requiring simultaneous study of multiple mRNAs.


Conflict of interest statement

Conflict of Interest Statement

The authors declare that the research was conducted in the absence of any commercial or financial relationships that could be construed as a potential conflict of interest.

Figures

Figure 1:
Figure 1:. Overview of approach to simulate Nascent Chain Tracking data and assign labels.
rSNAPsim provides simulated NCT fluorescent intensity trajectories from a codon-dependent TASEP model for each mRNA spot. rSNAPed adds experimental spatial movement (Brownian motion) and temporal noise by introducing a point spread function for each spot. Simulated cell background frames are generated randomly from a per pixel Gaussian distribution with their means and standard deviations taken from 20 frames of real blank cell backgrounds. Spots in videos are processed with the disk and doughnut method to generate simulated NCT intensity data.
Figure 2:
Figure 2:. Machine learning to classifier mRNA spots
(A) The ML model consists of two separate convolutional layers – one receiving a normalized fluorescent trajectory and the other an intensity autocorrelation. The filter outputs are regularized and concatenated for a dense layer of 200 neurons for classification. Fundamentally, this architecture learns off frequency and intensity information from the NCT trajectory. B) Accuracy of the architecture for different training data sets. A total of 4000 unique spot trajectories were split into 2-10 independent training data sets of the specified size. A classifier was trained with each training data set and tested on the same withheld validation set of 1000 NCT spots. A trend-line was added by fitting a Hill function to the test accuracy average across 15 bins in training data size (y=0.5+0.391+(6.336/x).521). The architecture was applied on simulated P300 and KDM5B trajectories from the selected base experimental condition (5s frame interval, 64 frames, 0.06 1/s initiation rate, 5.33 aa/s elongation rate).
Figure 3:
Figure 3:. Example for labeling identically-tagged mRNAs in a simulated NCT experiment.
(A, top) Two simulated cells with 25 KDM5B and 25 P300 spots translating at identical biophysical parameters. (a, bottom) Spot 11 in Cell 1 is highlighted in the intensity trace, showing the red background, green background, and extracted spot intensity via the disk and doughnut method. (B) Model parameters (ki and ke) are inferred by fitting auto-correlation functions and intensity distributions. (C) A classifier is trained with a large cohort of simulated data generated with the inferred parameters. (D) This classifier can then be used to label the original data or any subsequent data taken.
Figure 4:
Figure 4:. Classification accuracy versus imaging conditions and differences in mRNA intensity mean.
(A) Accuracy versus frame interval and number of frames. (Left) For constructs with substantially different intensities, the classifier requires only a few frames for a high classification accuracy. (Middle) Overlapping, but non-identical, intensity conditions leverage both frequency and intensity information for classification. (Right) Identical intensity conditions can only classify using frequency information, which requires an ideal frame interval. (B) Accuracy of ML using Intensity only (I), Frequency only (F), and both (IF) versus frame interval (top) or number of frames (bottom). Plots for (IF) correspond to the vertical and horizontal regions highlighted in Panel A, middle.
Figure 5:
Figure 5:. Comparison of ML test accuracy under variations in biophysical parameters.
(Top) legend of which experimental parameters are changed for each panel. (A) Effect of construct length on classification test accuracy when trained on 4000 NCT spots and tested on 1000 withheld spots. Imaging conditions, initiation, and elongation are held constant while mRNA lengths are swept from 1200 NT to 7257 NT using different mRNAs. All classifiers are trained on 4000 NCT spots and tested on 1000 NCT spots to get the test accuracy. (B) Classification accuracy for P300 and KDM5B versus shared initiation and elongation rates. (C) Classification of P300 and KDM5B with shared initiation rate (0.06 1/s) but with different varying elongation rates. D) Classification of P300 and KDM5B with shared elongation rates (5.33 aa/s) and varying initiation rates. The green star in each panel denotes the default P300/KDM5B experiment with 5s frame interval, 64 frames, initiation rate of 0.06 1/s, and elongation rate of 5.33 aa/s.
Figure 6:
Figure 6:. Increasing video length to resolve difficult to classify mRNA combinations.
(A) Classification accuracy versus mRNA length fold difference, assuming identical tag designs and parameters and videos with 64, 128, or 1500 frames. (B) Classification accuracy for P300 and KDM5B with identical tags and parameters vs average P300 intensity (proxy for signal-to-noise ratio). As SNR, video length, and resolution increase, there is a corresponding increase in classification accuracy. (C) Classification accuracy versus ratio of P300 and KDM5B elongation rates. As parameters approach the dotted line at ke,P300/ke,KDM5B = 1.46, the frequency and intensity information is identical between the two mRNAs, and increasing video length provides only marginal improvements. (D) Classification accuracy versus ratio of P300 and KDM5B initiation rates. As parameters approach the dotted line at ki,P300/ki,KDM5B = 0.648, the two mRNA attain similar intensity means, but classification can be achieved through frequency content and is improved substantially by collecting longer videos.
Figure 7:
Figure 7:. Changing tag designs to improve classification accuracy.
(A) Tag design for P300 construct is kept fixed. (B) Five different tag designs for KDM5B created by splitting the tag, increasing or decreasing the amount of epitopes, or relocating the tag region to the 3’ end. (C) Accuracy for classification corresponding to each of the design combinations, and all assuming an elongation rate ratio of 1.46, under which the original design was non-classifiable (Figs 5D and 6D). All alternative designs would dramatically increase classification accuracy.
Figure 8:
Figure 8:. Accuracy of classifier when trained with incorrect parameter assumptions.
Accuracy versus the actual rates ke and ki when the model is exclusively trained on three specific, but possibly incorrect, sets of these parameters: (A) (ki = 0.02s−1, ke = 10.89aa/s), Average accuracy = 52.4%, (B) (ki = 0.09s−1, ke = 3.11aa/s), Average accuracy = 70.1%, (C) (ki = 0.07s−1, ke = 6.44aa/s), Average accuracy = 70.2%,
Figure 9:
Figure 9:. Simulated multiplexing of seven different mRNA species in a single cell.
Ten mRNAs each of RRAGC, LONRF2, MAP3K6, and DOCK8 with identical were simulated in the green channel, and ten mRNAs each of ORC2, TRIM33, and PHIP were simulated in the blue channel with our pipeline, and all with identical tag designs and parameters. Our architecture was modified for multiclass labeling, and a model was trained for the green and blue channel for artificial labeling of the example video. (A) Example frame from video classification with seven different mRNA transcript types. Incorrectly labeled spots are marked with an X (6/70 spots). Crops of example spots are show to the left. (B) Confusion matrices for the green and blue channels when tested on 50 cells containing 10 spots of each mRNA. (C) Accuracy of the classifier versus the fraction of low-confidence spots that is discarded. If one only considers the 50% most confident spots, then accuracy rises to 93.4% and 98.9% for the blue and green channels, respectively.

References

    1. Aguilera L. U., Raymond W., Fox Z. R., May M., Djokic E., Morisaki T., et al. (2019). Computational design and interpretation of single-rna translation experiments. PLoS computational biology 15, e1007425. doi:10.1371/journal.pcbi.1007425 - DOI - PMC - PubMed
    1. Allan D. B., Caswell T., Keim N. C., van der Wel C. M., and Verweij R. W. (2021). soft-matter/trackpy: Trackpy v0.5.0 doi:10.5281/zenodo.4682814 - DOI
    1. Aslam B., Basit M., Nisar M. A., Khurshid M., and Rasool M. H. (2017). Proteomics: Technologies and their applications. Journal of Chromatographic Science 55, 182–196. doi:10.1093/CHROMSCI/BMW167 - DOI - PubMed
    1. Basyuk E., Rage F., and Bertrand E. (2020). Rna transport from transcription to localized translation: a single molecule perspective. RNA Biology 18, 1221–1237. doi:10.1080/15476286.2020.1842631 - DOI - PMC - PubMed
    1. Bergstra J. and Bengio Y. (2012). Random search for hyper-parameter optimization yoshua bengio. Journal of Machine Learning Research 13, 281–305

Publication types