[Preprint]. 2023 Jan 29:2023.01.28.526036.
doi: 10.1101/2023.01.28.526036.

Therapy Development for Microvillus Inclusion Disease using Patient-derived Enteroids

Affiliations

Therapy Development for Microvillus Inclusion Disease using Patient-derived Enteroids

Meri Kalashyan et al. bioRxiv. .

Update in

Abstract

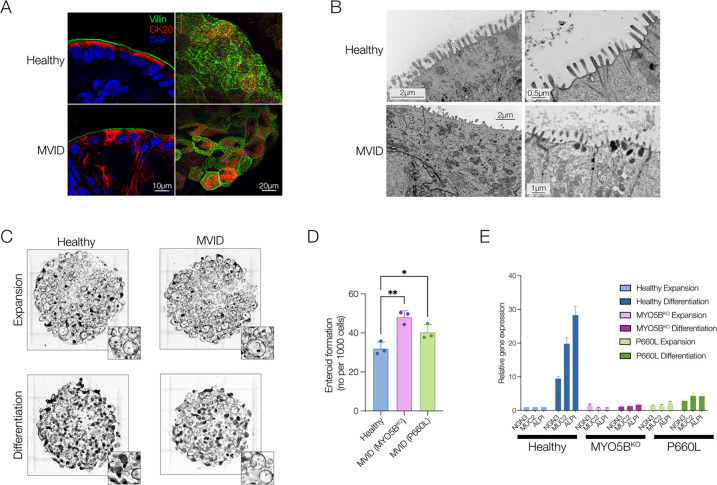
Microvillus Inclusion Disease (MVID), caused by loss-of-function mutations in the motor protein Myosin Vb (MYO5B), is a severe infantile disease characterized by diarrhea, malabsorption, and acid-base instability, requiring intensive parenteral support for nutritional and fluid management. Human patient-derived enteroids represent a model for investigation of monogenic epithelial disorders but are a rare resource from MVID patients. We developed human enteroids with different loss-of function MYO5B variants and showed that they recapitulated the structural changes found in native MVID enterocytes. Multiplex Immunofluorescence imaging of patient duodenal tissues revealed patient-specific changes in localization of brush border transporters. Functional analysis of electrolyte transport revealed profound loss of Na + /H + exchange (NHE) activity in MVID patient enteroids with near-normal chloride secretion. The chloride channel-blocking anti-diarrheal drug, Crofelemer, dose-dependently inhibited agonist-mediated fluid secretion. MVID enteroids exhibited altered differentiation and maturation versus healthy enteroids. Inhibition of Notch signaling with the γ-secretase inhibitor, DAPT, recovered apical brush border structure and functional Na + /H + exchange activity in MVID enteroids. Transcriptomic analysis revealed potential pathways involved in the rescue of MVID cells including serum- and glucocorticoid-induced protein kinase 2 (SGK2), and NHE regulatory factor 3 (NHERF3). These results demonstrate the utility of patient-derived enteroids for developing therapeutic approaches to MVID.

Conflict-of-interest statement: The authors have declared that no conflict of interest exists.


Conflict of interest statement

Conflict-of-interest statement: The authors have declared that no conflict of interest exists.

Figures

FIGURE 1:
FIGURE 1:. MVID enteroids recapitulate native epithelial disease changes.
A. Representative confocal images of Villin (green), Cytokeratin 20 (CK20, red) and nuclei (DAPI) of healthy and MVID (MYO5B KO) enteroids in cross-section (left) or en face (right). B. Representative electron micrographs of healthy and MVID enteroids. C. Brightfield images of enteroid cultures grown in expansion versus differentiation media. Inset images highlighting changes in cultures with increased spheroid (stem-like) morphology in MVID differentiated cultures versus healthy. D. Enteroid formation assay showing new enteroid formation (at 4 days post-plating) following enzymatic dissociation and replating. Error bars represent means ± SEM, n=3 experiments *p < 0.05, **p < 0.01. E. Relative gene expression (normalized to healthy expansion) for neurogenin 3 (NGN), mucin 2 (MUC2) and alkaline phosphatase (ALPI) in healthy and MVID enteroids following switching to enteroid differentiation media. Error bars represent means ± SEM, n=3 experiments.
FIGURE 2:
FIGURE 2:. Altered secretory cell populations in MVID patient tissues.
A. Immunofluorescence images of human duodenal biopsy sections stained for Chromogranin A (CGA), Defensin alpha 5 (DEFA5) and phospho-Epidermal Growth Factor Receptor (pEGFR). Graphs (right) shown whole biopsy counts of positive cells for each antigen. B. Representative images of CD10 and Epithelial Cell Adhesion Molecule (EPCAM). Graph (right) of continuity analysis (Feret’s Distance) of linear CD10 staining across all biopsy images.
FIGURE 3:
FIGURE 3:. Multiplex immunofluorescence highlights protein localization changes in patient tissues.
A. Multiplex Immunofluorescence panels representing 12 antigens on duodenal biopsy tissues. B. Cross-Correlation Matrices for paired antigens (Pearson’s Coefficient) with dot color indicating direction of correlation and dot size indicating extent of correlation. C. Individual pair-wise correlations for Na+/H+ exchanger 3 (NHE3) and Villin, Beta-catenin (BCAT) and Glucose transporter 2 (GLUT2), Sodium-Glucose Cotransporter 1 (SGLT1) and Villin, Myosin 5b (MYO5B) and NHE3. Inset example images showing staining patterns. Scale bar 10 μm.
FIGURE 4:
FIGURE 4:. Loss of sodium absorption and normal chloride secretion in MVID patient enteroids.
A. Transepithelial Resistance (TEER) on 10–14 days post plating on Transwell inserts for short-circuit current measurements. B. Glucose (20 mM)-stimulated, phlorizin-inhibitable short-circuit current (Isc) in healthy and MVID (MYO5B KO) monolayers. Error bars represent means ± SEM, n=3–4 experiments, *p < 0.05. C. Forkolin (10 μM) stimulated Isc. Error bars represent means ± SEM, n=3–4 experiments (left), Carbachol (CCh, 50 μM) stimulated Isc. Error bars represent means ± SEM, n=3–4 experiments (middle), Combined forskolin and Carbachol stimulated Isc. Error bars represent means ± SEM, n=3–4 experiments (right). D. % Carbachol (CCh, 50 μM) stimulated Isc not inhibited by CFTRinh-172 (50 μM) in healthy control cells grown from a young donor (2yo), adult donor (20yo) and MVID patient (MYO5B KO). E. Super-resolution images (STED) of NHE3 localization and abundance in healthy and MVID patient enteroids. F. Example curves showing change in pH calculated from analysis of intensity changes of SNARF-5F fluorescence in healthy and MVID cells and healthy cells after pre-treatment with the NHE3 inhibitor (10μM). G. Summary graph showing NHE3-dependent pH changes in healthy and MVID patient cells. Error bars represent means ± SEM, n=4–6 experiments, ***p < 0.001, ***p < 0.0001.
FIGURE 5:
FIGURE 5:. Crofelemer inhibits chloride and fluid secretion in MVID patient enteroids.
A. Representative curve showing dose dependent inhibition of Crofelemer on forskolin (10 μM)- and carbachol (CCh, 50μM)-stimulated Isc. B. Dose-response curve for Crofelemer-induced inhibition of forskolin and carbachol stimulated Isc in MVID patient enteroids (MYO5B KO). Error bars represent means ± SEM, n=6 experiments C. Maximal percent inhibition of agonist stimulated current by Crofelemer. Error bars represent means ± SEM, n=6 experiments. D. Example brightfield images before and after forskolin (2 μM) ± Crofelemer (200 μM) in MVID patient enteroids. Inset below showing enteroid swelling. E. Summary graph showing increase in enteroid size (diameter ratio) in healthy and MVID enteroids at 1 hour ± forskolin and ± Crofelemer (200μM). Error bars represent means ± SEM, >300 enteroids from 4 experiments. F. Diameter ratio in MVID enteroids at 2 and 4 hours post stimulation ± Crofelemer (200μM). Error bars represent means ± SEM n=3 experiments.
FIGURE 6:
FIGURE 6:. Notch inhibition rescues MVID patient enteroid differentiation.
A. Electron micrographs of healthy and MVID enteroids ± DAPT treatment (10 μM). B. Analysis of EM images of microvillus length. C. sub-apical actin bundle length. D. Distance of apical organelle free zone. Inset images above show example measured parameter. Graphs show measurements from at least 10 EM images. E. Super-resolution confocal images (STED) en-face (top) and cross-section (below) of NHE3 localization and abundance in healthy and MVID patient enteroids following treatment with DAPT (10 μM). Representative curves showing change in intracellular pH in healthy cells and MVID cells ± DAPT G. Summary graph showing NHE3-dependent pH changes in healthy and MVID patient cells ± DAPT. Error bars represent means ± SEM, n=4–6 experiments, *p < 0.05, **p < 0.01, ***p < 0.001, ***p < 0.0001.
FIGURE 7:
FIGURE 7:. Genome-wide transcriptomic analysis reveals potential targets for rescue of MVID enteroids.
A. Volcano plot showing log2 fold change and false discovery rate (FDR) showing genes with significantly up- and down-regulated expression (red) in healthy enteroids (n=3) following DAPT treatment (10 μM). B. Volcano plot showing genes with significantly up- and down-regulated expression (red) between healthy enteroids and MVID enteroids (MYO5B KO) (n=3). C. Volcano plot showing genes with significantly up- and down-regulated expression (red) in MVID enteroids (MYO5B KO) following DAPT treatment (10 μM). D. Plot of genes with significantly altered expression (green dots) between MVID and healthy against MVID + DAPT. Red dots indicate genes changing in opposite directions following DAPT treatment (filtered genes). E. Dot plot of filtered genes by change in expression and base mean expression, with dot size indicating fold change and color indicating FDR. Highlighted genes based on previous functional data indicating plausible biological role. F. Pathway analysis showing most significant GO terms, HPA terms and KEGG pathways.
FIGURE 8:
FIGURE 8:. Analysis of potential genes involved in DAPT-mediated rescue of MVID enteroids.
A. qPCR analysis showing relative gene expression (normalized to healthy untreated) for Serum- and glucocorticoid-induced protein kinase 2 (SGK2), Rab GTPase 32 (RAB32) and PDZ domain-containing 1 (PDZK1) in healthy and MVID enteroids ± DAPT (10 μM). Error bars represent means ± SEM, n=3 experiments. B. Immunoblot (top) of SGK2 protein changes ± DAPT with densitometric quantification (below) normalized to beta-actin. C. Summary graph showing NHE3-dependent pH changes in healthy and MVID patient enteroids ± DAPT (10 μM) or MVID patient enteroids ± DAPT and SGK inhibitor (GSK650394, 5 μM). Error bars represent means ± SEM, ****p < 0.0001.

References

    1. Müller T et al. MYO5B mutations cause microvillus inclusion disease and disrupt epithelial cell polarity. Nat Genet 2008;40(10):1163–1165. - PubMed
    1. van der Velde KJ et al. An overview and online registry of microvillus inclusion disease patients and their MYO5B mutations. Hum Mutat 2013;34(12):1597–1605. - PubMed
    1. Bowman DM, Kaji I, Goldenring JR. Altered MYO5B Function Underlies Microvillus Inclusion Disease: Opportunities for Intervention at a Cellular Level. Cell Mol Gastroenterol Hepatol 2022;14(3):553–565. - PMC - PubMed
    1. Babcock SJ, Flores-Marin D, Thiagarajah JR. The genetics of monogenic intestinal epithelial disorders [Internet]. Hum Genet [published online ahead of print: November 23, 2022]; doi:10.1007/s00439-022-02501-5 - DOI - PMC - PubMed
    1. Erickson RP, Larson-Thomé K, Valenzuela RK, Whitaker SE, Shub MD. Navajo microvillous inclusion disease is due to a mutation in MYO5B. Am. J. Med. Genet. A 2008;146A(24):3117–3119. - PubMed

Publication types