[Preprint]. 2023 Jan 23:2023.01.23.525260.
doi: 10.1101/2023.01.23.525260.

Autofluorescence lifetime imaging classifies human lymphocyte activation and subtype

Affiliations

Autofluorescence lifetime imaging classifies human lymphocyte activation and subtype

Rebecca L Schmitz et al. bioRxiv. .

Update in

  • Autofluorescence lifetime imaging classifies human B and NK cell activation state.
    Schmitz RL, Riendeau JM, Tweed KE, Rehani P, Samimi K, Pham DL, Jones I, Maly EM, Contreras Guzman E, Forsberg MH, Shahi A, Hockerman L, Ayuso JM, Capitini CM, Walsh AJ, Skala MC. Schmitz RL, et al. Front Bioeng Biotechnol. 2025 Apr 4;13:1557021. doi: 10.3389/fbioe.2025.1557021. eCollection 2025. Front Bioeng Biotechnol. 2025. PMID: 40256783 Free PMC article.

Abstract

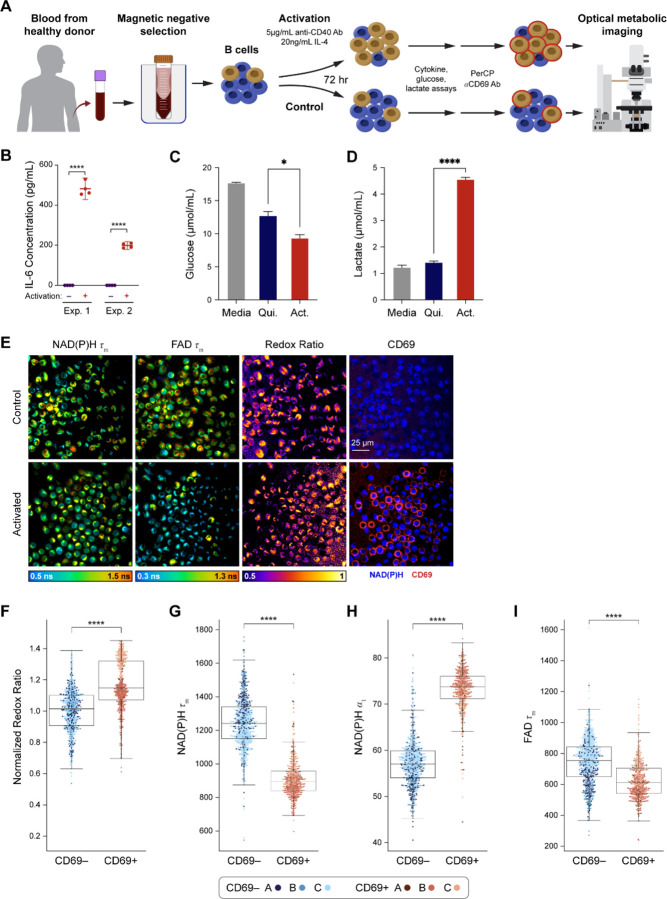
New non-destructive tools are needed to reliably assess lymphocyte function for immune profiling and adoptive cell therapy. Optical metabolic imaging (OMI) is a label-free method that measures the autofluorescence intensity and lifetime of metabolic cofactors NAD(P)H and FAD to quantify metabolism at a single-cell level. Here, we investigate whether OMI can resolve metabolic changes between human quiescent versus IL4/CD40 activated B cells and IL12/IL15/IL18 activated memory-like NK cells. We found that quiescent B and NK cells were more oxidized compared to activated cells. Additionally, the NAD(P)H mean fluorescence lifetime decreased and the fraction of unbound NAD(P)H increased in the activated B and NK cells compared to quiescent cells. Machine learning classified B cells and NK cells according to activation state (CD69+) based on OMI parameters with up to 93.4% and 92.6% accuracy, respectively. Leveraging our previously published OMI data from activated and quiescent T cells, we found that the NAD(P)H mean fluorescence lifetime increased in NK cells compared to T cells, and further increased in B cells compared to NK cells. Random forest models based on OMI classified lymphocytes according to subtype (B, NK, T cell) with 97.8% accuracy, and according to activation state (quiescent or activated) and subtype (B, NK, T cell) with 90.0% accuracy. Our results show that autofluorescence lifetime imaging can accurately assess lymphocyte activation and subtype in a label-free, non-destructive manner.

Keywords: B cells; NK cells; activation; autofluorescence imaging; lymphocytes.


Conflict of interest statement

Competing Interests: RLS, KS, ECG, AJW, and MCS are inventors on patent applications related to this work filed by Wisconsin Alumni Research Foundation (WO2020047133A1, filed on 2019–08-28; US20210049346A1, filed on 2020–08-13; US20210354143A1, filed on 2021–05-17). CMC receives honorarium for advisory board membership with Bayer, Elephas Bio, Nektar Therapeutics, Novartis and WiCell, who had no input in the study design, analysis, manuscript preparation or decision to submit for publication. All other authors declare they have no competing interests.

Figures

Figure 1.
Figure 1.. Optical metabolic imaging of primary human B cells activated with IL-4 and anti-CD40.
(A) B cells were isolated from human eral blood of three different donors and activated for 72 hours with 5 µg/mL anti-CD40 and 20 ng/mL IL-4, or cultured ulated. (B) IL-6 concentration was measured in media collected from B cells isolated from two different donors and cultured r without anti-CD40/IL-4 for 72 hours. The increase in IL-6 concentration in the activated B cell condition is consistent with T- pendent B cell activation. **** P < 0.0001, parametric T-test. (C) Samples of media from activated and quiescent B cells were before imaging and measured using commercial kits. Glucose in the media of activated B cells was significantly decreased ared to the quiescent cell media. (D) Lactate levels in activated B cell media were significantly higher than lactate levels in the ent cell media. (E) Representative images of NAD(P)H τm, FAD τm, redox ratio (NAD(P)H intensity divided by the sum of NAD(P)H AD intensity), and anti-CD69 staining in the unstimulated and activated conditions. (F) Redox ratio normalized to the mean of ntrol group significantly increased in the CD69+ B cells in the IL-4 + anti-CD40 condition compared to CD69- B cells in the ulated condition. (G) – (H) NAD(P)H τm significantly decreased and NAD(P)H α1 significantly increased in the CD69+ B cells in the anti-CD40 condition compared to CD69- B cells in the unstimulated condition. (I) A significant decrease in FAD τm was seen in 69+ B cells in the IL-4 + anti-CD40 condition compared to CD69- B cells in the unstimulated condition. In (C) – (D), media samples diluted 100-fold and 0.5μL was assayed. Assays were performed according to the respective BioVision kit protocols. * P < 0.05, < 0.0001, parametric T-test. In (F) – (I), data are displayed as box-and-whisker plots, representing the median and interquartile (IQR), with whiskers at 1.5*IQR. Plots are overlaid with data points; each point represents one cell. n = 1210 cells (461 cells in tivated CD69+ condition, 749 cells in the control CD69- condition). **** P < 0.0001, two-tailed unpaired T-test.
Figure 2.
Figure 2.. Heterogeneity and classification of activated and quiescent B cells using OMI parameters.
(A) Heatmap of single-cell data across all B cell experiments. Hierarchical cell clustering was calculated based on the z-scores (the difference between cell mean and population mean divided by the population standard deviation) of nine OMI variables (NAD(P)H τm, τ1, τ2, α1; FAD τm, τ1, τ2, α1; and control-normalized optical redox ratio). The single-cell clustering demonstrates that using all OMI variables, activated B cells tend to group separately from quiescent B cells regardless of donor. (B) UMAP of nine OMI parameters visualizes separation between clusters of activated (CD69+ in activated condition) and quiescent (CD69- in unstimulated condition) B cells. (C) Pie chart showing the relative weight of the nine OMI variables included in the “all variables” random forest classifier. (D) Receiver operating characteristic (ROC) curve of random forest classifiers trained for classification of quiescent and activated B cells on different combinations of OMI variables, with operating points indicated. “Top variables” classifiers refer to the largest weighted variables in the “all variable” classifier, found in (C). An area under the curve (AUC) of 0.98 is indicative of high performance of the “all variable” classifier and the NAD(P)H variables (NAD(P)H τm, τ1, τ2, α1) classifier. n = 1210 cells (461 cells in the activated CD69+ condition, 749 cells in the control CD69- condition) with a 70/30 split for training and test sets.
Figure 3.
Figure 3.. Optical metabolic imaging of primary human NK cells activated with IL-12, IL-15, and IL-18.
(A) NK cells were isolated from human peripheral blood of three different donors and activated with 10 ng/mL IL-12, 50 ng/mL IL-15, and 50 ng/mL IL-18 for 24 hours. (B) IFN-y concentration in media collected from NK-cells isolated from two different donors and cultured with or without activating cytokines for 24 hours. The increase of IFN-y in the activated condition is consistent with NK cell activation. **** P < 0.0001, parametric T-test. (C) Samples of media from activated and quiescent NK cells from two different donors were taken before imaging and measured using commercial kits. Glucose in the media of activated NK cells was significantly decreased compared to the quiescent cell media. (D) Lactate levels in activated NK cell media were significantly higher than lactate levels in the quiescent cell media. (E) Representative images of NAD(P)H τm, FAD τm, redox ratio, and anti-CD69 staining in the control and activated conditions. (F) Redox ratio significantly increased in the CD69+ NK cells in the cytokine-activated condition compared to CD69- NK cells in the unstimulated condition. (G) – (H) NAD(P)H τm significantly decreased, and FAD τm and NAD(P)H α1 significantly increased, in the CD69+ NK cells in the cytokine- activated condition compared to CD69- NK cells in the unstimulated condition. In (C) – (D), media samples were diluted 100-fold and 0.5μL was assayed. Assays were performed according to the respective BioVision kit protocols. *** P < 0.001, **** P < 0.0001, parametric T-test. In (F) – (I), data are displayed as box-and-whisker plots, representing the median and interquartile range (IQR), with whiskers at 1.5*IQR. Plots are overlaid with data points; each point represents one cell. n = 1221 cells (554 cells in the activated CD69+ condition, 667 cells in the control CD69- condition). **** P < 0.0001, two-tailed unpaired T-test.
Figure 4.
Figure 4.. Heterogeneity and classification of activated and quiescent NK cells using OMI parameters.
(A) Heatmap of single-cell data across all NK cell experiments reveals heterogeneity within the dataset. Hierarchical cell clustering was calculated on the z-scores (the difference between cell mean and population mean divided by the population standard deviation) of nine OMI variables (NAD(P)H τm, τ1, τ2, α1; FAD τm, τ1, τ2, α1; and control-normalized optical redox ratio). (B) UMAP of nine OMI parameters displays clustering of activated (CD69+ in activated condition) and quiescent (CD69- in unstimulated condition) NK cells. (C) Pie chart showing the relative weight of each of the nine OMI parameters in the “all variable” random forest classifier. (D) ROC curve of random forest classifiers trained for classification of quiescent and activated NK cells based on different combinations of OMI parameters, with operating points indicated. “Top variables” classifiers refer to the largest weighted OMI parameters in the classifier using all variables, displayed in (C). The classifier using the top four OMI parameters performed the best (AUC 0.97), followed by the classifier that used all 9 OMI parameters (AUC 0.96) and the classifier that used only NAD(P)H lifetime variables (NAD(P)H τm, τ1, τ2, α1) (AUC 0.96). n = 1221 cells (554 cells in the activated CD69+ condition, 667 cells in the control CD69- condition) with a 70/30 split for training and test sets.
Figure 5.
Figure 5.. Classification of lymphocyte activation status based on OMI parameters collected on B cells, NK cells, and T cells.
Data from activated and quiescent T cells, B cells, and NK cells was used to evaluate OMI measurements across lymphocytes. T cell data from our prior work (47) where T cells were activated with CD2/3/28 for 48h and imaged with OMI. (A) Box-and-whisker plots of key OMI variables (control-normalized optical redox ratio, NAD(P)H τm, and NAD(P)H α1) display consistent changes with activation across T cells, B cells, and NK cells. Additional changes were noted between quiescent (CD69- control) cells in each of the three lymphocyte subtypes (comparisons between quiescent groups were interpreted as not meaningful for the optical redox ratio, due to normalization). (B) Heatmap displaying hierarchical clustering of groups of activated or quiescent cells by lymphocyte subtype, donor, and activation status, calculated from the z-scores (the difference between experimental group mean and the mean of all cells divided by the standard deviation of all cells) of nine OMI variables. (C) UMAP of single-cell OMI data displays distinct clusters of lymphocytes based on lymphocyte subtype and activation status. (D) ROC curves of random forest classifiers trained to identify activated cells across all three lymphocyte subtypes, with operating points indicated. The highest weighted OMI parameters were used in the “top variables” classifiers; these weights are in Supp. Fig. 5C. (E) Accuracy of different random forest classifiers trained to identify lymphocyte subtype (one vs one approach). Variable weights for “top variables” are in Supp. Fig. 6B. (F) Accuracy of random forest classifiers trained to identify lymphocyte subtype and activation across all three lymphocyte subtypes (one vs. one approach) using different OMI parameters. Variable weights are in Supp. Fig. 8B. n = 3127 cells (749 CD69- control B cells, 461 CD69+ activated B cells, 667 CD69- control NK cells, 554 CD69+ activated NK cells, 331 CD69- control T cells, 365 CD69+ activated T cells) with a 50/50 split for training and test sets. **** P < 0.0001, Kruskal-Wallis with post-hoc comparisons. ns = not significant.

References

    1. Omman R. A., Kini A. R., “9 - Leukocyte development, kinetics, and functions” in Rodak’s Hematology (Sixth Edition), Keohane E. M., Otto C. N., Walenga J. M., Eds. (Elsevier, St. Louis (MO), 2020; https://www.sciencedirect.com/science/article/pii/B9780323530453000180), pp. 117–135.
    1. Weber E. W., Maus M. V., Mackall C. L., The Emerging Landscape of Immune Cell Therapies. Cell. 181, 46–62 (2020). - PMC - PubMed
    1. Vivier E., Tomasello E., Baratin M., Walzer T., Ugolini S., Functions of natural killer cells. Nat. Immunol. 9, 503–510 (2008). - PubMed
    1. Hu W., Wang G., Huang D., Sui M., Xu Y., Cancer Immunotherapy Based on Natural Killer Cells: Current Progress and New Opportunities. Front. Immunol. 10, 1205 (2019). - PMC - PubMed
    1. Romee R., Rosario M., Berrien-Elliott M. M., Wagner J. A., Jewell B. A., Schappe T., Leong J. W., Abdel-Latif S., Schneider S. E., Willey S., Cytokine-induced memory-like natural killer cells exhibit enhanced responses against myeloid leukemia. Sci. Transl. Med. 8, 357ra123–357ra123 (2016). - PMC - PubMed

Publication types