[Preprint]. 2023 Jan 26:2023.01.25.525425.
doi: 10.1101/2023.01.25.525425.

Hacking brain development to test models of sensory coding

Affiliations

Hacking brain development to test models of sensory coding

Maria Ahmed et al. bioRxiv. .

Abstract

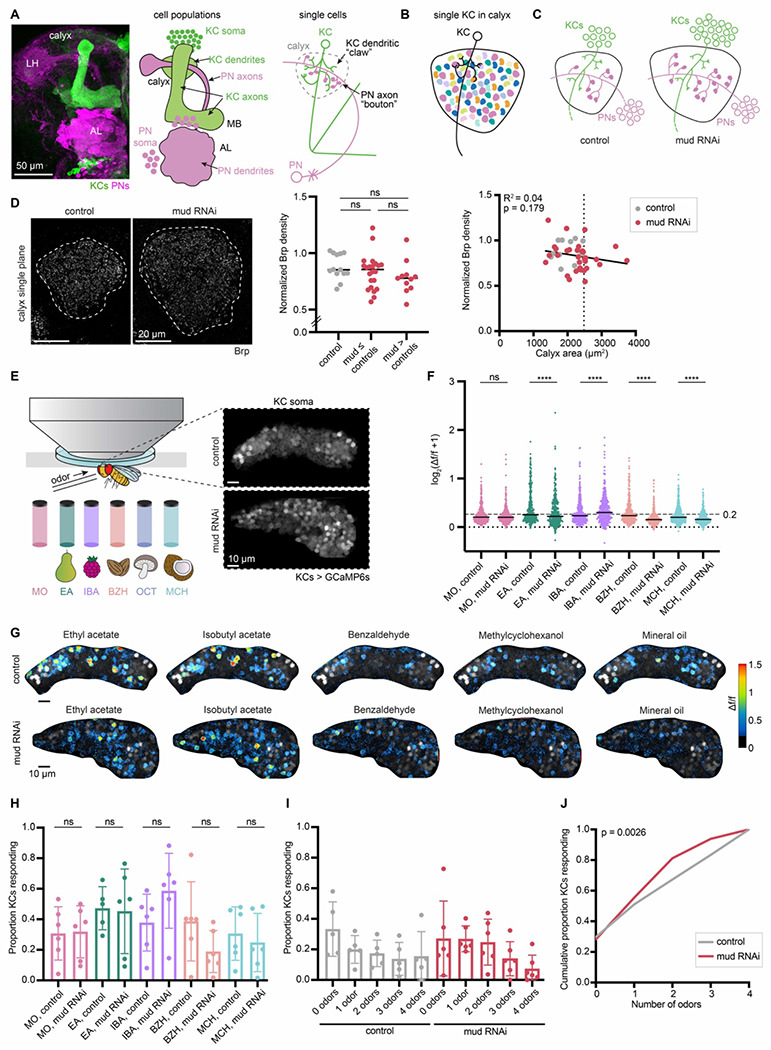
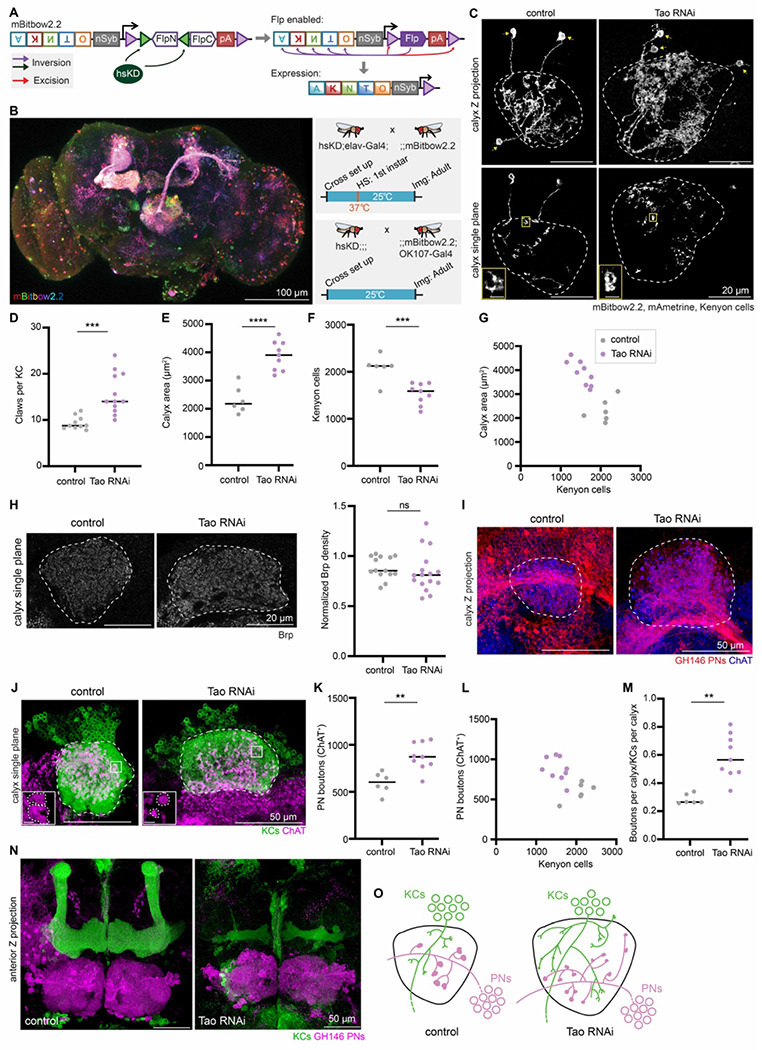
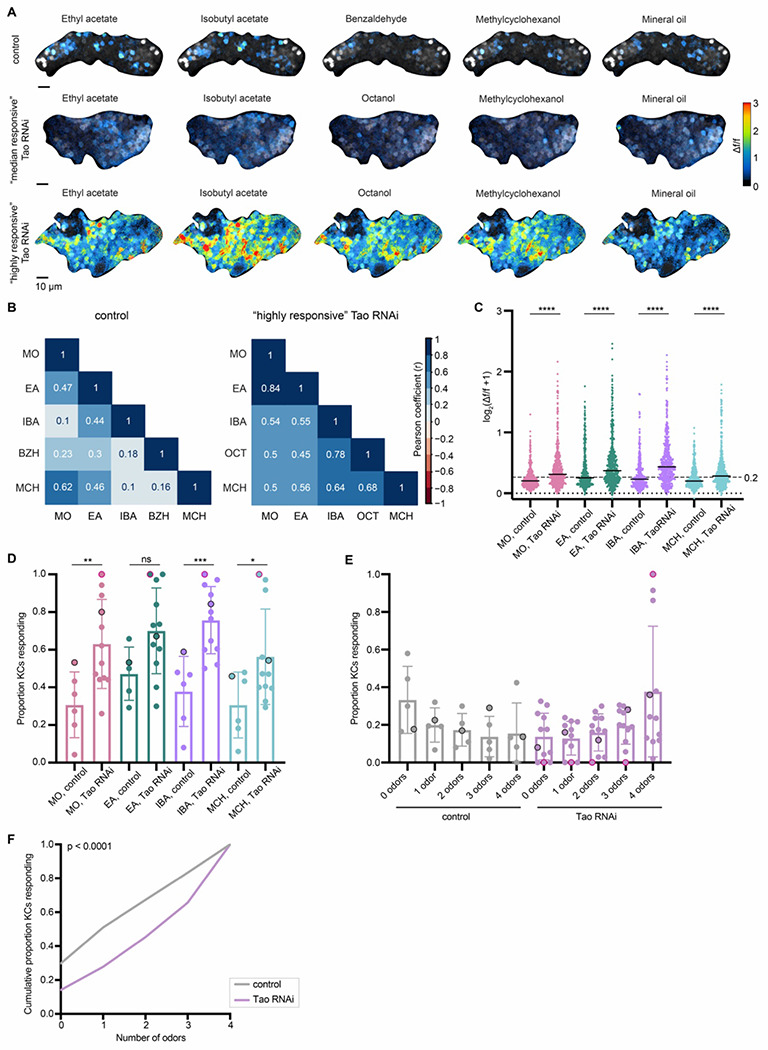
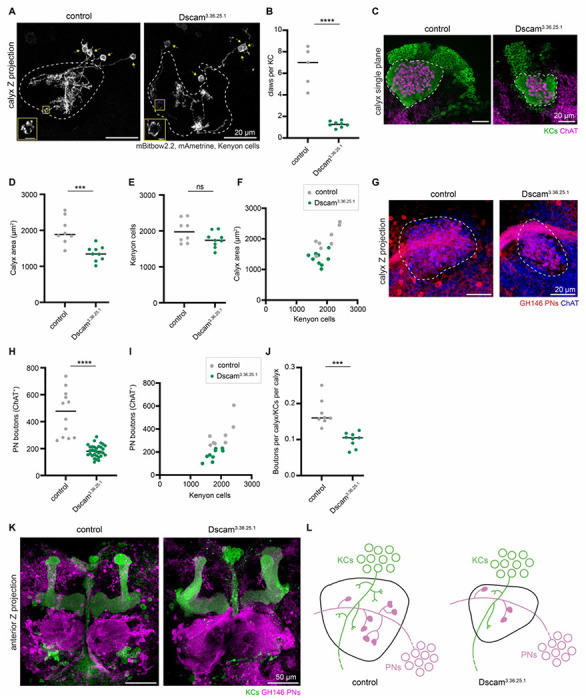
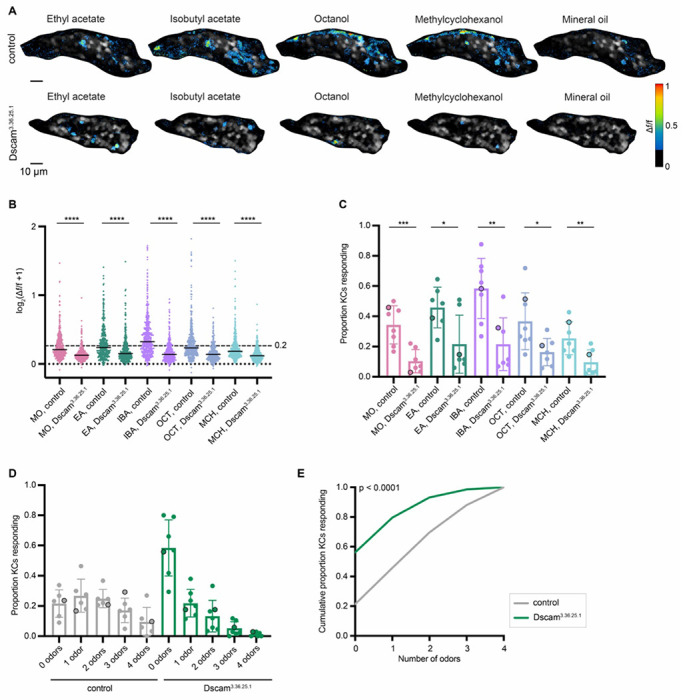
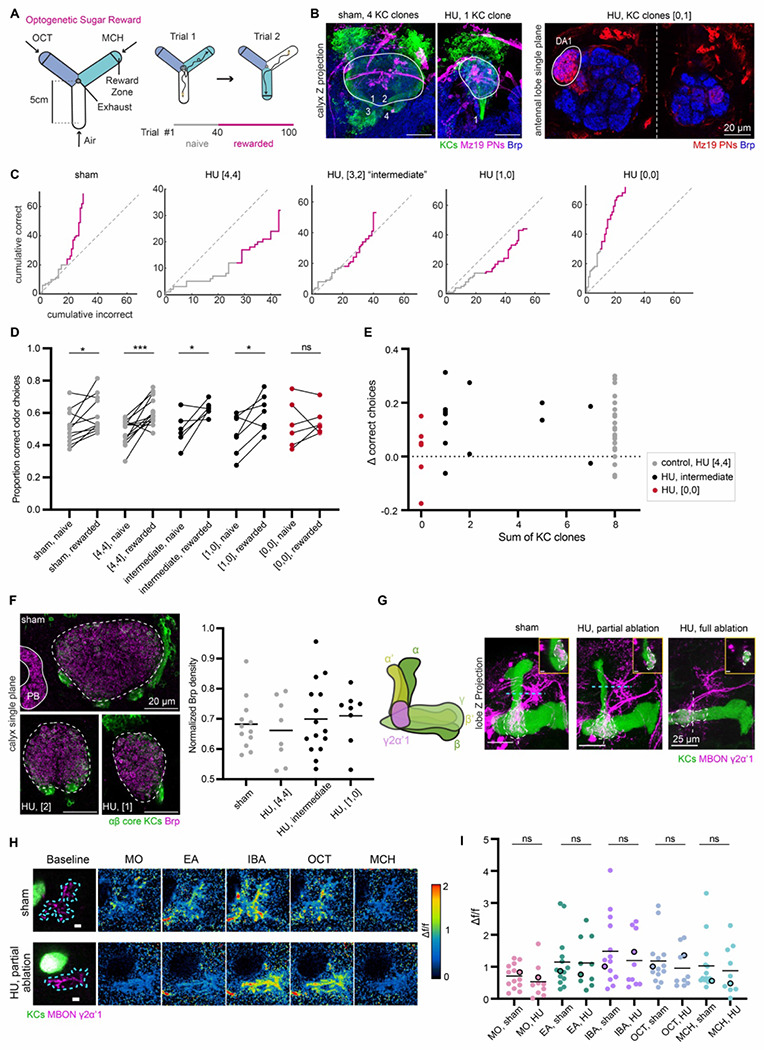
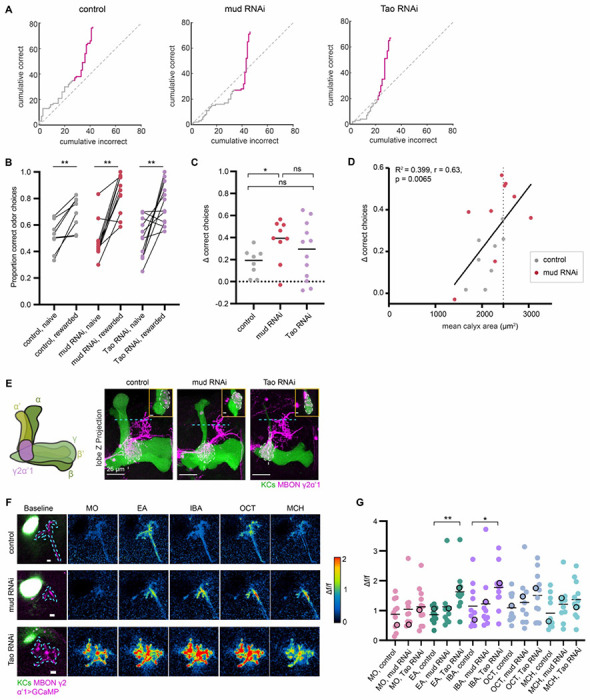
Animals can discriminate myriad sensory stimuli but can also generalize from learned experience. You can probably distinguish the favorite teas of your colleagues while still recognizing that all tea pales in comparison to coffee. Tradeoffs between detection, discrimination, and generalization are inherent at every layer of sensory processing. During development, specific quantitative parameters are wired into perceptual circuits and set the playing field on which plasticity mechanisms play out. A primary goal of systems neuroscience is to understand how material properties of a circuit define the logical operations-computations--that it makes, and what good these computations are for survival. A cardinal method in biology-and the mechanism of evolution--is to change a unit or variable within a system and ask how this affects organismal function. Here, we make use of our knowledge of developmental wiring mechanisms to modify hard-wired circuit parameters in the Drosophila melanogaster mushroom body and assess the functional and behavioral consequences. By altering the number of expansion layer neurons (Kenyon cells) and their dendritic complexity, we find that input number, but not cell number, tunes odor selectivity. Simple odor discrimination performance is maintained when Kenyon cell number is reduced and augmented by Kenyon cell expansion.


Figures

Figure 1.
Figure 1.. Sparse odor coding is preserved when Kenyon cell numbers are increased.
(A) Image (left) and models (right) of olfactory projection neurons (PNs) and Kenyon cells (KCs) in the adult fly brain at the population level and single cell level. PNs (pink) receive input from olfactory sensory neurons in the antennal lobe (AL) and project to the mushroom body calyx and the lateral horn (LH). In the calyx, KCs (green) form dendritic “claws” that grab onto output sites of PNs called axon “boutons”. (B) An individual KC receives input from an average of 5-6 PNs. The different colors of boutons indicate PN types receiving input from different glomeruli. (C) Model of the effect of increasing KC numbers on calyx development. PNs increase bouton numbers to match the increase in KCs, while KCs maintain the same number of dendritic claws per cell. PN number is unchanged. (D) Left: Confocal slice of Brp signal in control calyx and OK107>mud RNAi calyx; maximum cross-sectional area is circled. Middle: Quantification of Brp density, normalized to fluorescence in an unmanipulated brain region, the protocerebral bridge. Significance: unpaired t-test for each pairwise comparison. Right: The relation of normalized Brp density to maximum cross-sectional area of calyx. Dotted line represents the calyx area cut-off to define Kenyon cell-increased mud RNAi brains (“mud > controls”). Each data point represents a single hemisphere. (E) Schematic of preparation used for in vivo functional imaging in an adult fly. Odor vials for the mechanosensory control (mineral oil; MO) and odors used, along with their smells, are shown below: ethyl acetate (EA), isobutyl acetate (IBA), benzaldehyde (BZH), octanol (OCT), and methylcyclohexanol (MCH). Responses were imaged from KC soma by GCaMP6s expression; example images of a control KC soma cloud, and mud RNAi, expanded KC cloud are shown. (F) Peak odor responses of all cells plotted on a log scale, aggregated from all six analyzed hemispheres of each condition. Dashed line indicates 20% Δf/f threshold. Dotted line indicates Δf/f = 0. Black horizontal bars show medians. Significance: Mann-Whitney test between control and mud RNAi for each stimulus. Here and throughout, *: p<0.05, **: p<0.01, ***: p<0.001, ****: p<0.0001, ns: non-significant. n = 349-405 cells (control), n = 341 cells (mud RNAi) for each odor. (G) Representative images of KC somatic odor responses in control hemisphere and increased-KC mud RNAi hemisphere. Grayscale backdrop indicates the cells, Δf/f scale is shown such that all cells with responses < 0.2 are colored black, responses > 1.5 are colored red. See also Figure S1A. (H) Proportion of cells in each sample responding to each odor, and mineral oil above 0.2 Δf/f threshold. Significance: unpaired t-test. (I) For samples in which the same cells could be tracked across all odor presentations, proportion of cells responding to 0, 1, or multiple odors is shown. Bar plots in (H, I) show mean ± SD, and black circled points highlight the particular hemispheres shown in (G). See also Figure S1B. (J) Cumulative proportion of cells responding from 0 up to 4 odors. Lines represent mean of all control (gray; n = 349) and increased-KC mud RNAi cells (red; n = 341). Significance: Kruskal-Wallis test; K-S distance=0.139.
Figure 2.
Figure 2.. Knocking down Tao in Kenyon cells increases dendritic claws per cell and projection neuron bouton production.
(A) Schematic of mBitbow2.2 design. mBitbow2.2 transgene contains two parts: a membrane-labeling mBitbow1.0 (Li et al., 2021) and a KD-controlled, self-excising flippase (KDonFlp) under the control of n-Synaptobrevin (nSyb) promoter. In the presence of KD, the N-terminal portion of flippase will be inverted to the correct orientation, hence enabling the expression of flippase under nSyb control in mature neurons. Similar to the mBitbow2.1 design, the flippase will initiate a Bitbow combination. Flippase can also excise itself, preventing sustained recombinations. The five fluorescent proteins shown are mAmetrine (A), tdKatushka2 (K), mNeonGreen (N), mTFP1 (T), and mKO2 (O). Detailed schematic is shown in Figure S2A. (B) Left: A representative adult brain Z-projection demonstrating dense mBitbow2.2 labeling in neurons. Top right: To produce dense labeling, progeny of the hsKD;elav-Gal4;; and ;;mBitbow2.2; flies are collected and heat shocked at 1st instar larval stage at 37°C for 30 mins. Neurons labeled in diverse colors can be observed throughout the adult brain, with prominent neuropils evident, such as the mushroom body and projection neuron tracts from the antennal lobe. Bottom right: For sparse Kenyon cell labeling, hsKD;;; flies were crossed with ;;mBitbow2.2; OK107-Gal4. No heat shock was given. Crosses were housed at 25°C throughout. (C) Example images of sparsely labeled KCs in control and KC>Tao RNAi calyces: maximum Z-projection (top), single confocal slice (bottom). Dashed lines outline the calyx, and arrows mark the KC soma. In the examples shown, 3 KCs are labeled by mBitbow2.2 (mAmetrine shown). Insets zoom in on a single claw structure from the yellow boxed region in the corresponding image. Scale bar for inset: 2mm. See also Figure S2B. (D) Number of dendritic claws per Kenyon cell in control (gray) and KC>Tao RNAi (purple) hemispheres. Each data point represents a single hemisphere throughout this figure. (E-G) Maximum calyx cross-sectional area (E), number of KCs (F), and the relationship between KC number and maximum calyx cross-sectional area (G) in control (gray) and KC>Tao RNAi hemispheres (purple). (H) Left: Confocal slice showing Brp signal and maximum cross-sectional area (circled) of control and KC>Tao RNAi calyces. Right: Quantification of Brp density, normalized to fluorescence in an unaffected brain region, the protocerebral bridge. (I) Maximum intensity projection of confocal stack of calyx bouton production by GH146+ PNs (red) in control and KC>Tao RNAi hemispheres. ChAT immunostaining (blue) indicates calyx extent. (J) Confocal slice of control calyx and KC>Tao RNAi calyx. OK107 labels KCs (green) and ChAT labels projection neuron boutons (magenta). Representative images selected with median number of boutons from each condition, and image slice chosen to show the middle plane of boutons. Dashed lines outline the calyx. Inset zooms in on the bouton morphology differences from the boxed region in the image. Scale bar for inset: 2 μm. (K-M) PN bouton number (K, L), and ratio of ChAT+ boutons per calyx versus KCs per calyx (M) in control (gray) and KC>Tao RNAi hemispheres (purple). (N) Maximum intensity projection of confocal stacks taken from anterior side of control and KC>Tao RNAi brains. KCs (green) show mushroom body lobes. GH146+ PNs (magenta) show antennal lobe and PN cell bodies. (O) Model of the effect of increasing the number of dendritic claws per Kenyon cell. Tao RNAi KC dendrites spread out further than controls. PN bouton production increases, boutons appear smaller, and the PN tract shifts ventrally. Throughout the figure, significance: unpaired t-test, black horizontal bars represent median.
Figure 3.
Figure 3.. Odor selectivity is reduced in Kenyon cells with increased dendritic claw numbers.
(A) Example KC somatic odor responses in control hemisphere and KC>Tao RNAi (increased dendrite condition) hemispheres with median levels of odor responses, and high levels of odor responses. Grayscale backdrop indicates the cells. Δf/f scale is shown such that all cells with responses < 0.2 are colored black, responses > 3 are colored red. Control dataset shown throughout this figure are the same data as controls for mud RNAi condition in Figure 1, and the sample shown in (A) is the same sample shown in Figure 1G. In Tao RNAi animals, benzaldehyde was switched with octanol due to a crystallization issue with benzaldehyde in the olfactometer. Further discussion is provided in the methods. See also Figure S3 for odor response traces over time for the control and “highly responsive” Tao RNAi images. (B) Pearson correlation matrix (half diagonal displayed) show the linear relation between each pairwise odor comparison across the cells for the control and “highly responsive” KC>Tao RNAi image shown in A. Correlation value (r) can fall in a range of −1 (dark red) to +1 (dark blue). However, we did not observe any negative correlations in this analysis. (C) Peak odor responses of all cells, aggregated from all analyzed samples. Y axis displays log2-scaled Δf/f values. Dashed line indicates 0.2 Δf/f threshold. Dotted line indicates Δf/f = 0. Black horizontal bars show medians. Significance: Mann-Whitney test. n=349-404 control cells, 496 Tao RNAi cells for each odor. (D) Proportion of cells in each sample responding to each odor above 0.2 Δf/f threshold. Significance: unpaired t-test. (E) For samples in which the same cells could be tracked across all odor presentations, proportion of cells responding to 0, 1, or multiple odors is shown. Bar plots in (D,E) show mean ± SD, and black circled data points correspond to the control, and “median responsive” Tao RNAi images shown in (A). Red circled data points correspond to the “highly responsive” Tao RNAi image in (A). (F) Cumulative proportion of cells responding from 0 up to 4 odors. Lines represent mean of all control (gray; n = 349) and Tao RNAi cells (purple; n = 496). Significance: Kruskal-Wallis test; K-S distance = 0.2318.
Figure 4.
Figure 4.. Overexpressing dendritically-targeted Dscam1 in Kenyon cells decreases dendritic claws per cell.
(A) Example maximum intensity Z-projections of sparsely labeled KCs in control and KC>Dscam3.36.25.1 (Dscam1[TM1]) calyces. Dashed lines outline the calyx, and arrows mark the KC soma. KCs labeled by mBitbow2.2 (mAmetrine shown). Insets zoom in on claw structure from the yellow boxed region in the corresponding image, with brightness increased for visualization. Scale bar for inset: 2μm. (B) Number of dendritic claws per KC in control (gray) and KC>Dscam3.36.25.1 (green) hemispheres. (C) Confocal slice of control calyx and KC>Dscam3.36.25.1 calyx. OK107 labels KCs (green) and ChAT labels projection neuron boutons (magenta). Representative images selected with median number of boutons from each condition, and image slice chosen to show a middle plane of boutons. Dashed lines outline the calyx. (D-F) Maximum calyx cross-sectional area (D), number of KCs (E), and the relationship between KC number and maximum calyx cross-sectional area (F) in control (gray) and KC>Dscam3.36.25.1 hemispheres (green). (G) Maximum intensity projection of confocal stack of calyx bouton production by GH146+ PNs (red) in control and KC>Dscam3.36.25.1 hemispheres. ChAT immunostaining (blue) highlights calyx extent (circled). (H-J) PN bouton number (H,I), and ratio of ChAT+ boutons per KC (J) in control (gray) and KC>Dscam3.36.25.1 hemispheres (green). (K) Maximum intensity projection of confocal stacks taken from anterior side of control and KC>Dscam3.36.25.1 brains. KCs (green) show the mushroom body lobes, GH146+ PNs (magenta) show the antennal lobe and PN cell bodies. (L) Model of the effect of decreasing KC dendritic claws per cell. PN bouton production decreases, and the PN tract shifts dorsally. Throughout this figure, significance: unpaired t-test, and black horizontal bars indicate the median.
Figure 5.
Figure 5.. Kenyon cells with reduced claw numbers are less responsive to odors.
(A) Example KC somatic odor responses in control hemisphere and KC>Dscam3.36.25.1 (decreased dendrite condition) hemisphere. Grayscale indicates the cells. Δf/f scale is shown such that all cells with responses < 0.2 are colored black, responses > 1 are colored red. See also Figure S5 for odor response traces over time for this image. (B) Peak odor responses of all cells, aggregated from all analyzed samples. Y axis displays log2-scaled Δf/f values. Dashed line indicates 0.2 Δf/f threshold. Dotted line indicates Δf/f = 0. Black horizontal bars show medians. Significance: Mann-Whitney test. n = 380-428 control cells, 372 Dscam3.36.25.1 cells for each odor. (C) Proportion of cells in each sample responding to each odor above 0.2 Δf/f threshold. Significance: unpaired t-test. (D) For samples in which the same cells could be tracked across all odor presentations, fraction of cells responding to 0, 1, or multiple odors is shown. Bar plots in (C,D) show mean ± SD, and black circled data points correspond to the images shown in (A). (E) Cumulative proportion of cells responding from 0 up to 4 odors. Lines represent mean of all control (gray; n = 369) and Dscam3.36.25.1 cells (green; n = 338). Significance: Kruskal-Wallis test; K-S distance = 0.348.
Figure 6.
Figure 6.. Animals with reduced numbers of Kenyon cells exhibit normal behavioral and feed-forward functional responses
(A) Schematic of Y-arena for single fly learning experiments (left). Airflow travels from tips of each arm to an outlet in the center. Reward zones are indicated by lines on the schematic, but are not visible to the fly. A choice is considered to have been made when a fly crosses from an air arm into the reward zone of an odorized arm, triggering delivery of an optogenetic reward with a 500 ms pulse of red light. The next trial then commences as the choice arm switches to air and the two odors (represented with two different colors for octanol and methylcyclohexanol) are randomly reassigned to the other two arms (right). Naïve (1-40) and rewarded trials (41-100) are indicated below. (B) Left: Maximum intensity projections of confocal stacks of calyces of sham-treated and HU-treated animals. 58F02 labels αβ core KCs (green). Mz19 labels a subset of ~16 PNs (magenta). Brp (blue) is included as a neuropil marker. Calyx is outlined in white. The 58F02 signal allows scoring of the number of KC clones. Numbers (1 through 4 in sham, 1 in HU-treated calyx) are shown to illustrate the number of neurite bundles innervating the pedunculus when traced through the stack. Right: Single confocal slice of the left and right antennal lobe from a HU-treated brain that has 1 KC clone in the left hemisphere, and no clones on the right side. Dotted line indicates the midline of the central brain. Mz19 labels the DA1 glomerulus (encircled in white), allowing scoring of the lNB/BAlc PN neuroblast. The lNB/BAlc PN neuroblast is ablated in the right hemisphere and DA1 glomerulus is lost. (C) Learning curves (gray lines) of individual flies from each condition are plotted to show cumulative correct (rewarded) odor choices and incorrect (unrewarded) odor choices across all 100 trials. Some flies were tested with a different number of trials, e.g. the HU, “[4,4]” fly shown here; details of the behavior protocol are explained in the Methods section. Naïve (gray line) and rewarded (pink line) trials are indicated. Gray dotted line displays y=x line through the origin, indicating equal preference for the two odors. (D) Proportion of correct odor choices made in naïve and rewarded trials; learning is indicated if the number of trials with correct odor choices is higher in the rewarded trials than in naïve trials. Each data point is an individual fly. Sham-treated animals, and HU-treated animals with “[4,4]” KC clones are displayed in gray, while intermediate HU-treated clone numbers are shown in black, and fully ablated “[0,0]” HU-treated animals are shown in red. Jitter added in this plot and (E) to display all the data points. Significance: paired t-test. See also Figure S6B. (E) Relationship between Δ correct choices (difference in correct choices made in rewarded vs naïve trails) and sum of KC clones from both hemispheres (range of 0-8). No correlation was observed. See Figure S6C–D for relation with lNB/BAlc ablation. (F) Left: Confocal slice with maximum calyx cross-sectional area of sham and HU-treated calyces (bottom left: 2 KC clones, bottom right: 1 KC clone). Dashed lines outline the calyx. Part of the normalization structure, protocerebral bridge (PB) is included in the sham image. Right: Quantification of Bruchpilot density, normalized to fluorescence in PB. Black bars represent medians. All pairwise comparisons are non-significant by unpaired t-test. See also Figure S6E. (G) Left: Schematic of the mushroom body lobe anatomy with KCs in green and MBONs γ2α′1 in magenta. The different shades of green represent distinct MB lobes named due to KC axonal morphology differences. Dendrites of MBONs γ2α′1 in the lobe compartment are shown. Right: Maximum intensity projections of confocal stack of MB lobe with KCs (green) and γ2α′1 MBON (magenta) labeled in sham; HU-treated: partially ablated; and HU-treated: fully ablated animals. In each image, the MBON compartment is circled with a dashed line. Inset shows the lateral view of the MBON compartment. Scale bar for inset: 5 μm. Corresponding location is indicated by white dashed vertical line. Blue dashed line indicates the focal plane for calcium imaging of MBON axonal terminals in (H, I). See also Figure S6A for effect on arborization of PAM-DANs in the mushroom body lobes. (H) Example γ2α′1 MBON axonal odor responses in sham hemisphere and HU-treated: partially ablated hemisphere. Left: Focal plane of KC vertical lobe (green) and resting GCaMP6s signal in MBON axonal terminals (magenta). Blue dashes outline the ROI used to measure odor responses. Scale bar: 5 μm. Right: Responses to odors in Δf/f. Δf/f scale is shown such that all pixels with responses < 0 are colored black, responses > 2 are colored red. (I) Peak odor responses of all MBON axonal ROIs. Each dot is one hemisphere. For HU-treated: partially ablated hemispheres, only hemispheres with maximum cross-sectional calyx area less than every control (< 2100 μm2) are included (Figure S6G). Black horizontal bars show mean peak odor responses. Significance: unpaired t-test. Black circled data points correspond to samples shown in (H). Average traces of odor responses can be found in Figure S6F.
Figure 7.
Figure 7.. Effect of increased Kenyon cell number or claw number on associative learning and feedforward functional responses
(A) Learning curves (gray lines) of individual flies from control, KC>mud RNAi, and KC>Tao RNAi are plotted to show cumulative correct and incorrect odor choices across all trials. Naïve (gray line) and rewarded (pink line) trials are indicated. Flies were either tested with 40 or 60 naïve and rewarded trials each (details explained in Methods). Gray dotted line displays y=x line through the origin. (B) Proportion of correct odor choices made in naïve and rewarded trials, in control (gray), KC>mud RNAi (red), and KC>Tao RNAi (purple) animals. Each data point is an individual fly. Jitter added in this plot and (C) to display all the data points. Significance: paired t-test. (C) Δ correct choices (difference in correct choices made in rewarded vs naïve trails) in control (gray), KC>mud RNAi (red), and KC>Tao RNAi (purple) animals. Dotted line at y = 0 indicates no change in odor preferences. Significance: unpaired t-test. (D) Δ correct choices plotted against mean calyx area for each animal in control and KC>mud RNAi conditions. Black line represents linear fitted line. Dotted line represents the largest control calyx. (E) Maximum intensity projections of confocal stack of MB lobe with KCs (green) and MBONs γ2α′1 (magenta) labeled in control, mud RNAi and Tao RNAi animals. In each image, the MBON compartment is circled with a dashed line. Inset shows the lateral view of the MBON compartment at the location of the white dashed vertical line (inset scale bar: 5 μm). Blue dashed line indicates the focal plane for calcium imaging of MBON axonal terminals in (F, G). (F) Example MBON axonal odor responses in control, mud RNAi and Tao RNAi animals. Left: Focal plane of KC vertical lobe (green) and resting GCaMP6s signal in MBON axonal terminals (magenta). Blue dashes outline the ROI used to measure odor responses. Scale bar: 5 μm. Right: Responses to odors in Δf/f. Δf/f scale is shown such that all pixels with responses < 0 are colored black, responses > 2 are colored red. (G) Peak odor responses of all MBON axonal ROIs for the three conditions; each dot is one hemisphere. For mud RNAi hemispheres, only hemispheres greater than every control (maximum cross-sectional calyx area > 2200 μm2) are included (Figure S7B). Black horizontal bars show mean peak responses. Significance: Peak odor responses of mud RNAi and Tao RNAi are compared with control using unpaired t-tests. Non-significant comparisons are not shown. Black circled data points correspond to responses from the images in (F). Average traces of odor responses can be found in Figure S7A.

Similar articles

References

    1. Akerboom J., Chen T.-W., Wardill T.J., Tian L., Marvin J.S., Mutlu S., Calderón N.C., Esposti F., Borghuis B.G., Sun X.R., Gordus A., Orger M.B., Portugues R., Engert F., Macklin J.J., Filosa A., Aggarwal A., Kerr R.A., Takagi R., Kracun S., Shigetomi E., Khakh B.S., Baier H., Lagnado L., Wang S.S.-H., Bargmann C.I., Kimmel B.E., Jayaraman V., Svoboda K., Kim D.S., Schreiter E.R., Looger L.L., 2012. Optimization of a GCaMP calcium indicator for neural activity imaging. J. Neurosci. 32, 13819–13840. 10.1523/JNEUROSCI.2601-12.2012 - DOI - PMC - PubMed
    1. Albus J.S., 1971. A theory of cerebellar function. Mathematical Biosciences 10, 25–61. 10.1016/0025-5564(71)90051-4 - DOI
    1. Amin H., Apostolopoulou A.A., Suárez-Grimalt R., Vrontou E., Lin A.C., 2020. Localized inhibition in the Drosophila mushroom body. eLife 9, e56954. 10.7554/eLife.56954 - DOI - PMC - PubMed
    1. Apostolopoulou A.A., Lin A.C., 2020. Mechanisms underlying homeostatic plasticity in the Drosophila mushroom body in vivo. Proceedings of the National Academy of Sciences 117, 16606–16615. 10.1073/pnas.1921294117 - DOI - PMC - PubMed
    1. Armstrong J.D., de Belle J.S., Wang Z., Kaiser K., 1998. Metamorphosis of the Mushroom Bodies; Large-Scale Rearrangements of the Neural Substrates for Associative Learning and Memory in Drosophila. Learn Mem 5, 102–114. - PMC - PubMed

Publication types