[Preprint]. 2023 Jan 23:2023.01.23.525210.
doi: 10.1101/2023.01.23.525210.

Combined KRASG12C and SOS1 inhibition enhances and extends the anti-tumor response in KRASG12C-driven cancers by addressing intrinsic and acquired resistance

Affiliations

Combined KRASG12C and SOS1 inhibition enhances and extends the anti-tumor response in KRASG12C-driven cancers by addressing intrinsic and acquired resistance

Venu Thatikonda et al. bioRxiv. .

Update in

  • Co-targeting SOS1 enhances the antitumor effects of KRASG12C inhibitors by addressing intrinsic and acquired resistance.
    Thatikonda V, Lyu H, Jurado S, Kostyrko K, Bristow CA, Albrecht C, Alpar D, Arnhof H, Bergner O, Bosch K, Feng N, Gao S, Gerlach D, Gmachl M, Hinkel M, Lieb S, Jeschko A, Machado AA, Madensky T, Marszalek ED, Mahendra M, Melo-Zainzinger G, Molkentine JM, Jaeger PA, Peng DH, Schenk RL, Sorokin A, Strauss S, Trapani F, Kopetz S, Vellano CP, Petronczki M, Kraut N, Heffernan TP, Marszalek JR, Pearson M, Waizenegger IC, Hofmann MH. Thatikonda V, et al. Nat Cancer. 2024 Sep;5(9):1352-1370. doi: 10.1038/s43018-024-00800-6. Epub 2024 Aug 5. Nat Cancer. 2024. PMID: 39103541 Free PMC article.

Abstract

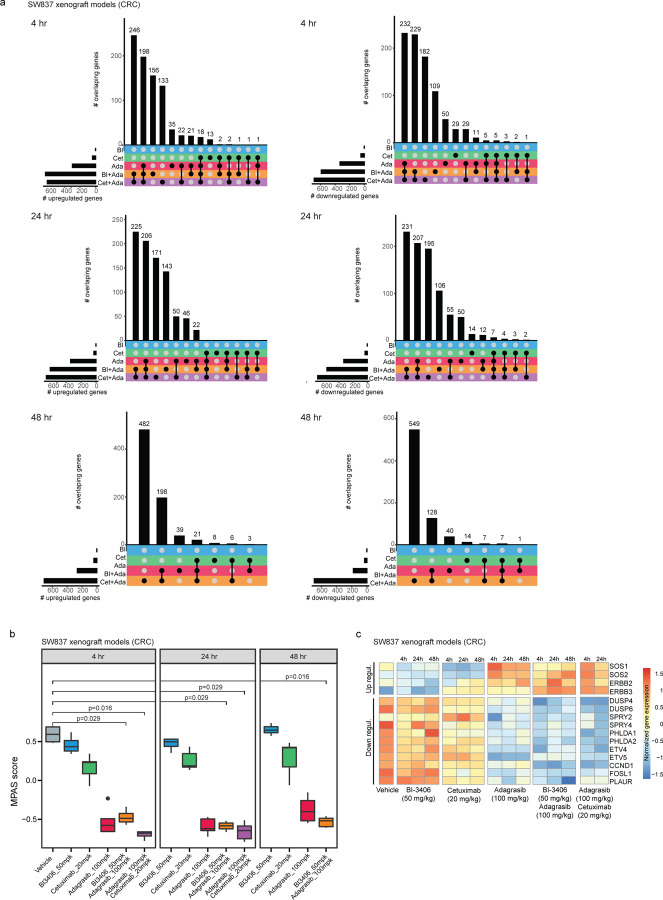
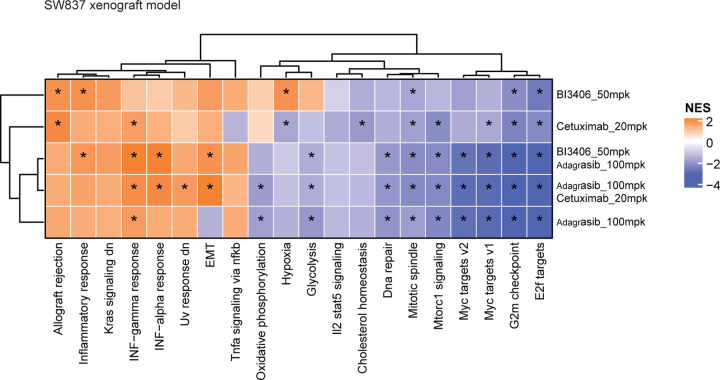
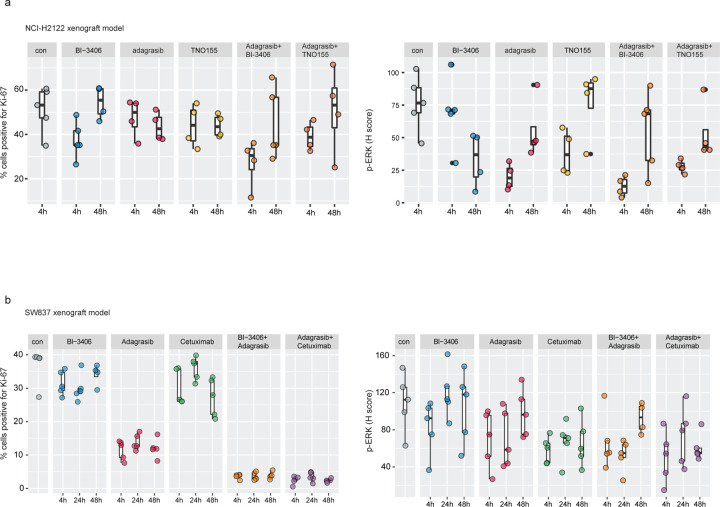
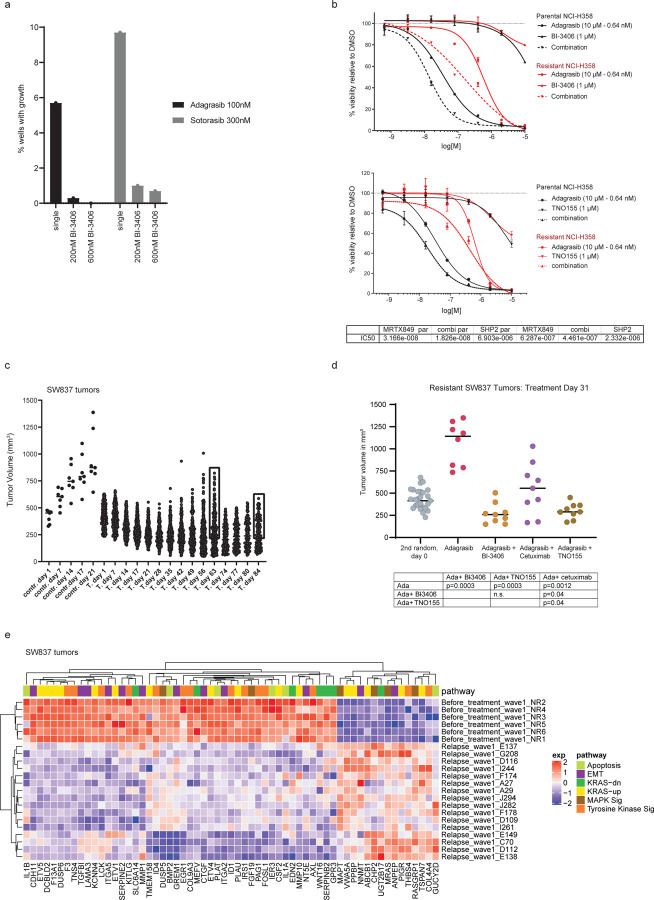
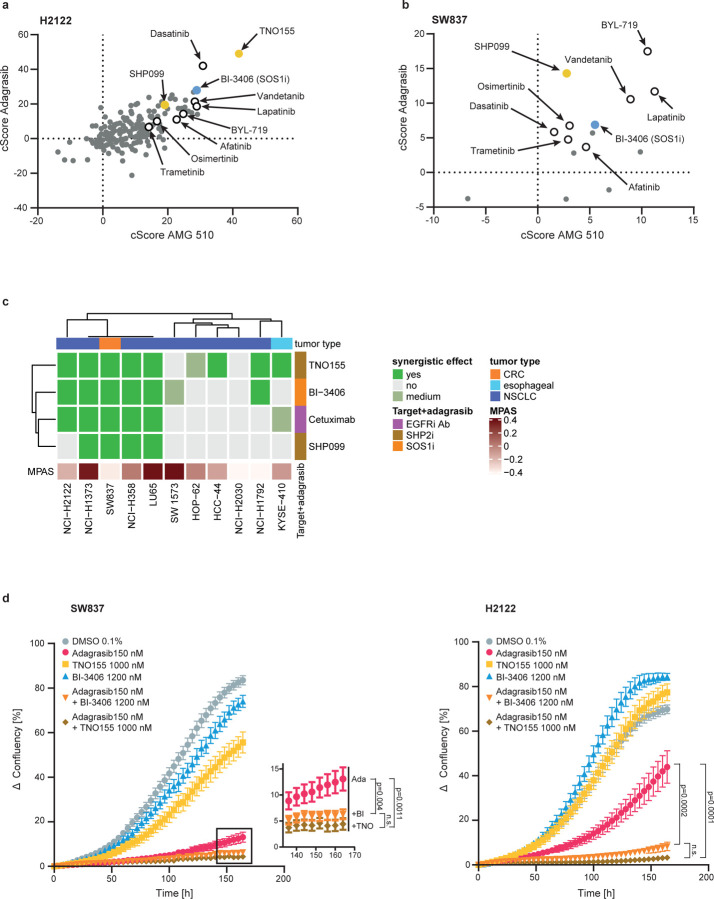
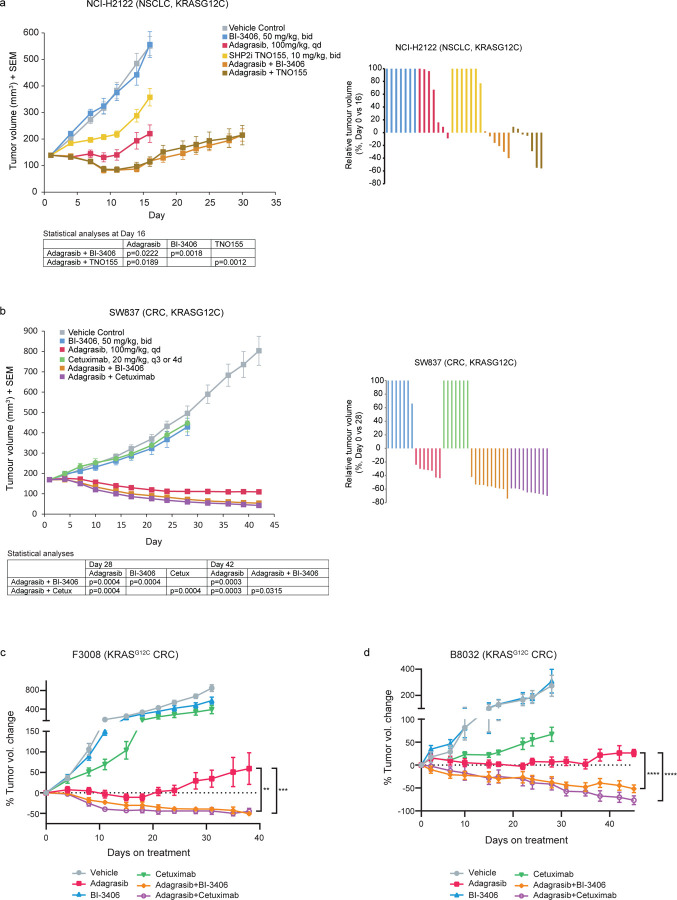
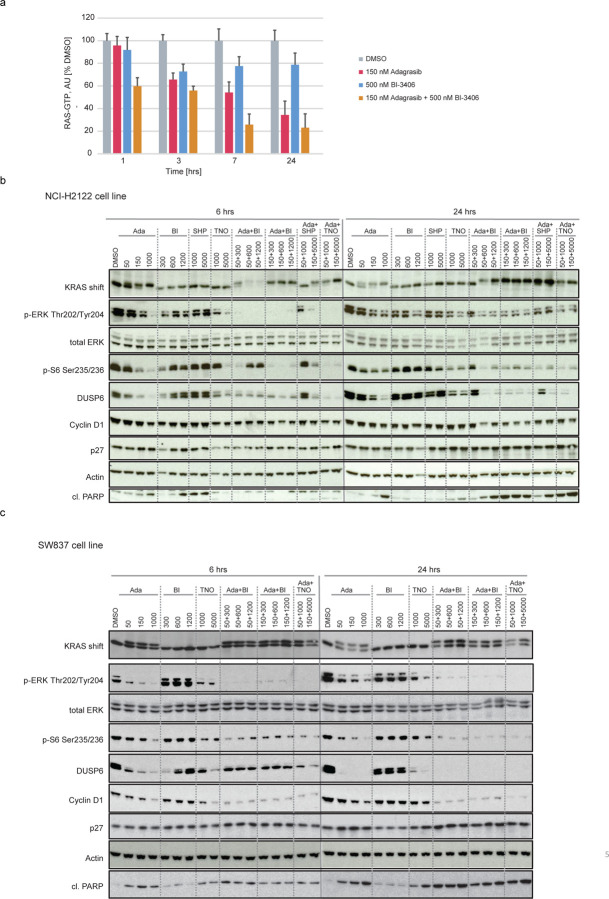
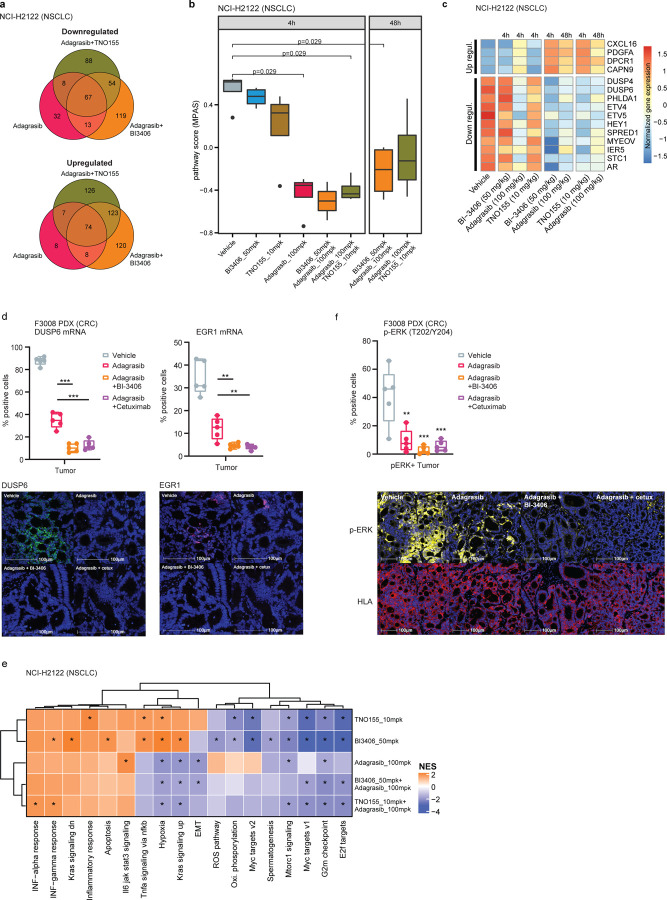
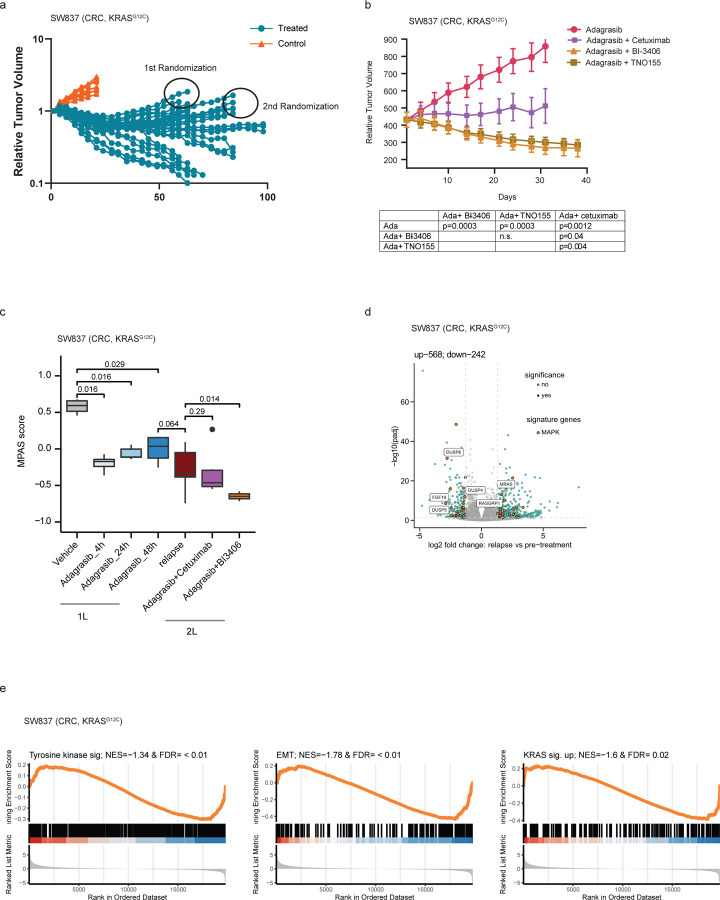
Efforts to improve the anti-tumor response to KRASG12C targeted therapy have benefited from leveraging combination approaches. Here, we compare the anti-tumor response induced by the SOS1-KRAS interaction inhibitor, BI-3406, combined with a KRASG12C inhibitor (KRASG12Ci) to those induced by KRASG12Ci alone or combined with SHP2 or EGFR inhibitors. In lung cancer and colorectal cancer (CRC) models, BI-3406 plus KRASG12Ci induces an anti-tumor response stronger than that observed with KRASG12Ci alone and comparable to those by the other combinations. This enhanced anti-tumor response is associated with a stronger and extended suppression of RAS-MAPK signaling. Importantly, BI-3406 plus KRASG12Ci treatment delays the emergence of acquired adagrasib resistance in both CRC and lung cancer models and is associated with re-establishment of anti-proliferative activity in KRASG12Ci-resistant CRC models. Our findings position KRASG12C plus SOS1 inhibition therapy as a promising strategy for treating both KRASG12C-mutated tumors as well as for addressing acquired resistance to KRASG12Ci.


Conflict of interest statement

Competing Interests V. Thatikonda, S. Jurado, K. Kostyrko, K. Bosch, D. Gerlach, M. Gmachl, S. Lieb, A. Jeschko, P. A. Jaeger, S. Strauss, F. Trapani, M. Pearson, I. Waizenegger, M. P. Petronczki, N. Kraut and M. H. Hofmann report grants from the Austrian Research Promotion Agency (FFG), receive personal fees from Boehringer Ingelheim (full-time employee) during the conduct of the study. M.H. Hofmann and M. Gmachl have been listed as inventor on patent applications for SOS1 inhibitors. A. Sorokin, S. Kopetz, H. Lu, A. A. Machado, M. Mahendra, E. D. Marszalek, S. Gao, N. Feng, C. A. Bristow, C. P. Vellano, T. P. Heffernan, and J. R. Marszalek report other from Boehringer Ingelheim (sponsored research) during the conduct of the study and this work was performed under a sponsored research collaboration between MD Anderson and Boehringer Ingelheim, for which the latter provided funding support. S. Kopetz has ownership interest in Lutris, Iylon, Frontier Medicines, Xilis, Navire and is a consultant for Genentech, EMD Serono, Merck, Holy Stone Healthcare, Novartis, Lilly, Boehringer Ingelheim, AstraZeneca/MedImmune, Bayer Health, Redx Pharma, Ipsen, HalioDx, Lutris, Jacobio, Pfizer, Repare Therapeutics, Inivata, GlaxoSmithKline, Jazz Pharmaceuticals, Iylon, Xilis, Abbvie, Amal Therapeutics, Gilead Sciences, Mirati Therapeutics, Flame Biosciences, Servier, Carina Biotech, Bicara Therapeutics, Endeavor BioMedicines, Numab, Johnson & Johnson/Janssen, Genomic Health, Frontier Medicines, Replimune, Taiho Pharmaceutical, Cardiff Oncology, Ono Pharmaceutical, Bristol-Myers Squibb-Medarex, Amgen, Tempus, Foundation Medicine, Harbinger Oncology, Inc, Takeda, CureTeq, Zentalis, Black Stone Therapeutics, NeoGenomics Laboratories, Accademia Nazionale Di Medicina, and receive research funding from Sanofi, Biocartis, Guardant Health, Array BioPharma, Genentech/Roche, EMD Serono, MedImmune, Novartis, Amgen, Lilly, Daiichi Sankyo. T. P. Heffernan receives advisory fees from Cullgen Inc. and Roivant Discovery.

Figures

Extended Data Figure 1.
Extended Data Figure 1.. Gene modulation by single-agent or combination treatments in a KRASG12C–driven colorectal cancer (CRC) xenograft model.
All treatments in SW837 xenograft models were administered over seven consecutive days. a, Overlap of up-regulated (left) or down-regulated (right) genes in tumors from SW837 xenograft models across three time points after receiving one of these treatments: 50 mg/kg bid, p.o. BI-3406 (BI); 20 mg/kg twice a week, i.p. cetuximab (Cet); 100 mg/kg qd, p.o. adagrasib (Ada); 50 mg/kg BI-3406 plus 100 mg/kg adagrasib (BI + Ada); 20 mg/kg cetuximab plus 100 mg/kg adagrasib (Cet + Ada). Samples were collected at 4, 24, and 48 hours after the last dose. n = 4–5 animals/groups. b, Modulation of overall MAPK pathway activity, as indicated by the MAPK Pathway Activity Score (MPAS), in tumors from SW837 xenograft models treated with indicated single-agent or combination treatments. Samples were collected at 4, 24 and 48 hours after the last dose. N=4–5/group. Boxplots show low and upper quartiles and median line is indicates. Whiskers: 1.5 x interquartile range. Data analyzed by two-sided Wilcoxon rank sum test. c, Differential modulation of select MAPK pathway genes in tumors from SW837 xenograft models treated with indicated single-agent or combination treatments. Samples were collected at 4, 24, or 48 hours post last dose. N=4–5/group
Extended Data Figure 2.
Extended Data Figure 2.. Differentially modulated pathways in a KRASG12C–driven colorectal cancer (CRC) xenograft model
Heatmap showing the normalized enrichment score of hallmark pathway gene sets in tumors from SW837 xenograft models treated with indicated single or combination therapies at 4 hours post-last dose.
Extended Data Figure 3.
Extended Data Figure 3.. Differential gene expression induced by single-agent or combination treatments in a KRASG12C–driven non-small cell lung cancer (NSCLC) or KRASG12C–driven colorectal cancer (CRC) xenograft model.
All treatments were administered over 7 consecutive days, with samples collected after the last dose. a, Biomarker analyses of cell proliferation biomarker, Ki-67 (left), and cell growth biomarker, phospho-ERK (p-ERK) (right), in NCI-H2122 xenograft models treated with vehicle (con), BI-3406 (50 mg/kg, bid, p.o.), adagrasib (100 mg/kg, qd, p.o.), TNO155 (10 mg/kg, bid, p.o.), adagrasib (100 mg/kg) plus BI-3406 (50 mg/kg), adagrasib (100 mg/kg) plus TNO155 (10 mg/kg) at 4 or 48 hours post-last dose. Control animals were treated with vehicle. N=4–5/group. Boxplots show low and upper quartiles and median line is indicates. Whiskers: 1.5 x interquartile range. Data analyzed by one-sided Mann-Whitney-Wilcoxon U-tests adjusted for multiple comparisons according to the Bonferroni-Holm Method within each subtopic. b, Biomarker analyses of cell proliferation biomarker, Ki-67 (left), and cell growth biomarker, phospho-ERK (p-ERK) (right), in SW837 xenograft models treated with vehicle (con), BI-3406 (50 mg/kg, bid, p.o.), adagrasib (100 mg/kg, qd, p.o.), TNO155 (10 mg/kg, bid, p.o.), adagrasib (100 mg/kg) plus BI-3406 (50 mg/kg), adagrasib (100 mg/kg) plus TNO155 (10 mg/kg) at 4 or 48 hours post-last dose. Control animals were treated with vehicle. N=4–5/group. Boxplots show low and upper quartiles and median line is indicates. Whiskers: 1.5 x interquartile range. Data analyzed by one-sided Mann-Whitney-Wilcoxon U-tests adjusted for multiple comparisons according to the Bonferroni-Holm Method within each subtopic.
Extended Data Figure 4.
Extended Data Figure 4.. Combination treatments lead to regression in KRASG12Ci-resistant colorectal cancer (CRC) models
a, Growth response of BaF/3 cells harboring a KRASG12C single site variant library to KRASG12C-specific inhibitors, adagrasib or sotorasib alone (single) or combined with 200 nM or 600 nM of BI-3406. N=1. b, Effects of adagrasib, BI-3406, or adagrasib plus BI-3406 (top) or adagrasib, TNO155, or adagrasib plus TNO155 (bottom) in a cell proliferation assay in adagrasib-sensitiv e (parental) or adagrasib-resistant NCI-H358 cells. Mean percentages of cell viability relative to the DMSO-treated control are shown. Error bars = ±SD; n=3 technical replicates. Each graph is representative of at least 2 independent experiments. c, Growth of SW837 tumors treated long-term with adagrasib (50mg/kg; n=300 mice total) or vehicle (0.5% Natrosol + 0.5% DMSO; n=7) on a 5 days on/2 days off dosing schedule. Outgrowth indicating tumors that developed acquired resistance to adagrasib is indicated with a black rectangle. d, Growth of adagrasib-resistant tumors per treatment group from (c) that were further treated with the following (n=5/group) for 31 days: adagrasib (50 mg/kg, qd, p.o.), adagrasib (50 mg/kg, qd, p.o.) plus BI-3406 (50mg/kg, bid, p.o.), adagrasib (50 mg/kg, qd., p.o.) plus cetuximab (20mg/kg, q3 or 4d, intraperitoneal), or adagrasib (50 mg/kg, qd) plus TNO155 (10mg/kg, bid). Bar indicates mean. Data were analyzed on Day 31 by an one-sided non-parametric Mann-Whitney-Wilcoxon U-tests adjusted for multiple comparisons according to the Bonferroni-Holm Method within each subtopic; ada = adagrasib; n.s. = non-significant. e, Heatmap showing expression z-score of genes belonging to apoptosis, epithelial-mesenchymal transition (EMT), or KRAS gene sets, as well as MAPK or tyrosine kinase signaling pathways from tumors collected from SW837 xenograft models prior to adagrasib treatment (Before Treatment) and during relapse (Relapse).
Figure 1.
Figure 1.. Efficacy of combination treatments in non-small cell lung cancer (NSCLC) and colorectal cancer (CRC) cell lines.
a, Comparison of combination scores (cScore) indicating the response of the KRASG12C mutant NSCLC cell line, NCI-H2122, to the combination treatment of AMG 510 or adagrasib with 179 other small molecules for 72 hours. Positive scores indicate synergistic effects with scores >5–10 generally considered “clear synergy.” Empty or yellow/blue coloured circles highlight selected compounds for reference. b, Comparison of combination scores (cScore) indicating the response of KRASG12C mutant CRC cell line, SW837, to the combination treatment of AMG 510 or adagrasib with 15 other small molecules for 96 hours. Positive scores indicate synergistic effects with scores >5–10 generally considered “clear synergy”. Empty or yellow/blue coloured circles highlight selected compounds for reference. c, Response of indicated cell line to the combination treatment of adagrasib with an SOS1 inhibitor (BI-3406), a SHP2 inhibitor (TNO155 or SHP099), or an EGFR inhibitor (cetuximab). Cell lines are indicated as colorectal cancer (CRC; orange), esophageal (light blue), or non-small cell lung cancer (NSCLC; dark blue). MAPK Pathway Activity Score (MPAS) are indicated. d, Growth kinetic of NCI-H2122 (right) or SW837 (left) cells treated with indicated single or combination treatments, or vehicle control (N=3 for each curve). Y-axis indicates change in confluency relative to t=0 hours. Inset shows boxed area for clarity. Mean ± SEM shown. Data analyzed by one-way analysis of variance (ANOVA) with Tukey’s multiple comparisons test.
Figure 2.
Figure 2.. Efficacy of combination treatments in non-small cell lung cancer (NSCLC) and colorectal cancer (CRC) xenograft models.
a, (left) Tumor volumes of mice injected subcutaneously with NCI-H2122 cells. Mice were treated 5 days of each week orally either with control vehicle, BI-3406 (50mg/kg; bid, with a delta of 6 hours), TNO155 (10mg/kg, bid), adagrasib (100mg/kg, qd) for 16 days, or with the combination of adagrasib plus BI-3406 or TNO155 for 30 days. n=7 animals/group. Data analyzed by one-sided Mann-Whitney-Wilcoxon U-tests adjusted for multiple comparisons according to the Bonferroni-Holm Method within each subtopic. Mean ± SEM shown. (right) Relative NCI-H2122 tumor volumes are indicated as percent change from baseline at Day 16. Values smaller than zero percent indicate tumor regressions. b, (left) Tumor volumes of mice injected subcutaneously with SW837 cells. Mice were treated 5 days of each week orally either with control vehicle, BI-3406 (50mg/kg; bid; with a delta of 6 hours), (100mg/kg, qd), cetuximab (20mg/kg, q3 or 4d, intraperitoneal), or adagrasib (100mg/kg for 28 days, qd), or with the combination of adagrasib plus cetuximab or BI-3406 for 42 days. n=7/group for monotherapies; n=10/group for combination therapies. Data analyzed by one-sided Mann-Whitney-Wilcoxon U-tests adjusted for multiple comparisons according to the Bonferroni-Holm Method within each subtopic. Mean ± SEM shown. (right) Relative SW837 tumor volumes are indicated as percent change from baseline at Day 28. Values smaller than zero percent indicate tumor regressions. c, Change in tumor volume in NSG mice implanted with KRASG12C-driven F3008 patient-derived xenograft (PDX) fragments and treated with vehicle, adagrasib (100 mg/kg, daily), BI-3406 (50mg/kg, twice daily), cetuximab (15 mg/kg, twice weekly), or the combination of adagrasib plus BI-3406 or cetuximab. n=8/group. Data analyzed by paired Student’s T-test; **p < 0.01; ***p < 0.001. Mean ± SEM shown. d, Change in tumor volume in nude mice implanted with KRASG12C-driven B8032 PDX fragments and treated with vehicle, adagrasib (100 mg/kg, daily), BI-3406 (50mg/kg, twice daily), cetuximab (20 mg/kg, twice weekly), or the combination of adagrasib plus BI-3406 or cetuximab. N = 5/group. Data analyzed by paired Student’s T-test; ***p < 0.001. Mean ± SEM shown.
Figure 3.
Figure 3.. Modulation of RAS-MAPK signaling by adagrasib monotherapy or combination treatments in non-small cell lung cancer (NSCLC) and colorectal cancer (CRC) cell lines
a, GLISA plate analysis of RAS GTP levels across indicated time points in KRASG12C mutant lung cancer (NCI-H2122) cells treated with DMSO, adagrasib (150 nM), BI-3406 (500 nM), or the combination of adagrasib plus BI-3406. Data shown as % of the DMSO control at each indicated time point; error bars = SD. n=2. b, Western blot analysis of NCI-H2122 cells treated with adagrasib, BI-3406, TNO155, or SHP099 alone, or adagrasib combined with BI-3406, SHP099, or TNO155 at indicated concentrations for either 6 or 24 hours. KRAS shift indicates covalent binding of compound to KRASG12C resulting in a slower migrating form of KRAS. β-Actin served as the loading control. c, Western blot analysis of the KRASG12C-mutant colon cancer cell line, SW837, treated with adagrasib, BI-3406, TNO155, or SHP099 alone, or adagrasib combined with BI-3406, SHP099, or TNO155 at indicated concentrations for either 6 or 24 hours. KRAS shift indicates covalent binding of compound to KRASG12C, resulting in a slower migrating form of KRAS. β-Actin served as the loading control. Of note, to detect total ERK and cl. PARP, only 15 µg total protein per lane was loaded. b-c, Ada: adagrasib; BI: BI-3406; SHP: SHP099; TNO: TNO155
Figure 4.
Figure 4.. Differential gene expression induced by single-agent or combination treatments in vivo.
All treatments were administered for 7 consecutive days, and samples were collected after the last dose. a, Venn diagram showing the overlap of upregulated (top) or downregulated (bottom) differentially expressed genes in the KRASG12C-mutant non-small cell lung cancer xenograft model (NCI-H2122) xenograft models treated with adagrasib (100 mg/kg) alone or combined with BI-3406 (50 mg/kg) or TNO155 (10 mg/kg). b, Modulation of overall MAPK pathway activity, as indicated by the MAPK Pathway Activity Score (MPAS), in NCI-H2122 xenograft models treated with indicated monotherapies or combination treatments at 4 or 48 hours post-last doses. N=2–3. Boxplots show low and upper quartiles and median line is indicates. Whiskers: 1.5 x interquartile range. Data analyzed by two-sided Wilcoxon rank sum test. c, Differential modulation of select MAPK pathway genes in NCI-H2122 xenograft models treated with indicated single-agent or combination treatments. Samples were collected at 4 or 48 hours post last dose. d, (top) Percentage of positive tumor cells expressing DUSP6 or EGR1 mRNA analyzed by RNAscope in F3008 colorectal cancer (CRC) patient-derived xenograft (PDX) models treated with vehicle, adagrasib (100mpk, QD), adagrasib plus BI-3406 (50mpk, BID), or adagrasib plus cetuximab (15mpk, twice weekly) for 5 days. Tumors were collected 4 hours after the last dose. N=5/group. Boxplots show low and upper quartiles and median line is indicates. Whiskers: 1.5 x interquartile range. Data analyzed by two-sided Student’s t-test, **p<0.01, ***p<0.001. (bottom) Representative images from multiplex immunofluorescence analysis of DUSP6 and EGR1 in tumor tissue from models described in (top). Scale bar = 100 µm. e, Gene set enrichment analysis heatmaps show differentially modulated pathways in NCI-H2122 xenograft models treated with indicated single-agent or combination therapies. f, (top) Percentage of positive tumor cells expressing phospho-ERK as analyzed by multiplex immunofluorescence in the same tumor tissues as described in d. N=5/group. Boxplots show low and upper quartiles and median line is indicates. Whiskers: 1.5 x interquartile range. Comparisons to vehicle analyzed by two-sided Student’s t-test; **p<0.01, ***p<0.001. (bottom) Representative images from multiplex immunofluorescence analysis of p-ERK and HLA in tumor tissue from models described in (top). Scale bar = 100 µm.
Figure 5.
Figure 5.. Co-administration of BI-3406 with adagrasib leads to regressions in KRASG12Ci-resistant colorectal cancer (CRC) models.
a, Tumor growth into the KRASG12C-mutant CRC xenograft model (SW847) treated with vehicle (red) or adagrasib (blue; 50 mg/kg, 5 days on/2days off per week). N=30 per group (n=10). b, Outgrowing adagrasib-resistant tumors from (a) that had shown an increase in size at least of 100mm3, were treated with adagrasib (50 mg/kg, qd, p.o.), adagrasib (50 mg/kg, qd, p.o.) plus BI-3406 (50mg/kg, bid, p.o.), adagrasib (50 mg/kg, qd., p.o.) plus cetuximab (20mg/kg, twice weekly, i.p.), or adagrasib (50 mg/kg, qd) plus TNO155 (10mg/kg, bid). N=5 tumors/group. Mean ± SEM are shown. Data were analyzed on Day 31 by an one-sided non-parametric Mann-Whitney-Wilcoxon U-tests adjusted for multiple comparisons according to the Bonferroni-Holm Method within each subtopic; ada = adagrasib; n.s. = non-significant. c, Modulation of overall MAPK pathway activity, as indicated by the MAPK Pathway Activity Score (MPAS), in tumors derived from SW837 xenograft models. Tumors were collected from models before adagrasib treatment (pre-treatment) and during relapse as well as from adagrasib-resistant models treated with adagrasib plus BI-3406 or cetuximab. N=3–16/group. Boxplots show low and upper quartiles and median line is indicates. Whiskers: 1.5 x interquartile range. Data analyzed by two-sided Wilcoxon ran sum test. d, Volcano plot of differentially regulated genes between pre-adagrasib treatment (pre-treatment) and relapsed SW837 tumors. The most significantly differential genes involved in MAPK pathway are highlighted. e, Gene set enrichment analysis (GSEA) plots show downregulated pathways between tumors collected from SW837 models prior to adagrasib treatment and during relapse after chronic adagrasib treatment. EMT = epithelial-mesenchymal transition. NES = normalized enrichment score; FDR = false discovery rate-adjusted q value.

References

    1. Prior I. A., Hood F. E. & Hartley J. L. The Frequency of Ras Mutations in Cancer. Cancer Res 80, 2969–2974, doi: 10.1158/0008-5472.CAN-19-3682 (2020). - DOI - PMC - PubMed
    1. Cerami E. et al. The cBio cancer genomics portal: an open platform for exploring multidimensional cancer genomics data. Cancer Discov 2, 401–404, doi: 10.1158/2159-8290.CD-12-0095 (2012). - DOI - PMC - PubMed
    1. Consortium, A. P. G. AACR Project GENIE: Powering Precision Medicine through an International Consortium. Cancer Discov 7, 818–831, doi: 10.1158/2159-8290.CD-17-0151 (2017). - DOI - PMC - PubMed
    1. Herdeis L., Gerlach D., McConnell D. B. & Kessler D. Stopping the beating heart of cancer: KRAS reviewed. Curr Opin Struct Biol 71, 136–147, doi: 10.1016/j.sbi.2021.06.013 (2021). - DOI - PubMed
    1. Hofmann M. H., Gerlach D., Misale S., Petronczki M. & Kraut N. Expanding the Reach of Precision Oncology by Drugging All KRAS Mutants. Cancer Discov, doi: 10.1158/2159-8290.CD-21-1331 (2022). - DOI - PMC - PubMed

Publication types