[Preprint]. 2023 Jan 27:rs.3.rs-2481749.
doi: 10.21203/rs.3.rs-2481749/v1.

Intracellular Spatial Transcriptomic Analysis Toolkit (InSTAnT)

Affiliations

Intracellular Spatial Transcriptomic Analysis Toolkit (InSTAnT)

Anurendra Kumar et al. Res Sq. .

Update in

Abstract

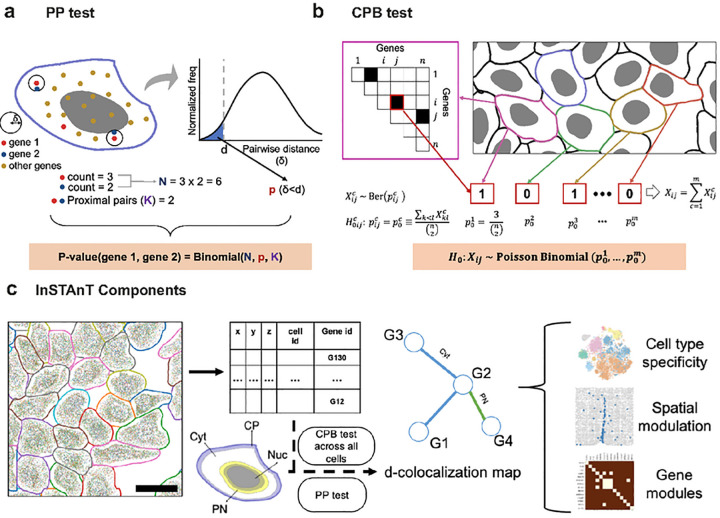
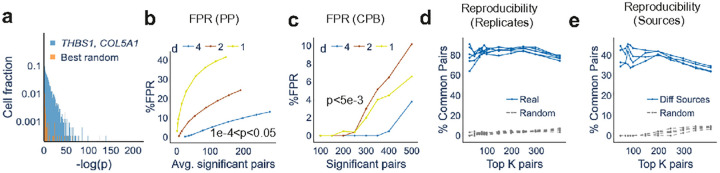
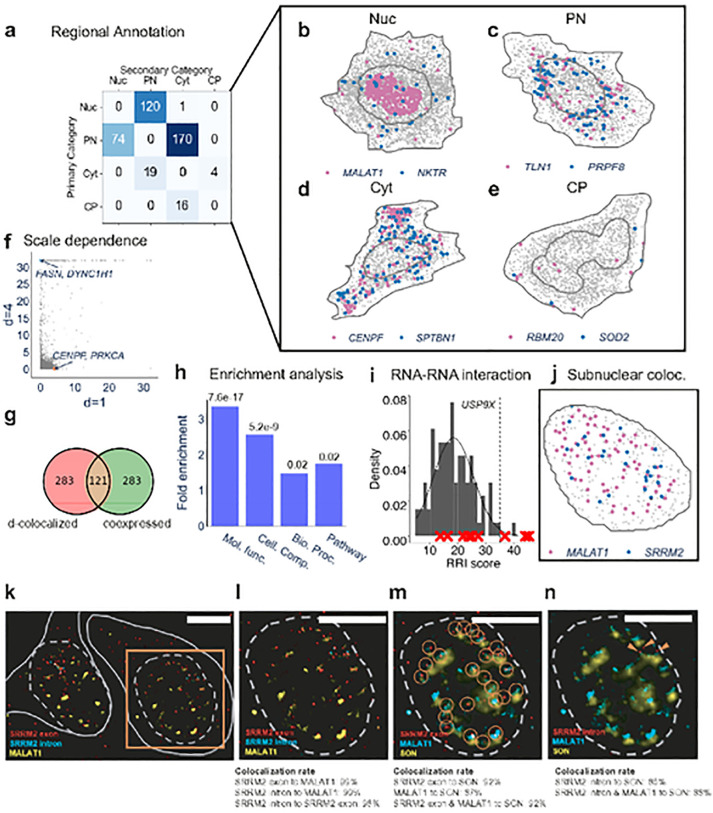
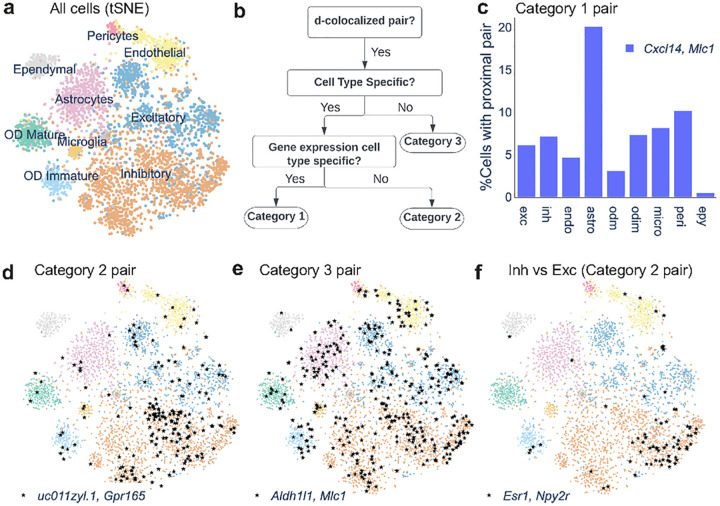
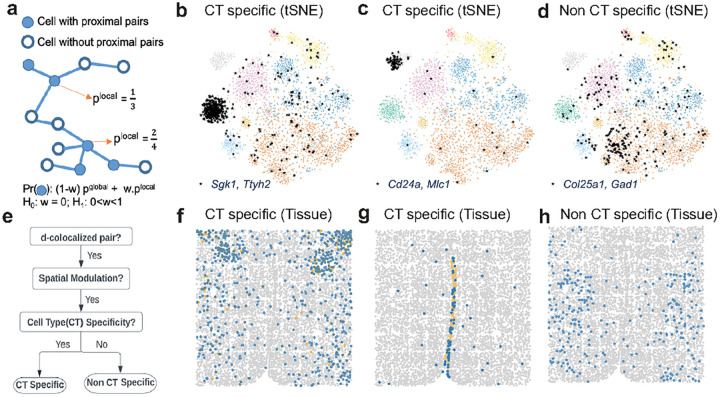
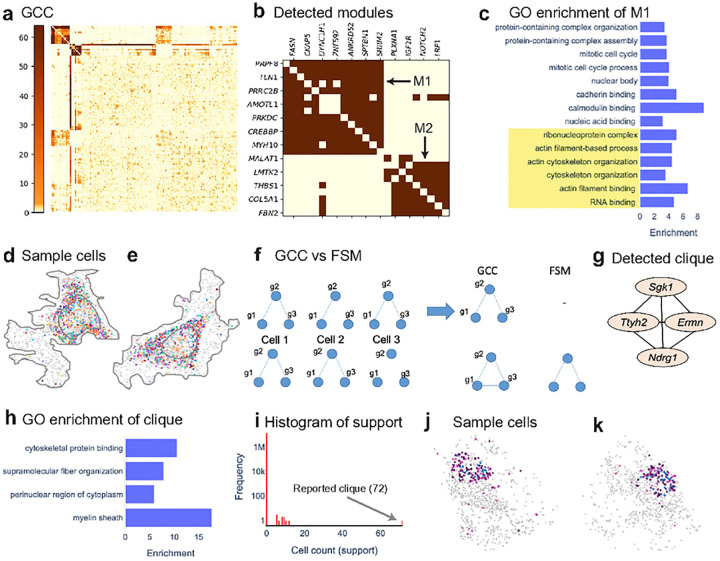
Imaging-based spatial transcriptomics technologies such as MERFISH offer snapshots of cellular processes in unprecedented detail, but new analytic tools are needed to realize their full potential. We present InSTAnT, a computational toolkit for extracting molecular relationships from spatial transcriptomics data at the intra-cellular resolution. InSTAnT detects gene pairs and modules with interesting patterns of mutual co-localization within and across cells, using specialized statistical tests and graph mining. We showcase the toolkit on datasets profiling a human cancer cell line and hypothalamic preoptic region of mouse brain. We performed rigorous statistical assessment of discovered co-localization patterns, found supporting evidence from databases and RNA interactions, and identified subcellular domains associated with RNA-colocalization. We identified several novel cell type-specific gene co-localizations in the brain. Intra-cellular spatial patterns discovered by InSTAnT mirror diverse molecular relationships, including RNA interactions and shared sub-cellular localization or function, providing a rich compendium of testable hypotheses regarding molecular functions.


Figures

Figure 1.
Figure 1.. Schematic of InSTAnT.
(a) Schematic of Proximal Pair (PP) test to detect if transcripts of a gene pair (gene 1, gene 2) tend to occur near each other in a single cell, d denotes the distance threshold used. A histogram of distances (δ) between transcript pairs (regardless of gene identity) in the cell is used to calculate the background probability of a transcript pair being located within distance d of each other p(δ < d), and the number of such proximal pairs (K) of the pair (gene 1, gene 2) is assessed using a Binomial test, (b) Simplified schematic of Conditional Poisson Binomial (CPB) test. For each cell, gene pairs found to be significant by the PP test are noted (triangular matrix, top left). For a gene pair i, j, the random variable Xijc indicates if it is significant under the PP test and is assumed to have a Bernoulli distribution with parameter p0c. estimated as the fraction of all pairs that are significant in that cell. The sum Xij of Xijc over all cells follows a Poisson Binomial distribution. The CPB test further adjusts p0c to be dependent on the genes i, j (not illustrated here), (c) Schematic showing functionalities of the InSTAnT toolkit. The input is spatial transcriptomics data in the form of a text file with spatial coordinates and gene identifier of each transcript, with transcripts in the same cell being tagged with a common cell identifier. At the core of the toolkit is the PP test, applied to each cell separately, and the CPB test, applied on the collection of cells, resulting in a d-colocalization map whose nodes are genes and edges are significantly d-colocalized gene pairs; edges are also annotated with the cellular region where the represented gene pair tends to colocalize. Perinuclear (PN) region is defined as including 2.5 microns on either side of the nuclear membrane, while Cell Periphery (CP) is defined as regions within 4 microns of the cell membrane. Remaining regions are designated as Cytosol (Cyt) or Nucleus (Nuc). The global map can then be further analyzed to identify gene pairs whose d-colocalization is specific to a cell type, is spatially modulated at the tissue level, or to identify modules of genes that colocalize with each other.
Figure 2.
Figure 2.. Assessment of InSTAnT on U2OS MERFISH data.
(a) Histogram of −log(p-value) obtained from PP Test for the gene pair THBS1, COL5A1 over 3237 cells. Also shown is the histogram of −log(p-value) for the best gene pair after randomizing gene identities on the results of PP test for each cell. The best gene pair corresponds to the pair having highest number of cells with proximal pair, (b) Estimates of false positive rates (FPR) at varying p-value thresholds for PP test. For each distance threshold d, we vary the p-value threshold and compare the average number of significant pairs per cell on randomized data to the average number on real data. The estimated FPR (y) is plotted against the average number of significant pairs detected per cell, (c) Estimates of FPR at varying number of detected pair obtained by varying p-value thresholds for CPB test. The number of significant pairs on randomized data is compared to the number (at the same p-value threshold) on real data to obtain an FPR estimate at that threshold, which is plotted against the number of significant pairs, (d) Reproducibility of CPB test results across replicates of a dataset. For each pair of replicates (out of four), the K most significant pairs (by CPB test) in either replicate are compared, and the percentage of shared pairs (out of K) reported (blue). The exercise was repeated for randomized versions of the replicates to obtain random baselines (grey), (e) Reproducibility of CPB test results across different datasets. Each replicate of the Moffit et al. MERFISH data set was compared to our MERFISH data for U2OS to obtain percentages of common d-colocalized pairs (blue). Corresponding random baselines are shown in grey.
Figure 3.
Figure 3.. InSTAnT results on U2OS data.
(a) Regional annotation (nuclear, perinuclear, cytoplasm or perimembrane) of all d-colocalized gene pairs. Proximal pairs of a d-colocalized gene pair across all cells are recorded and aggregated over all cells to obtain the most and second-most frequent regional annotations, (b-e) Examples of d-colocalized gene pairs annotated as nuclear (b). perinuclear (c). cytosolic (d) and cell periphery (e) respectively. Shown is one of many cells in which the respective gene pair was significant by the PP test. (f) Negative log p-value from the CPB test for all gene pairs, at d=1 micron and d=4 micron. An example of a gene pair specific to each d is highlighted, (g) Overlap of the set of d-colocalized gene pairs with co-expressed gene pairs. Co-expressed gene pairs are identified based on Pearson correlation of whole-cell transcript counts, and the top 404 pairs are taken to match the size of the d-colocalization map. (h) Hypergeometric test is performed to show enrichment of set of d-colocalized pairs with set of functionally related gene pairs. A gene pair is functionally related if both genes are annotated with same GO terms or Kegg pathway, (i) The grey histogram shows the null distribution of RRI scores for USP9X. calculated using the RNAs of genes with which it is not d-colocalized. This provides a null distribution of RRI scores, which is then used to test if the genes with which it is d-colocalized (defined here as those with 10 smallest p-values under the CPB test) are enriched for high (greater than 35) RRI scores. The test yields a p-value of le-4. due to the 3 genes with high RRI scores being included among the 10 d-colocalized partners of USP9X. (j) Nucleus of a cell showing transcripts of MALAT1 and SRRM2. The PP test p-value for this nucleus is 4.3e-19. (k) SRRM2 exon (red). SRRM2 intron (cyan), and MALAT1 (yellow). RNAs labeled with smFISH probes in fixed U-2 OS cells. Dashed gray lines indicate the nuclear boundaries, and solid gray lines indicate cytosolic boundaries. (l) Selected nuclear region shown in the orange box in (k). showing high co-localization rate of SRRM2 exon mRNAs with MALAT1 IncRNAs in the nucleus. As expected, the SRRM2 intron puncta co-localize with SRRM2 exon puncta. (m) SRRM2 exon mRNA (red). MALAT11ncRNA (cyan), and SON protein (yellow) labeled in the same nucleus as (I). Orange circles indicate co-localization of SRRM2 exon puncta and MALAT 1 puncta. most of the SRRM2 exons co-locatize with MALAT1. SON protein was selected to label nuclear speckles. Many co-localized RNA pairs are nearby to SON protein, (n) Similar as (m). plotting SRRM2 intron (red) with MALAT1 IncRNA and SON protein, orange arrows indicate SRRM2 intron puncta that co-localize with MALAT1 puncta. Similar to SRRM2 exon puncta. SRRM2 intron puncta tend to be near SON protein. Co-localization rate calculated using 13 cells. Scale bars for (k-n) is 10 μm.
Figure 4.
Figure 4.. Cell type specificity of d-colocalized pairs in mouse hypothalamus preoptic region.
(a) t-SNE plot of all cells annotated with cell type assignments obtained from M off it et al. The gene count for each cell is aggregated by summing their transcript count across seven z-slices. b) Flow chart showing how a d-colocalized pair is classified into one of three categories depending on whether it is a proximal pair (PP test) in cells specifically of a cell type and whether either gene is a marker of that cell type, (c) Example of a category 1 pair, found to be a proximal pair in many cells of different types but significantly more frequently in astrocytes. Shown is the percentage of cells of each type where the gene pair is significant in the PP test. The gene pair is of category 1 because both genes are marker genes, (d) Example of a category 2 pair, specific to inhibitory neurons. Each black star is a cell where the pair was significant under PP test, (e) Example of a category 3 pair, which is a proximal pair in cells of many types and not specific to any type, (f) Example of a gene pair specific to inhibitory neurons compared to excitatory neurons. (Cell type specificity was defined based on a two-way comparison here, in contrast to the one-versus-all comparison used for examples in c-e.)
Figure 5.
Figure 5.. Spatial modulation of d-colocalized pairs in mouse hypothalamus preoptic region.
(a) Probabilistic graphical model to detect spatially modulated gene pair. In a graph where nodes represent cells and edges represent spatial proximity, each cell is first flagged based on whether the gene pair is significant by PP test in that cell. The likelihood function is a product over all cells of a weighted sum of plocal, the local density of flagged cells in cell’s neighborhood, and pglobal, free parameter. The weight w is also a free parameter. A likelihood ratio score is computed to compare this model to a null model where the local (spatial) information is not used, (b) t-SNE plot of a spatially modulated d-colocalized gene pair Sgk1-Ttyh2 showing that it is a proximal pair (black stars) significantly more often in Mature Oligodendrocytes (OD) and is significant in other cell types. (See Figure 4a for cell type annotations.) (f) Cells in spatial coordinates, shown in blue if the gene pair of (b) Sgk1-Ttyh2 is a proximal pair, in orange if the cell is Mature OD but Sgk1-Ttyh2 is not a proximal pair, and in grey otherwise. (c,g) t-SNE plot (c) and spatial plot (g) showing a spatially modulated d-colocalized gene pair Cd24a-Mlc1 significant specifically in cells of one cell type (ependymal cells) and not significant in other cell types. (d,h) t-SNE plot (d) and spatial plot (h) of a gene pair Col25a1-Gad1 that is a proximal pair across several cell types, (e) Flowchart showing how a spatially modulated d-colocalized pair is categorized based on its cell type specificity.
Fig 6.
Fig 6.. Gene Module Discovery.
(a) Global Colocalization Clustering (GCC): Global d-colocalization map for U2OS data, represented as a matrix of −log(p-value) of CPB test for gene pairs, is subjected to hierarchical clustering to reveal two gene modules, (b) Closer view of the two modules (M1, M2) discovered by GCC, shown after thresholding p-values at 1e-3 (FPR<1%). (c) Gene Ontology (GO) terms enriched in gene module M1, shown with the fold enrichment over random expectation. (Criterion for selection: Fisher exact p-value < 0.03) (d, e) Two cells illustrating spatial distribution of transcripts of M1 genes (colored dots) along with all other transcripts (grey). Each color corresponds to a gene, (f) Schematic illustration of difference between Global Colocalization Clustering (GCC) and Frequent Subgraph Mining (FSM). In each row, the three graphs on the left show proximal pair relationships (edges) involving genes g1, g2, g3, in three different cells. In either case, GCC reports the 3-gene module as the global map includes each of the three gene pairs. FSM, on the other hand, finds the 3-gene clique to occur frequently in the bottom scenario but not in the top scenario. (g) A 4-gene module detected using FSM on brain data, (h) Gene ontology terms enriched in the 4-gene module of (g). (Criterion of selection: Fisher exact p-value < 0.03). (i) Histogram of “support” of all possible 4-gene cliques. Support refers to the number of cells where all pairwise relationships in the 4-gene set are significant by the PP test. The clique of (g) has a support of 72, far greater than all other cliques, (j-k) Example of two cells supporting the 4-gene module of (g). Each color represents a transcript of one of the four genes, grey represents all other transcripts.

References

    1. Rao A., Barkley D., França G.S. & Yanai I. Exploring tissue architecture using spatial transcriptomics. Nature 596, 211–220 (2021). - PMC - PubMed
    1. Marx V. Method of the Year: spatially resolved transcriptomics. Nature methods 18, 9–14 (2021). - PubMed
    1. Svensson V., Teichmann S.A. & Stegle O. SpatialDE: identification of spatially variable genes. Nature methods 15, 343–346 (2018). - PMC - PubMed
    1. Zhu J., Sun S. & Zhou X. SPARK-X: non-parametric modeling enables scalable and robust detection of spatial expression patterns for large spatial transcriptomic studies. Genome biology 22, 1–25 (2021). - PMC - PubMed
    1. Pham D. et al. stLearn: integrating spatial location, tissue morphology and gene expression to find cell types, cell-cell interactions and spatial trajectories within undissociated tissues. BioRxiv (2020).

Publication types

LinkOut - more resources