[Preprint]. 2023 Jan 27:2023.01.26.525789.
doi: 10.1101/2023.01.26.525789.

Molecular mechanisms of coronary artery disease risk at the PDGFD locus

Affiliations

Molecular mechanisms of coronary artery disease risk at the PDGFD locus

Hyun-Jung Kim et al. bioRxiv. .

Update in

Abstract

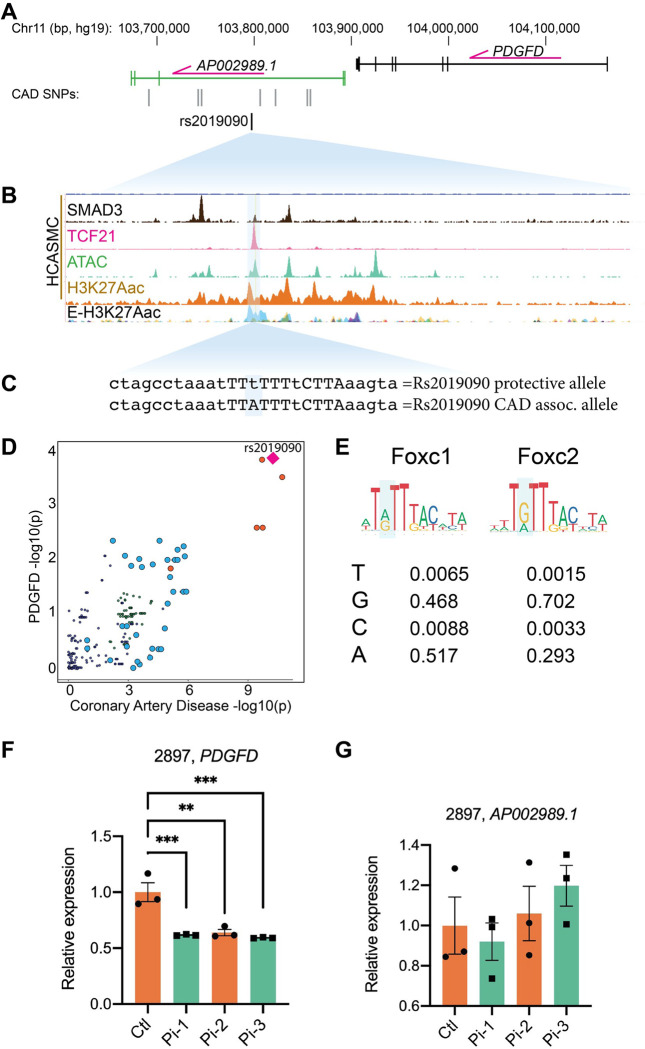
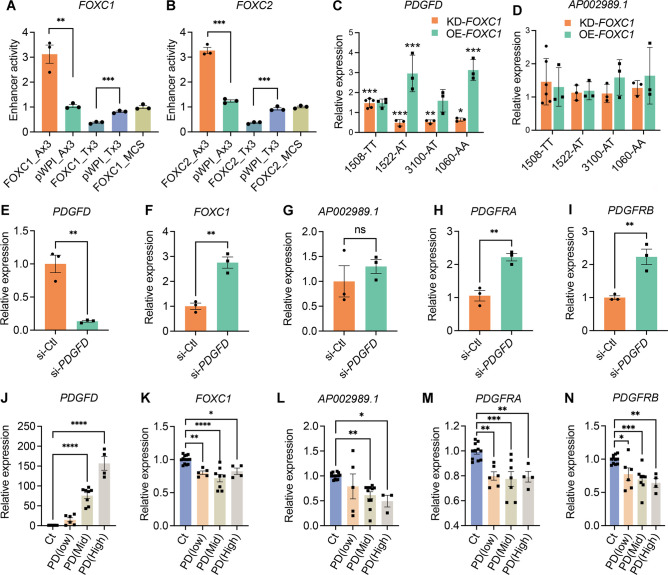
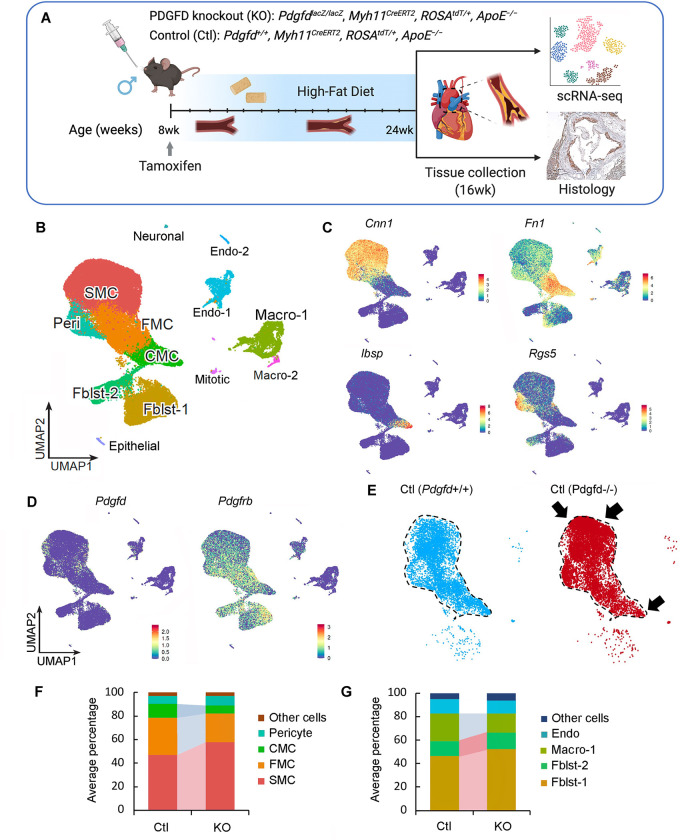
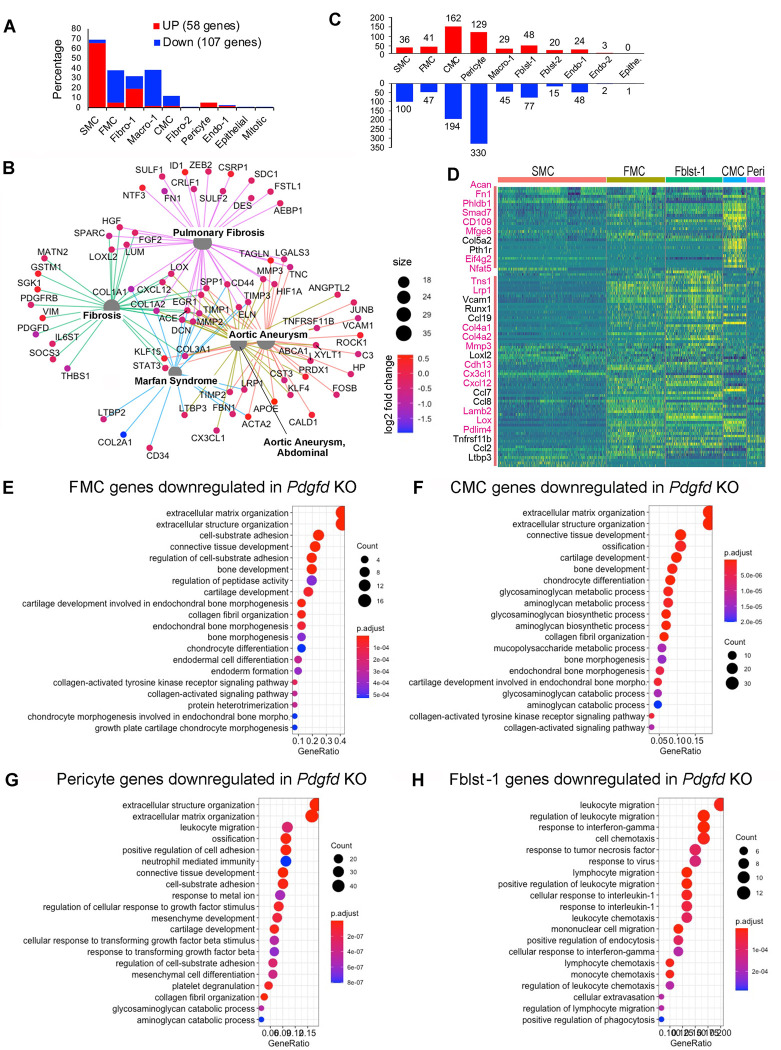
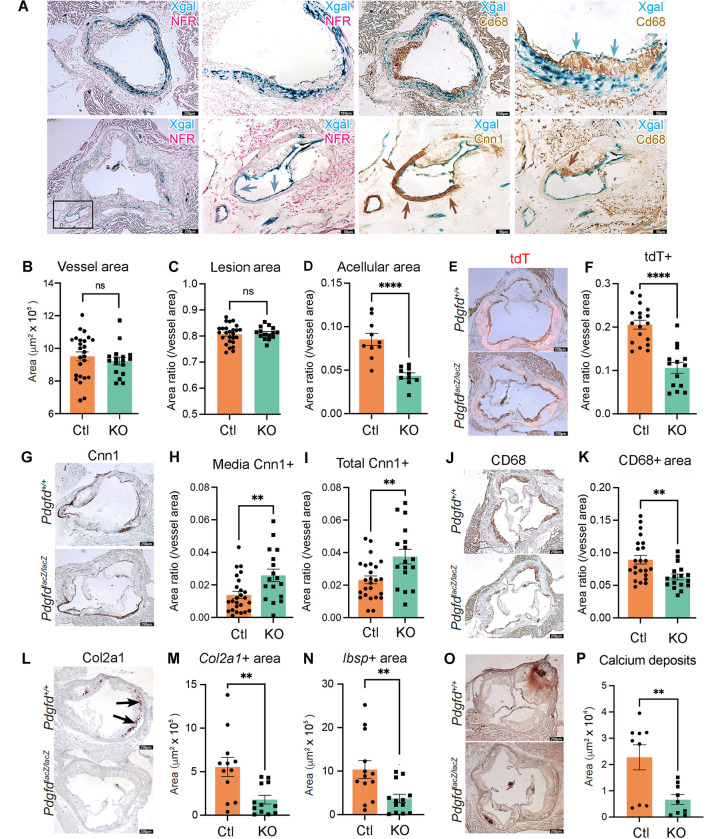
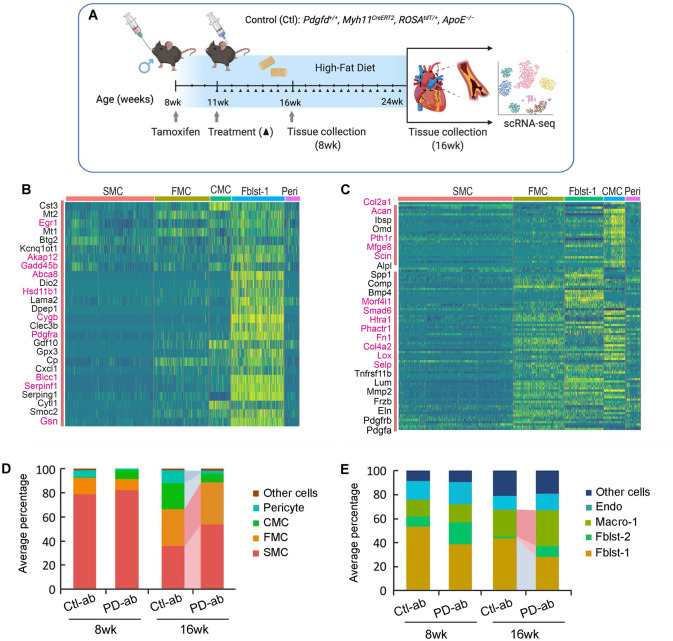
Platelet derived growth factor (PDGF) signaling has been extensively studied in the context of vascular disease, but the genetics of this pathway remain to be established. Genome wide association studies (GWAS) for coronary artery disease (CAD) have identified a risk locus at 11q22.3, and we have verified with fine mapping approaches that the regulatory variant rs2019090 and PDGFD represent the functional variant and putative functional gene. Further, FOXC1/C2 transcription factor (TF) binding at rs2019090 was found to promote PDGFD transcription through the CAD promoting allele. Employing a constitutive Pdgfd knockout allele along with SMC lineage tracing in a male atherosclerosis mouse model we mapped single cell transcriptomic, cell state, and lesion anatomical changes associated with gene loss. These studies revealed that Pdgfd promotes expansion, migration, and transition of SMC lineage cells to the chondromyocyte phenotype and vascular calcification. This is in contrast to protective CAD genes TCF21, ZEB2, and SMAD3 which we have shown to promote the fibroblast-like cell transition or perturb the pattern or extent of transition to the chondromyocyte phenotype. Further, Pdgfd expressing fibroblasts and pericytes exhibited greater expression of chemokines and leukocyte adhesion molecules, consistent with observed increased macrophage recruitment to the plaque. Despite these changes there was no effect of Pdgfd deletion on SMC contribution to the fibrous cap or overall lesion burden. These findings suggest that PDGFD mediates CAD risk through promoting SMC expansion and migration, in conjunction with deleterious phenotypic changes, and through promoting an inflammatory response that is primarily focused in the adventitia where it contributes to leukocyte trafficking to the diseased vessel wall.


Figures

Figure 1.
Figure 1.. Functional mapping of candidate 11q22.3 locus proposes regulatory mechanisms of PDGFD expression and disease association.
(A) UCSC browser screenshot at 11q22.3 locus showing position of PDGFD gene and lncRNA AP002989.1 relative to the candidate SNP rs2019090, and (B) overlap of rs2019090 with ChIP-seq tracks for CAD risk transcription factors SMAD3 and TCF21. Also shown are ATAC-seq open chromatin and active enhancer histone modification H3K27ac ChIP-seq tracks in human coronary artery smooth muscle cells (HCASMC), as well as ENCODE layered H3K27ac for HUVEC (blue) and NHLF (purple) cells. Genomic coordinates refer to hg19 assembly. (C) Genomic sequence at rs2019090 for protective and disease alleles, with FOXC1/C2 motifs indicated. (D) Co-localization of coronary artery disease (CAD) GWAS signal and PDGFD eQTL data (GTEx v8, aorta). (E) Position weight matrices for FOXC1 and FOXC2, as per JASPAR database. (F, G) CRISPRi epigenetic silencing by transduction of dCad9KRAB and single guide RNAs targeted around rs2019090 in a HCASMC line with AA genotype. Expression of PDGFD and lncRNA AP002989.1 were evaluated by quantitative RT-PCR.
Figure 2.
Figure 2.. FOXC1 regulates PDGFD expression via causal SNP rs2019090 to establish a complex gene regulatory network.
Results of enhancer trap assay for (A) FOXC1 and (B) FOXC2 co-transfected with luciferase reporters with three copies of the 150 basepair region containing the A allele (rs-2019090-A) or T allele (rs-2019090-T) cloned into the minimal promoter-driven luciferase reporter vector pLUC-MCS. A7r5 rat vascular smooth muscle cells were used for these assays. Values represent mean ± s.e.m. of triplicates for a representative experiment, expressed as fold change relative to pWPI-empty plasmid with p-values obtained with an unpaired t-test. Abbreviations: FOXC1_Ax3, FOXC1 or 2 over-expression with A allele reporter; Pwpi_Ax3, empty expression plasmid with A allele reporter; FOXC1_Tx3, FOXC1 or 2 over-expression with T allele reporter; Pwpi_Tx3, empty expression plasmid with A allele reporter. (C) Results of quantitative polymerase chain reaction (qPCR) analysis for PDGFD or (D) AP002989.1 expression with knockdown (KD) or over-expression (OE) of FOXC1 in HCASMC carrying different genotypes for rs2019090. Each dot represents a biological replicate. Data were normalized relative to controls and expressed as mean ± s.e.m with p-values using an unpaired t-test. (E) qPCR analysis for expression levels of PDGFD, (F) FOXC1, (G) AP002989.1, (H) PDGFRA, and (I) PDGFRB with PDGFD knockdown (KD) in HCASMC. Each dot represents a biological replicate. Data were expressed as mean ± s.e.m with p-values using an unpaired t-test. (J) qPCR analysis for expression levels of PDGFD, (K) FOXC1, (L) AP002989.1, (M) PDGFRA, and (N) PDGFRB with PDGFD overexpression (OE) in HCASMC. Data grouped based on expression levels of PDGFD and expressed as mean ± s.e.m of biological replications with p-values. Each dot represents a biological replicate. Analysis was performed using one-way ANOVA with Dunnett’s multiple comparisons post-hoc test. Data represented as relative expression as control ratio (treatment of scramble siRNA (si-Ctl, KD control) or empty-pWPI (Ct, OE control). * p<0.05, ** p<0.01, *** p<0.001, **** p<0.0001.
Figure 3.
Figure 3.. Single-cell transcriptomic profiling of mouse atherosclerotic aortic root in Pdgfd KO mice.
(A) Schematic of experimental design showing that dissected aortic tissues were harvested for single cell RNA sequencing (scRNAseq) and histology analyses from SMC-specific lineage tracing control (Ctl) and lineage tracing Pdgfd knockout (KO) mice. Eight-week-old mice, 2 Ctl and 3 KO captures (two mice per capture), were treated with tamoxifen twice at 3-day intervals and subsequently fed high fat diet for 16 weeks and then sacrificed. Tissues were digested to single cells, tdTomato positive (tdT+) fluorescence and negative (tdT−) cells collected and captured on the10x Chromium controller, libraries generated and sequenced. (B) Uniform manifold approximation and projection (UMAP) of scRNAseq results identified 13 different clusters at 2.6 clustering resolution, with respective biological cluster identities as defined by cluster marker genes. (C) UMAP displaying expression of indicated markers reflecting unique cluster identity: Cnn1, SMC; Fn1, FMC; Ibsp, CMC; Rgs5, pericytes. (D) UMAP visualizing dimension reduction plots of Pdgfd and Pdgfrb expression. (E) UMAP images comparing feature expression of tdTomato positive cells from Ctl and KO mice. The dotted line is generated based on the Ctl image. (F) Bar plot presenting the average percentage of lineage traced cells and (G) non-lineage traced cells in Ctl and KO groups.
Figure 4.
Figure 4.. Loss of Pdgfd mitigates the smooth muscle cell chondrogenic transition and inflammatory pathway activation.
(A) Bar plot showing the number of upregulated genes (58, red bars) and down-regulated genes (107, blue bars) derived from all KO compared to all Ctl disease tissues. (B) Gene-disease network analysis of the differentially expressed genes (DEGs) among lineage traced cells in KO compared with Ctl as determined by enrichplot. (C) Bar plot displaying numbers of DEGs in individual clusters, for KO compared with Ctl. (D) Heatmap showing expression patterns of down-regulated DEGs across different cluster groups, based on fold-change of gene expression. Yellow color indicates differential expression, genes in red text reside in window of lead SNP ± 500 kilobases. (E-H) Graphs depicting gene set enrichment analysis underlying biological process of DEGs for (E) FMC, (F) CMC, (G) pericytes, and (H) Fibroblasts-1 as determined by clusterProfiler.
Figure 5.
Figure 5.. In situ studies of mouse atherosclerosis reveal that Pdgfd KO lessens SMC cell state transitions and inflammation but without impact on plaque burden.
(A) X-gal staining visualizing β-galactosidase activity (lacZ, blue precipitate) to determine the cellular location of Pdgfd expression in mouse model atherosclerosis. Aortic root sections were also stained with a generic nuclear marker nuclear fast red (NFR), immunohistochemistry for the Cd68 macrophage marker or Cnn1 marker for SMC identification. (B) Quantification of total vessel area. (C) Quantification of lesion, and (D) acellular areas in Ctl and KO groups expressed as a ratio of the total vessel area per section. (E) Representative images identifying expression of the tdTomato gene to visualize the SMC lineage traced cells in aortic sections. (F) Quantification of tdTomato positive (tdT+) area relative to total vessel area. (G) Representative sections stained for Cnn1, a marker of the differentiated SMC. (H) Quantification of Cnn1 positive (Cnn1+) area at the media, and (I) compared to total cross-sectional area expressed as a ratio of the total vessel area per section. (J) Representative images of Cd68-stained aortic root area to quantify monocyte recruitment. (K) Quantification of Cd68 positive (Cd68+) area relative to the vessel area. (L) Representative images of Col2a1 RNAscope of the aortic root in Ctl and KO mice. (M) Quantitative RNAscope of Col2a1 and (N) Ibsp expression. (O) Representative images stained for calcium deposits with alizarin Red S. (P) Quantification of calcium deposits. Each dot represents quantification from identical level sections from individual animals. Data expressed as mean ± s.e.m with p-values using an unpaired t-test. ** p<0.01, *** p<0.001.
Figure 6.
Figure 6.. Single cell RNA-seq studies of antibody mediated Pdgfd knockdown in the mouse atherosclerosis model.
(A) Schematic of experimental design showing that SMC-specific lineage tracing widltype mice were treated with tamoxifen at 8 weeks age and tissues harvested after 8 and 16 weeks of high fat diet. Blocking Pdgfd antibody or isotype control antibody administration was initiated at 11 weeks and continued until animals were sacrificed after either 8 weeks exposure to the diet (5 weeks antibody) or 16 weeks diet (13 weeks antibody), and scRNAseq conducted at these timepoints. (B) Heatmap showing gene expression changes after 5 weeks of antibody treatment. The Fblst-1 cluster shows early downregulation of Pdgfd regulated genes, and FMC and CMC cluster cells beginning to show evidence of upregulation of these genes as the SMC lineage cells are undergoing phenotypic transition in the developing lesion. Yellow color indicates differential downregulation, genes in red text reside in window of lead SNP ± 500 kilobases. (C) Heatmap showing decreases in Pdgfd regulated genes across different cell clusters in targeted animals compared to controls. (D) Bar plot presenting the average percentage of lineage traced cells and (E) non-lineage traced cells in Ctl and KO groups.

References

    1. Mathers CD, Loncar D. Projections of global mortality and burden of disease from 2002 to 2030. PLoS Med 3, e442 (2006). - PMC - PubMed
    1. Roth GA, et al. Global and regional patterns in cardiovascular mortality from 1990 to 2013. Circulation 132, 1667–1678 (2015). - PubMed
    1. Erdmann J, Kessler T, Munoz Venegas L, Schunkert H. A decade of genome-wide association studies for coronary artery disease: the challenges ahead. Cardiovasc Res 114, 1241–1257 (2018). - PubMed
    1. Klarin D, et al. Genetic analysis in UK Biobank links insulin resistance and transendothelial migration pathways to coronary artery disease. Nat Genet 49, 1392–1397 (2017). - PMC - PubMed
    1. Nelson CP, et al. Association analyses based on false discovery rate implicate new loci for coronary artery disease. Nat Genet 49, 1385–1391 (2017). - PubMed

Publication types