[Preprint]. 2023 Jan 31:2023.01.26.525763.
doi: 10.1101/2023.01.26.525763.

Ultra-Fast Bioorthogonal Spin-Labeling and Distance Measurements in Mammalian Cells Using Small, Genetically Encoded Tetrazine Amino Acids

Affiliations

Ultra-Fast Bioorthogonal Spin-Labeling and Distance Measurements in Mammalian Cells Using Small, Genetically Encoded Tetrazine Amino Acids

Subhashis Jana et al. bioRxiv. .

Update in

Abstract

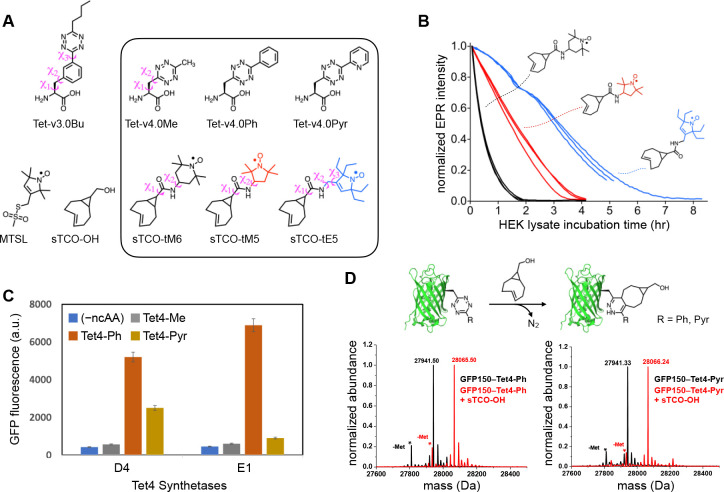
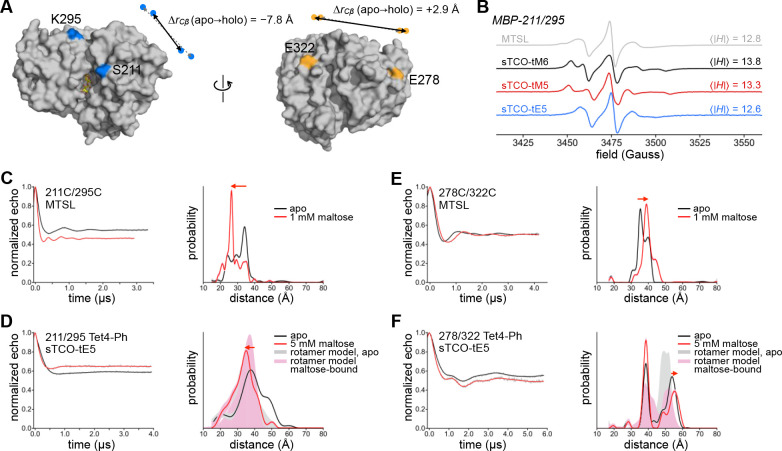
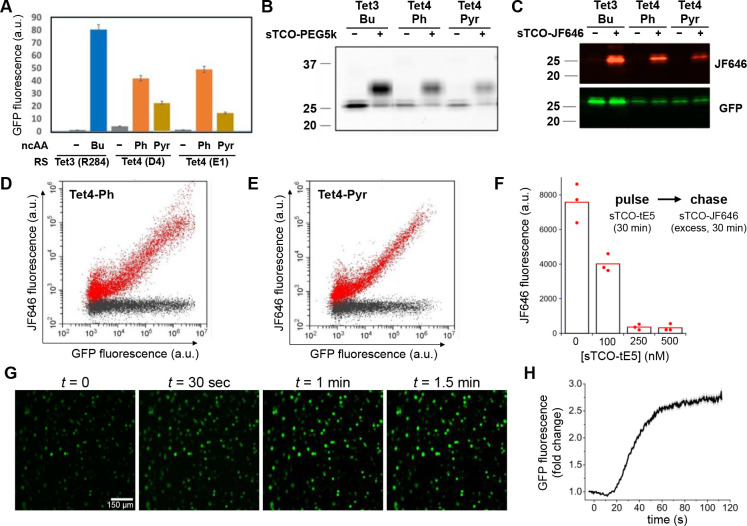
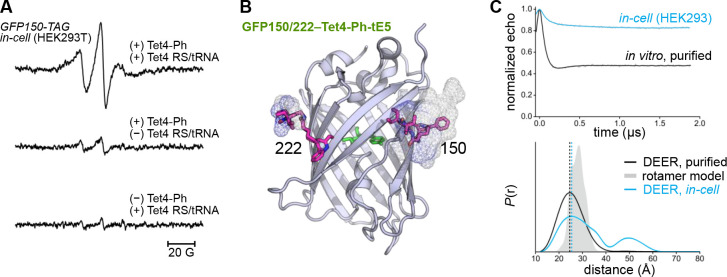
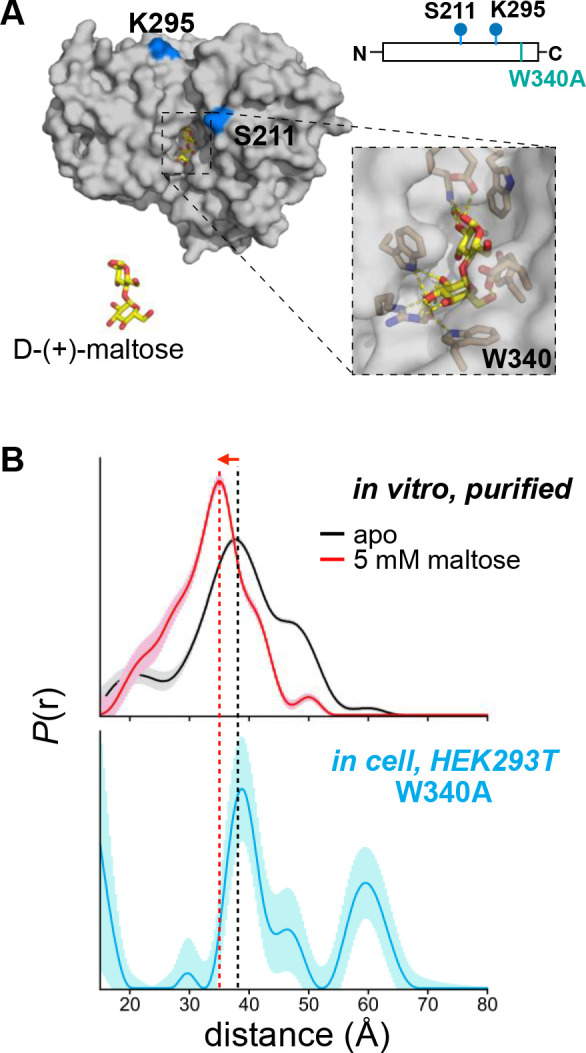
Studying protein structures and dynamics directly in the cellular environments in which they function is essential to fully understand the molecular mechanisms underlying cellular processes. Site-directed spin-labeling (SDSL)-in combination with double electron-electron resonance (DEER) spectroscopy-has emerged as a powerful technique for determining both the structural states and the conformational equilibria of biomacromolecules. In-cell DEER spectroscopy on proteins in mammalian cells has thus far not been possible due to the notable challenges of spin-labeling in live cells. In-cell SDSL requires exquisite biorthogonality, high labeling reaction rates and low background signal from unreacted residual spin label. While the bioorthogonal reaction must be highly specific and proceed under physiological conditions, many spin labels display time-dependent instability in the reducing cellular environment. Additionally, high concentrations of spin label can be toxic. Thus, an exceptionally fast bioorthogonal reaction is required that can allow for complete labeling with low concentrations of spin-label prior to loss of signal. Here we utilized genetic code expansion to site-specifically encode a novel family of small, tetrazine-bearing non-canonical amino acids (Tet-v4.0) at multiple sites in green fluorescent protein (GFP) and maltose binding protein (MBP) expressed both in E. coli and in human HEK293T cells. We achieved specific and quantitative spin-labeling of Tet-v4.0-containing proteins by developing a series of strained trans -cyclooctene (sTCO)-functionalized nitroxides-including a gem -diethyl-substituted nitroxide with enhanced stability in cells-with rate constants that can exceed 10 6 M -1 s -1 . The remarkable speed of the Tet-v4.0/sTCO reaction allowed efficient spin-labeling of proteins in live HEK293T cells within minutes, requiring only sub-micromolar concentrations of sTCO-nitroxide added directly to the culture medium. DEER recorded from intact cells revealed distance distributions in good agreement with those measured from proteins purified and labeled in vitro . Furthermore, DEER was able to resolve the maltose-dependent conformational change of Tet-v4.0-incorporated and spin-labeled MBP in vitro and successfully discerned the conformational state of MBP within HEK293T cells. We anticipate the exceptional reaction rates of this system, combined with the relatively short and rigid side chains of the resulting spin labels, will enable structure/function studies of proteins directly in cells, without any requirements for protein purification.


Figures

Figure 1.
Figure 1.. Tet-v4.0 ncAAs and sTCO-nitroxides: Spin-label Stability, Genetic Encoding, and Reactivity.
(A) Tetrazine amino acid and sTCO-spin label structures. Rotatable side-chain dihedral angles preceding the tetrazine are illustrated for Tet-v3.0Bu and Tet-v4.0Me, as well as for sTCO-spin labels (B) Stability of sTCO-nitroxides (12 μM) in diluted HEK293T cytosolic extract at room temperature. EPR signal intensity was measured as the peak-to-trough amplitude of the X-band CW EPR spectrum. Each trace is an individual time course from triplicate measurements for each of the three sTCO-spin labels. (C) Tet4 incorporation efficiency measured with GFP fluorescence of E. coli co-transformed with GFP150–TAG and evolved Mb-Pyl-tRNA/RS pairs D4 or E1 in the presence and absence of Tet4 ncAAs (0.5 mM). (D) Reactivity of GFP150–Tet4-Ph/Pyr monitored by ESI-Q-TOF mass spectrometry. Schematic representation of the IEDDA reaction between GFP–Tet4 and sTCO-OH (top). Deconvoluted mass spectra of purified GFP150–Tet4-Ph (bottom left) and GFP150–Tet4-Pyr (bottom right) before (black) and after (red) reaction with sTCO-OH. Cal. Mass of GFP–wt: 27827.02 Da (avg); GFP150–Tet4-Ph (observed: 27941.5 Da, expected: 27940.1Da); GFP150–Tet4-Ph + sTCO-OH (observed: 28065.5 Da, expected: 28064.1 Da); GFP150–Tet4-Pyr (observed: 27941.3 Da, expected: 27941.1Da); GFP150–Tet4-Pyr + sTCO-OH (observed: 28066.2 Da, expected: 28065.1 Da). Asterisks (*) mark peaks corresponding to the loss of N-terminal methionine. Low intensity peaks at higher mass are sodium and potassium adducts.
Figure 2.
Figure 2.. Tet-v4.0 SDSL-EPR and DEER on Maltose Binding Protein.
(A) Surface rendering of maltose-bound MBP (1anf) with labeling sites indicated in color. For doubly-labeled constructs 211/295 (blue) and 278/322 (orange), the change in Cβ distance between apo (dashed gray arrows) and holo (solid black arrows) conformations is indicated. (B) Room temperature X-band CW EPR spectra of purified MBP 211/295-Cys spin-labeled with MTSL (gray) and MBP 211/295-Tet4-Ph spin-labeled with sTCO-tM6 (black), -tM5 (red), or -tE5 (blue). (C–F) Background-corrected DEER time traces and distance distributions for doubly spin-labeled MBP constructs 211/295 and 278/322. Maltose-free data are shown in black and data from samples recorded in the presence of 1 mM or 5 mM maltose are shown in red. Cysteine mutant constructs (C,E) were labeled with MTSL and Tet4-Ph constructs (D,F) were labeled with sTCO-tE5. Shaded distributions are predictions from in silico rotameric modeling with the chiLife software package in Python based on the available structures of apo (pdb 1omp; gray) and maltose-bound (pdb 1anf; pink) MBP.
Figure 3.
Figure 3.. Encoding and reactivity of Tet-v4.0 in mammalian cells.
(A) Suppression efficiency of GFP150-TAG with Tet4-Ph and Tet4-Pyr amino acids measured by flow cytometry of cultured HEK293T cells, in comparison with Tet3-Bu. (B) Reactivity of GFP150–Tet4 in whole-cell HEK293T lysate verified by mobility shift of GFP detected by SDS-PAGE upon incubation with sTCO-PEG5k. (C) In-cell labeling of GFP150–Tet4-Ph/Pyr in HEK293T cells with sTCO-JF646 as monitored by fluorescent imaging of SDS-PAGE gel. (D,E) Quantitative analysis of GFP150–Tet4-Ph (D) and GFP150–Tet4-Pyr (E) labeling in live HEK293T cells with sTCO-JF646 using 2D single-cell fluorescent flow cytometry (red: 100 nM sTCO-JF646; black: 0.1% DMSO; 30 mins.). (F) Concentration dependence of in-cell spin-labeling of HEK293T cells expressing MBP322–Tet4-Ph with sTCO-TEP assessed by pulse-chase with sTCO-JF646. MBP322–Tet4-Ph molecules not labeled with sTCO-tE5 but subsequently labeled with excess sTCO-JF646 were quantified by in-gel fluorescence of whole-cell lysates. Points indicate individual experiments with mean JF646 fluorescence from triplicate experiments given by bars. (G,H) Live-HEK293T cell labeling of GFP150–Tet4-Ph with sTCO-tE5 spin label. (G) Epifluorescence micrographs of HEK293T cells expressing GFP150–Tet4-Ph at various times before and after perfusion with 1 μM sTCO-tE5. (H) Time course of GFP fluorescence increase of HEK293T cells expressing GFP150–Tet4-Ph upon perfusion (at t = 0) with 1 μM sTCO-tE5 in DMEM + 10% FBS. Data are mean cell fluorescence divided by mean fluorescence at t = 0. Gray bars are mean ± standard error of the mean.
Figure 4.
Figure 4.. CW EPR and DEER in HEK293 cells.
(A) Room temperature X-band EPR spectra of HEK293T cells transfected with GFP150-TAG and Tet4 Mb-PylRS/tRNA in the presence of 150 μM Tet4-Ph ncAA (top). Cells were spin-labeled with 200 nM sTCO-tE5 (10 min, r.t.) and spectra were recorded 1 h post-labeling. EPR spectra of labeled cells lacking either the Mb-PylRS/tRNA pair (middle) or Tet4-Ph ncAA (bottom) are displayed on identical scales. (B) Structural model of GFP150/222–Tet4-Ph labeled with sTCO-tE5 displaying estimated rotameric distributions as mesh surface. Spin-labeled side chains were modeled with the chiLife package in Python. (C) 4-pulse DEER time traces (top) and distance distributions (bottom) for GFP150/222–Tet4-Ph-tE5 recorded from in vitro-purified protein (black) and in intact HEK293T cells (blue). Error bands on the distributions estimated from LongDistances are shown but are similar to the linewidth. The simulated distance distribution from rotameric modeling is shown in gray shade.
Figure 5.
Figure 5.. Conformation of MBP W340A in mammalian cells by DEER.
(A) Structural model and schematic of the MBP construct used for in-cell DEER. Residues substituted with Tet4-Ph are indicated in blue. The maltose-binding pocket with Trp-340 highlighted is shown as zoomed inset. (B) Distance distributions obtained by DEER for MBP211/295–Tet4-Ph-tE5 in vitro (top) and for MBP(340A)211/295–Tet4-Ph-tE5 in HEK293T cells (bottom) with uncertainties represented as shaded error bands. Dashed lines centered at the maximum of the in vitro apo (black) and maltose-bound (red) distributions are shown for ease of comparison to the in-cell distribution.

References

    1. Theillet F.-X., Binolfi A., Frembgen-Kesner T., Hingorani K., Sarkar M., Kyne C., Li C., Crowley P.B., Gierasch L., Pielak G.J., et al. (2014). Physicochemical Properties of Cells and Their Effects on Intrinsically Disordered Proteins (IDPs). Chemical Reviews 114, 6661–6714. 10.1021/cr400695p. - DOI - PMC - PubMed
    1. König I., Soranno A., Nettels D., and Schuler B. (2021). Impact of In-Cell and In-Vitro Crowding on the Conformations and Dynamics of an Intrinsically Disordered Protein. Angewandte Chemie International Edition 60, 10724–10729. 10.1002/anie.202016804. - DOI - PubMed
    1. Zotter A., Bäuerle F., Dey D., Kiss V., and Schreiber G. (2017). Quantifying enzyme activity in living cells. Journal of Biological Chemistry 292, 15838–15848. 10.1074/jbc.M117.792119. - DOI - PMC - PubMed
    1. Schlesinger A.P., Wang Y., Tadeo X., Millet O., and Pielak G.J. (2011). Macromolecular Crowding Fails To Fold a Globular Protein in Cells. Journal of the American Chemical Society 133, 8082–8085. 10.1021/ja201206t. - DOI - PMC - PubMed
    1. Dedmon M.M., Patel C.N., Young G.B., and Pielak G.J. (2002). FlgM gains structure in living cells. Proceedings of the National Academy of Sciences 99, 12681–12684. 10.1073/pnas.202331299. - DOI - PMC - PubMed

Publication types