[Preprint]. 2023 Jan 25:2023.01.24.525211.
doi: 10.1101/2023.01.24.525211.

Human milk variation is shaped by maternal genetics and impacts the infant gut microbiome

Affiliations

Human milk variation is shaped by maternal genetics and impacts the infant gut microbiome

Kelsey E Johnson et al. bioRxiv. .

Update in

Abstract

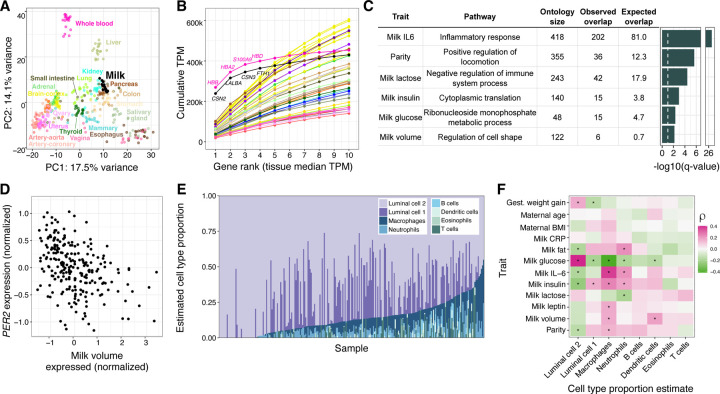
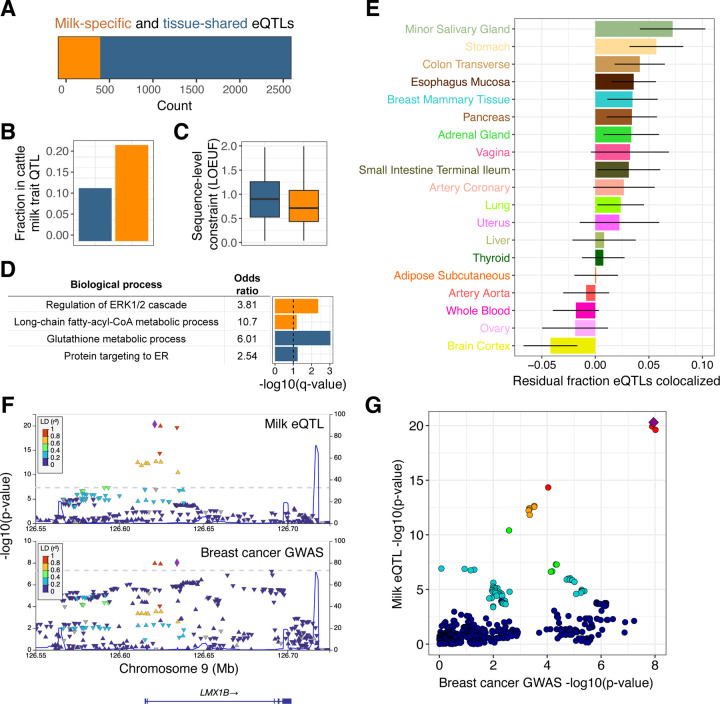
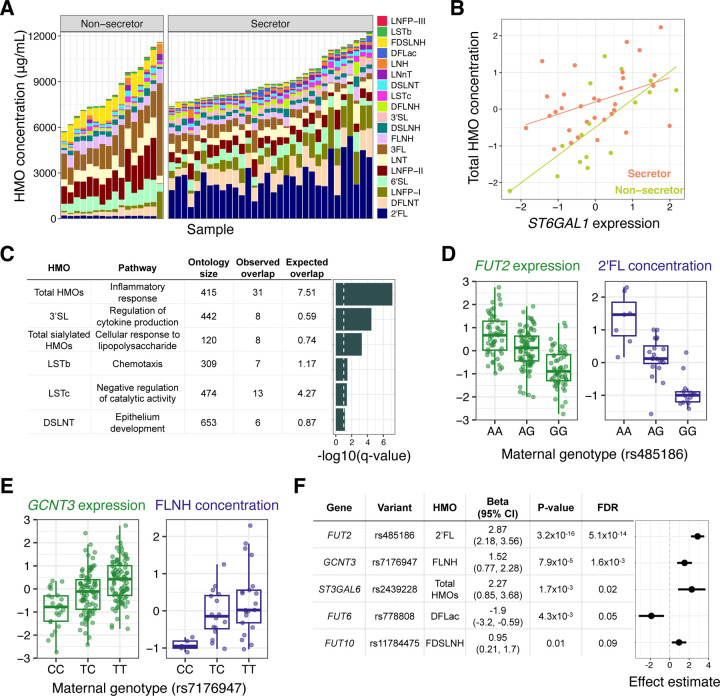
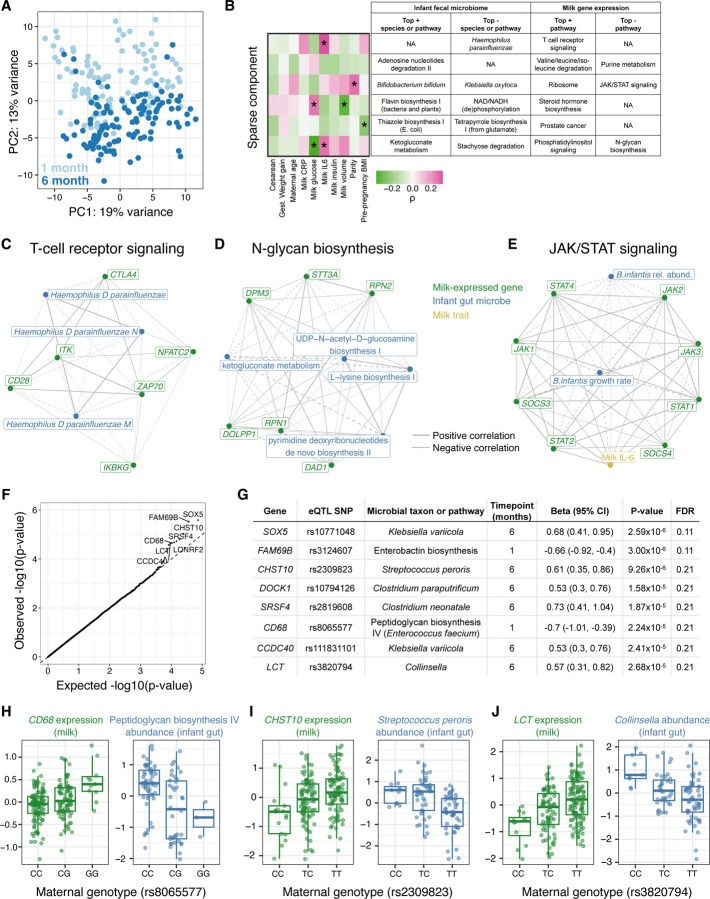
Human milk is a complex mix of nutritional and bioactive components that provide complete nutrition for the infant. However, we lack a systematic knowledge of the factors shaping milk composition and how milk variation influences infant health. Here, we used multi-omic profiling to characterize interactions between maternal genetics, milk gene expression, milk composition, and the infant fecal microbiome in 242 exclusively breastfeeding mother-infant pairs. We identified 487 genetic loci associated with milk gene expression unique to the lactating mammary gland, including loci that impacted breast cancer risk and human milk oligosaccharide concentration. Integrative analyses uncovered connections between milk gene expression and infant gut microbiome, including an association between the expression of inflammation-related genes with IL-6 concentration in milk and the abundance of Bifidobacteria in the infant gut. Our results show how an improved understanding of the genetics and genomics of human milk connects lactation biology with maternal and infant health.


Conflict of interest statement

Competing interests: The authors declare no competing interests.

Figures

Figure 1.
Figure 1.. Overview of gene expression in human milk.
A) Principal components analysis of transcriptomes from a subset of GTEx tissues and milk. PCs were calculated using the 1000 most variable genes within GTEx, then milk samples were projected onto the GTEx samples. An equivalent plot including all GTEx tissues is in Fig. S1. B) Cumulative TPM (transcripts per million) of the top 10 genes by median TPM for milk and GTEx tissues. Color scheme is the same as in 1A. C) Gene ontology enrichment of genes with expression correlated to maternal and milk traits. The most significant term for each trait is shown (Methods). The dashed white vertical line denotes a q-value of 10%. D) Correlation between milk volume (from a standardized electric breast pump expression during a study visit, see Methods) and normalized PER2 gene expression in milk. E) Cell type proportion estimates generated using Bisque for transcriptomes from this study, and reference milk single cell RNA-seq from Nyquist et al 2022. F) Heatmap of Spearman correlations between estimated cell type proportions (x-axis) and maternal/milk traits (y-axis). *q-value<10%.
Figure 2:
Figure 2:. Genetic influences on gene expression in human milk.
A) Counts of genes that have milk-specific eQTLs (orange, genes that have an eQTL only in milk or where the milk eQTL did not colocalize with any GTEx tissue, see Methods) vs. tissue-shared eQTLs (blue, genes with milk eQTLs that colocalized with at least one other tissue in GTEx). B) Fraction of genes in each category that overlapped with a milk trait QTL in the dairy cattle genome. C) Distributions of sequence-level constraint, measured by the loss-of-function observed/expected upper bound fraction (LOEUF) statistic. D) Enriched gene ontologies for genes with milk-specific (orange) or tissue-shared (blue) eQTLs. The dashed vertical line denotes a q-value of 10%. E) Sharing of eQTLs between milk and a subset of GTEx tissues, measured through statistical colocalization. Each bar shows each tissue’s similarity to milk, measured by the residual fraction of eQTLs colocalized with milk, after regressing out tissue sample size. Error bars represent a 95% confidence interval. F) LocusZoom genetic associations in the LMX1B region with milk gene expression (top panel) and breast cancer risk (bottom panel). Each data point represents a SNP, plotted by their chromosomal location (x-axis) and significance of association (y-axis), with colors corresponding to LD (linkage disequilibrium, r2) to the lead SNP for each dataset, shown as a purple diamond. G) Each point is a variant, plotted by the strength of association with milk gene expression (y-axis) and breast cancer risk (x-axis). Colors are the same as the top panel in 2F, with a purple diamond representing the lead milk eQTL SNP. The pattern of variants in the top right suggests a shared underlying causal variant.
Figure 3.
Figure 3.. Effects of milk gene expression on HMO composition.
A) HMO concentration profiles (y-axis) for milk samples in our study (x-axis), grouped by secretor status. B) Correlation between ST6GAL1 gene expression in milk and normalized total HMO concentration, colored by secretor status (beta = 0.75, P = 7.2×10⁻⁵, q-value = 0.08.). C) Gene ontology enrichment of genes with expression correlated to a single HMO or HMO category. The most significant term for each HMO is plotted. The dashed vertical line denotes a q-value of 10%. D) Relationships between genotype at the lead SNP at the FUT2 eQTL and FUT2 expression in milk (green) or 2’FL abundance (purple). E) Relationships between genotype at the lead SNP at the GCNT3 eQTL and GCNT3 expression in milk (green) or FLNH abundance (purple). F) Estimates of the effect of milk gene expression of candidate HMO-biosynthesis pathway genes on the abundance of HMOs, from a Wald ratio test. Some genes had significant effects on more than one HMO (Table S11). The most significant HMO for each gene is plotted here.
Figure 4.
Figure 4.. Interactions between milk gene expression and the infant fecal microbiome.
A) Principal components analysis of infant fecal microbiome metagenomic data, summarized at the taxonomic level, with each point representing a fecal sample and colors representing infant age (light blue: 1 month; dark blue: 6 months). B) Sparse canonical correlation analysis integrating milk host gene expression and infant fecal microbial species or microbial gene pathway relative abundances (at 1 month of age) identified six significant sparse components (in rows). The heatmap on the left shows correlation coefficients between each mother/infant pairs’ score for a given sparse component and clinical data (in columns). The table lists the top most highly weighted microbial taxon or genetic pathway, and most significantly enriched host gene set in milk gene expression. (+) or (−) indicates if these features were positively or negatively weighted in the sparse component. C-D) Network diagrams generated using the correlation matrix of infant fecal microbial species/pathways and milk-expressed host genes within an enriched pathway for two of the sparse components in (B). Line size corresponds to the absolute value of correlation coefficient, line type correspond to negative (dashed) or positive (solid) correlations. Node color signifies milk-expressed host genes (green), infant fecal microbial pathways/taxa (green), or milk traits (yellow). E) Network diagram displaying correlations between milk IL-6 concentration, JAK/STAT pathway genes expressed in milk, and Bifidobacterium infantis relative abundance and estimated growth rate in the infant gut at 1 month. JAK/STAT pathway genes were selected that had a significant correlation with either B. infantis trait after multiple test correction (q-value<10%). F) Q-Q plot showing expected (x-axis) vs. observed (y-axis) p-values from association tests between maternal genotype at milk-specific eQTLs and relative abundances of infant fecal microbial taxa/pathways. Top associations are labeled with the gene name. G) Details on 8 associations (rows) between milk eQTL and infant fecal microbe abundance that passed q-value<25%. H-I) Associations between maternal genotype at a milk-specific eQTL with the expression of that gene in milk (green, left), and with the relative abundance of an infant microbiome feature (blue, right).

References

    1. Lefèvre C. M., Sharp J. A. & Nicholas K. R. Evolution of lactation: ancient origin and extreme adaptations of the lactation system. Annu. Rev. Genomics Hum. Genet. 11, 219–238 (2010). - PubMed
    1. Victora C. G. et al. Breastfeeding in the 21st century: epidemiology, mechanisms, and lifelong effect. Lancet 387, 475–490 (2016). - PubMed
    1. Ballard O. & Morrow A. L. Human milk composition: nutrients and bioactive factors. Pediatr. Clin. North Am. 60, 49–74 (2013). - PMC - PubMed
    1. Andreas N. J., Kampmann B. & Mehring Le-Doare K. Human breast milk: A review on its composition and bioactivity. Early Hum. Dev. 91, 629–635 (2015). - PubMed
    1. Christian P. et al. The need to study human milk as a biological system. Am. J. Clin. Nutr. (2021) doi:10.1093/ajcn/nqab075. - DOI - PMC - PubMed

Publication types