[Preprint]. 2023 Jan 23:2023.01.23.525189.
doi: 10.1101/2023.01.23.525189.

Compressed phenotypic screens for complex multicellular models and high-content assays

Affiliations

Compressed phenotypic screens for complex multicellular models and high-content assays

Benjamin E Mead et al. bioRxiv. .

Abstract

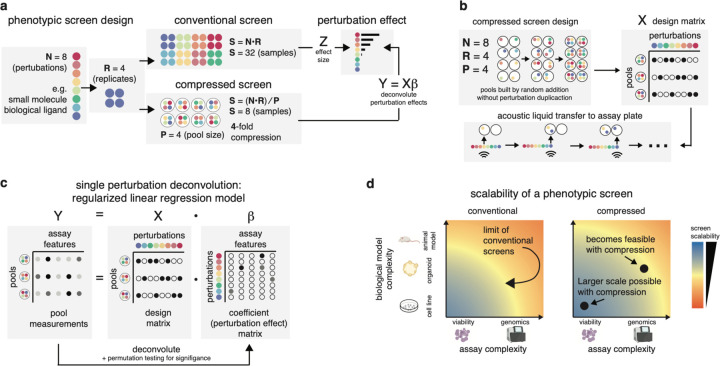
High-throughput phenotypic screens leveraging biochemical perturbations, high-content readouts, and complex multicellular models could advance therapeutic discovery yet remain constrained by limitations of scale. To address this, we establish a method for compressing screens by pooling perturbations followed by computational deconvolution. Conducting controlled benchmarks with a highly bioactive small molecule library and a high-content imaging readout, we demonstrate increased efficiency for compressed experimental designs compared to conventional approaches. To prove generalizability, we apply compressed screening to examine transcriptional responses of patient-derived pancreatic cancer organoids to a library of tumor-microenvironment (TME)-nominated recombinant protein ligands. Using single-cell RNA-seq as a readout, we uncover reproducible phenotypic shifts induced by ligands that correlate with clinical features in larger datasets and are distinct from reference signatures available in public databases. In sum, our approach enables phenotypic screens that interrogate complex multicellular models with rich phenotypic readouts to advance translatable drug discovery as well as basic biology.


Conflict of interest statement

Declaration of Interests A.K.S. reports compensation for consulting and/or SAB membership from Merck, Honeycomb Biotechnologies, Cellarity, Repertoire Immune Medicines, Hovione, Third Rock Ventures, Ochre Bio, FL82, Empress Therapeutics, Relation Therapeutics, Senda Biosciences, IntrECate biotherapeutics, Santa Ana Bio and Dahlia Biosciences unrelated to this work. B.E.M. reports compensation for consulting from Empress Therapeutics unrelated to this work. S.R. holds equity in Amgen. P.C.B. is a consultant to or holds equity in 10X Genomics, General Automation Lab Technologies/Isolation Bio, Celsius Therapeutics, Next Gen Diagnostics, Cache DNA, Concerto Biosciences, Stately, Ramona Optics, and Bifrost. W.C.H. is a consultant for Thermo Fisher, Solasta Ventures, MPM Capital, KSQ Therapeutics, Tyra Biosciences, Jubilant Therapeutics, RAPPTA Therapeutics, Function Oncology, Riva Therapeutics, Serinus Biosciences, Frontier Medicines and Calyx.

Figures

Extended Data Figure 1:
Extended Data Figure 1:. Developing compressed screening by screening 316 small molecules in the U2Os cell line with a Cell Painting readout
a, Histogram of the log Mahalanobis distance between each small molecule perturbation and the mean of the distribution of negative control cells (DMSO) at 6 hours, 24 hours, and 28 hours. For each time point, the coefficient of variation of the log Mahalanobis distances (mean / std. deviation) is reported to assess how broad the range of effects is. b, Histogram of the log Mahalanobis distance between each small molecule perturbation and the mean of the distribution of negative control cells (DMSO) for the 24 hours timepoint at three doses: 0.1, 1, and 10 µM. For each dose, the coefficient of variation of the log Mahalanobis distances (mean / std. deviation) is reported. c, Composite cell painting images from each GT perturbation cluster in the GT screen as well as from top hits from the CS screen. d, Scatterplot of non-zero enrichment scores for each perturbation in each GT phenotype e, UMAP of all samples in the GT dataset colored by GT perturbation cluster.
Extended Data Figure 2:
Extended Data Figure 2:. PDAC compressed screen scRNA-seq quality metrics and cNMF modules
a, Scatter plot of the number of cells per perturbation across all pools in each replicate plate. b, Violin plots of the number of UMIs, the number of unique genes, and the percent of genes that are mitochondrial in the compressed scRNA-seq dataset. c, Heatmap of the pairwise correlations of cNMF modules by usage across cells. d, Top three genes by gene spectra score for the highly variable cNMF modules. e, UMAP visualization all cells from both compressed screens, colored by cNMF module usage. f, UMAP visualizations all cells from both compressed screens, colored by density of cells from pools containing specific ligands. g, Ordered scatter plot of mean cognate receptor expression for each screened ligand over control PDAC cells in the compressed scRNA-seq dataset, colored by ligands with significant effects on identified cNMF GEPs.
Extended Data Figure 3:
Extended Data Figure 3:. Single ligand perturbation experiment scRNA-seq quality metrics and cNMF modules
a, Violin plots of the number of UMIs, the number of unique genes, and the percent of genes that are mitochondrial in the single-ligand scRNA-seq dataset. b, Heatmap of the top three genes by gene spectra score for the single ligand cNMF modules that corresponded with the highly variable compressed cNMF modules. c, Heatmaps visualizing the Pearson correlation across cells of the usage of the select single-ligand cNMF gene expression programs and the module score for existing gene signatures. d, Violin plot of the Moffit classical module score – Moffit basal module score for all cells from organoids grown in media only from the different single ligand experiments. e, Heatmap of the non-zero regression coefficients by ligand for all single ligand cNMF modules corresponding with the highly variable cNMF modules from the compressed screen. f, Venn diagrams of the number of intersecting and unique genes between the cNMF type 2 immunity GEP and corresponding signatures in MsigDB.
Figure 1:
Figure 1:. Compressed screening with high-fidelity model systems and high-content assays
a, Comparison of the number of samples required to conduct a phenotypic screen in a conventional and compressed manner with N=8 perturbations and R=4 replicates of each perturbation. b, Visualization of the construction of a compressed screen with an acoustic liquid handler. c, Regression framework for inferring the effects of individual perturbations in a compressed screen: We solve for the coefficient matrix (β) that describes the effect of perturbations (whose assignment to pools is denoted in the design matrix X) on the measured features of the screen (matrix Y). d, Conceptual visualization of how assay and biological model complexity may limit the scalability of conventional screens, as well as how this scalability boundary may be increased in a compressed screen.
Figure 2:
Figure 2:. Compressed screening identifies compounds with largest effects in a ground truth setting
a, Overview of screens (ground truth (GT) and compressed screens (CS)) and analytical approach for validating the technology and assessing the maximum compression factor that is feasible. b, Heatmaps of the GT cellular phenotypes that each GT perturbation cluster is enriched in (fingerprint z-score), as well as the average number of cells per well and Mahalanobis distance for each GT perturbation cluster. c, Heatmap of the Fisher’s exact enrichments (-log10(p value)) of the features differentially utilized by each GT phenotype (log2 fold change > 3) in the 7 types of Cell Painting features. Bottom bar visualizes the mean number of cells per well across all samples in each GT phenotype. d, Scatterplots of the inferred perturbation effects in a compressed screen (Scaled L1 norm) vs. the GT effect (Mahalanobis distance) for two replicate runs (6X compression, 5 replicates of each perturbation) with distinct pool randomization. r, Pearson correlation, CS run1: p value < 2.2*10−16, CS run 2: p value < 2.2*10−16). e, Dotplot of the mean scaled L1 norm of the perturbations called as hits (scaled L1 norm > 0) in both replicate compressed screens at each pool size, as well as the GT perturbation cluster and GT Mahalanobis distance of each perturbation. f, Scatterplot over all pool sizes of the fraction of perturbation hits in the CS screen that were significantly enriched in a biological phenotype in the GT screen, for three permute test significance levels (blue – p value < 0.05, green – p value < 0.01, red – p value < 0.001). g, ROC curves for each pool size in both CS screens displaying the changes in the true positive and false positive rates for identifying GT significant perturbations as hits in CS screens that occur when varying the permutation testing threshold in deconvolution from 0 to 1 by steps of 0.01.
Figure 3:
Figure 3:. Compressed screen of biological ligands in PDAC organoids reveals major axes of transcriptional response.
a, Overview of biological ligand compressed screen with PDAC organoids and scRNA-seq analysis approach b, Heatmaps visualizing the Pearson correlation across cells of the usage of the cNMF gene expression programs and the module score for existing gene signatures. c, Scatterplot of significant ligand – cNMF module effects (deconvolution regression coefficients) from two compressed screens with distinct random pooling. d, Heatmap of the mean ligand – cNMF module effect over both compressed screens.
Figure 4:
Figure 4:. Context specific signatures from compressed screening validate and recontextualize existing primary tumor data
a, Overview of single-ligand validation experiments and dataset. b, Heatmap of the Pearson correlations of select compressed and single-ligand cNMF modules. c, Heatmap of the significant (adj. p value < 0.05) non-zero regression coefficients by ligand for five cNMF modules of interest. d, Heatmap of the Pearson correlation across PDAC tumors from TCGA bulk RNA-seq data of the expression of the classical or basal transcriptional states with the expression of each cNMF module. e, Heatmap of the Pearson correlation across malignant single cells from PDAC tumors from Raghavan et al of the expression of the f, Scatterplots of the correlation of the classical score across PDAC tumors from TCGA bulk RNA-seq with the score of the type 2 immunity GEP and two IL-4 transcriptional signatures from MsigDB. g, Scatterplots of the correlation of the classical score across malignant cells in PDAC tumors from Raghavan et al with the score of the type 2 immunity GEP and two IL-4 transcriptional signatures from MsigDB. h, Violin plot of IL4I1 expression in macrophage subtypes in the Raghavan et al dataset.

References

    1. Joyce A.R., and Palsson B.Ø. (2006). The model organism as a system: integrating “omics” data sets. Nat. Rev. Mol. Cell Biol. 7, 198–210. 10.1038/nrm1857. - DOI - PubMed
    1. Eder J., Sedrani R., and Wiesmann C. (2014). The discovery of first-in-class drugs: Origins and evolution. Nat. Rev. Drug Discov. 13, 577–587. 10.1038/nrd4336. - DOI - PubMed
    1. Swinney D.C., and Anthony J. (2011). How were new medicines discovered? Nat. Rev. Drug Discov. 10, 507–519. 10.1038/nrd3480. - DOI - PubMed
    1. Moffat J.G., Vincent F., Lee J.A., Eder J., and Prunotto M. (2017). Opportunities and challenges in phenotypic drug discovery: an industry perspective. Nat. Rev. Drug Discov. 16, 531–543. 10.1038/nrd.2017.111. - DOI - PubMed
    1. Swinney D.C. (2013). Phenotypic vs. target-based drug discovery for first-in-class medicines. Clin. Pharmacol. Ther. 93, 299–301. 10.1038/clpt.2012.236. - DOI - PubMed

Publication types