. 2022 Dec;8(12):mgen000863.
doi: 10.1099/mgen.0.000863.

An ST131 clade and a phylogroup A clade bearing an O101-like O-antigen cluster predominate among bloodstream Escherichia coli isolates from South-West Nigeria hospitals

Affiliations

An ST131 clade and a phylogroup A clade bearing an O101-like O-antigen cluster predominate among bloodstream Escherichia coli isolates from South-West Nigeria hospitals

Ayorinde O Afolayan et al. Microb Genom. 2022 Dec.

Abstract

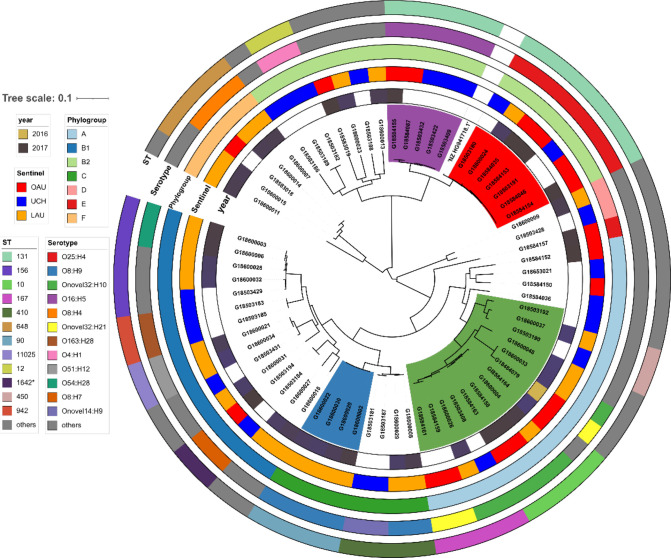
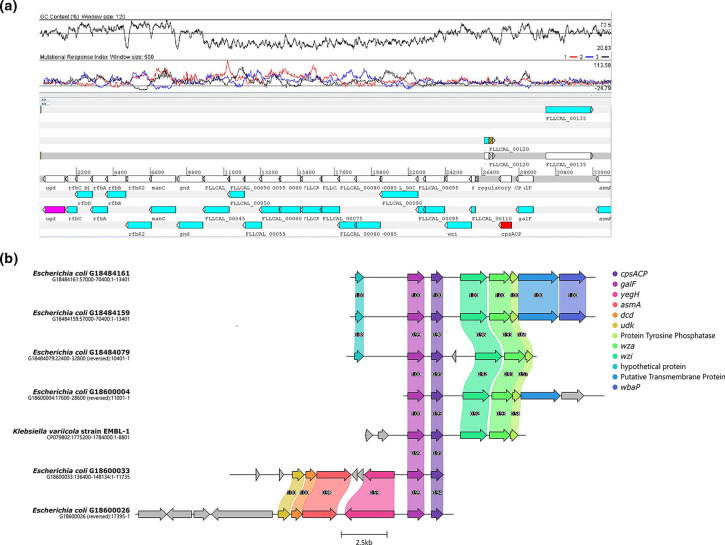
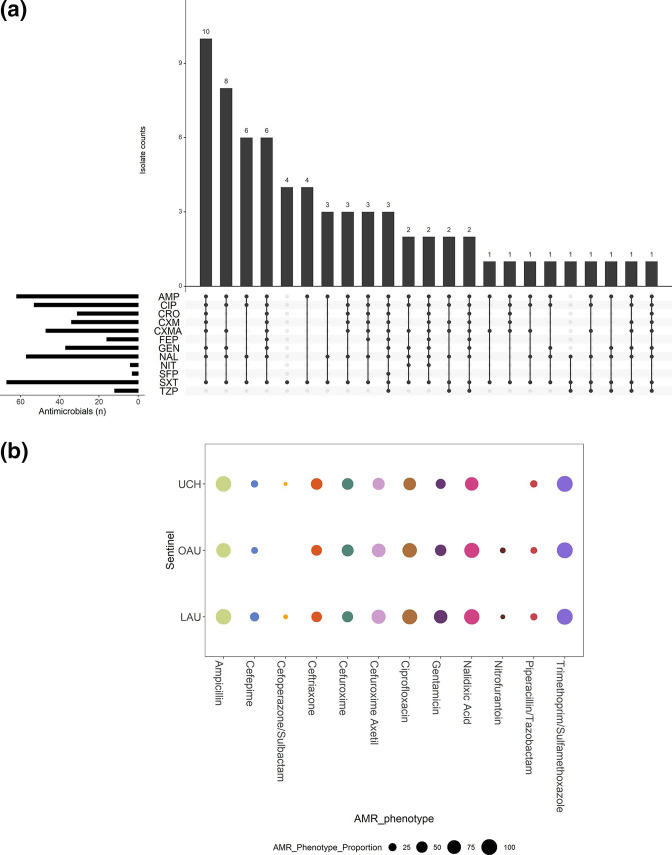
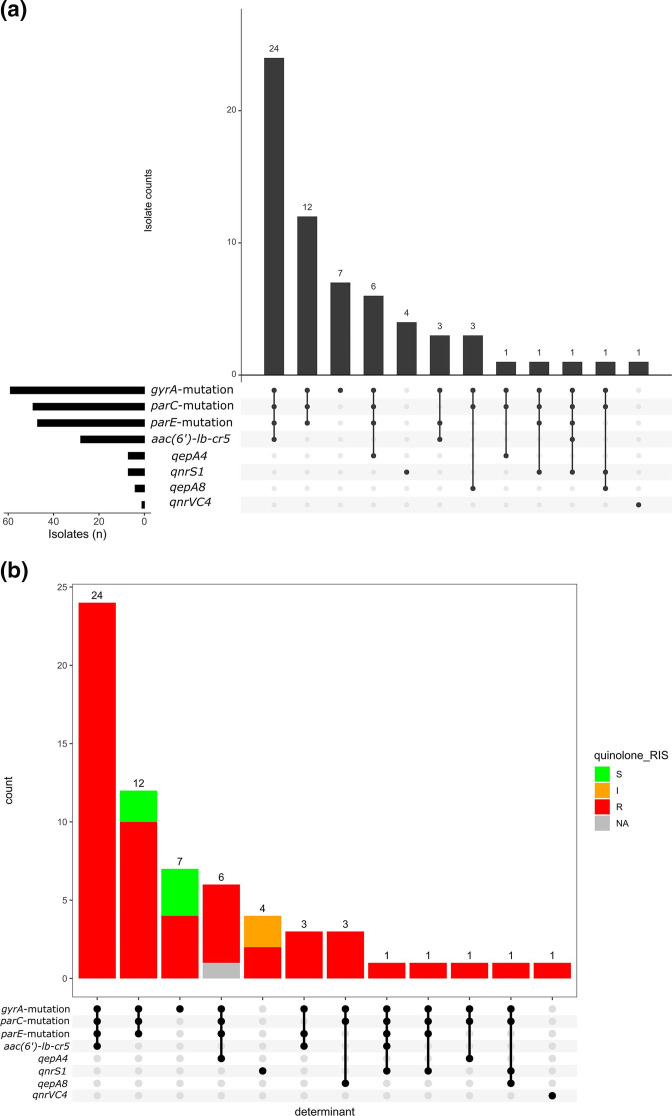
Escherichia coli bloodstream infections are typically attributed to a limited number of lineages that carry virulence factors associated with invasiveness. In Nigeria, the identity of circulating clones is largely unknown and surveillance of their antimicrobial resistance has been limited. We verified and whole-genome sequenced 68 2016-2018 bloodstream E. coli isolates from three sentinel sites in South-Western Nigeria and susceptibility tested 67 of them. Resistance to antimicrobials commonly used in Nigeria was high, with 67 (100 %), 62 (92.5 %), 53 (79.1 %) and 37 (55.2 %) showing resistance to trimethoprim, ampicillin, ciprofloxacin and aminoglycosides, respectively. Thirty-five (51 %) isolates carried extended-spectrum β-lactamase genes and 32 (91 %) of these were multidrug resistant. All the isolates were susceptible to carbapenems and colistin. The strain set included globally disseminated high-risk clones from sequence type (ST)12 (2), ST131 (12) and ST648 (4). Twenty-three (33.8 %) of the isolates clustered within two clades. The first of these consisted of ST131 strains, comprising O16:H5 and O25:H4 sub-lineages. The second was an ST10-ST167 complex clade comprising strains carrying O-antigen and capsular genes of likely Klebsiella origin, identical to those of avian pathogenic E. coli Sanji, and serotyped in silico as O89, O101 or ONovel32, depending on the tool used. Four temporally associated ST90 strains from one sentinel were closely related enough to suggest that at least some of them represented a retrospectively detected outbreak cluster. Our data implicate a broad repertoire of E. coli isolates associated with bloodstream infections in South-West Nigeria. Continued genomic surveillance is valuable for tracking clones of importance and for outbreak identification.

Keywords: Escherichia coli; Nigeria; ST131; antimicrobial resistance; cpsACP; genomic surveillance.


Conflict of interest statement

The authors declare that there are no conflicts of interest.

Figures

Fig. 1.
Fig. 1.
Maximum-likelihood SNP tree of bloodstream E. coli isolates sequenced for this study. The tree scale shows substitutions per site based on alignment length. The purple-coloured clade represents ST131 lineage 1 (O16:H5 serotype); the red clade represents the ST131 lineage 2 (O25:H4 serotype); the light green clade represents the ST10–ST167 clade. The light blue clade marks the cluster from a single site representing a likely outbreak clone of ST90.
Fig. 2.
Fig. 2.
(a) Comparison of virulence genes among isolates clustered within phylogroups A–C. The graph shows the prevalence of virulence factors in isolates within phylogroups containing more than five isolates: A (n=18), phylogroup B1 (n=15), phylogroup B2 (n=19) and phylogroup C (n=8). Using Fisher’s test (P<0.05), only the VAGs significantly more prevalent in at least one phylogroup are shown. (b) Biofilm formation in 67 strains, measured as A 570 of crystal violet eluted from fixed and stained 6 h biofilms. Each dot represents data from a single strain belonging to the phylogroup listed on the x-axis. Horizontal bars mark the median for each phylogroup, outliers inclusive due to the small number of tested strains in each phylogroup. The A 570 values for isolates carrying the cpsACP gene are represented as red dots.
Fig. 3.
Fig. 3.
(a) Comparison of virulence genes between ST131 (n=12) and non-ST131 (n=56) isolates. Using Fisher’s test (P<0.05, Bonferroni corrected), only the VAGs significantly more prevalent in the STs are shown. (b) Virulence factor profile of isolates belonging to ST131. The presence or absence of a virulence gene is indicated by a red or white colour on the heatmap, respectively. (c) AMR phenotype profile and AMR genotype profile (uppercase headers, apart from qacEdelta1) of isolates belonging to ST131. The presence or absence of plasmid Inc types is indicated by a red or white colour on the heatmap, respectively. Tree scales in (b) and (c) show substitutions per site based on alignment length.
Fig. 4.
Fig. 4.
(a) Comparison of virulence genes between Onovel32 (n=11) and non-Onovel32 (n=57) clade isolates. Using Fisher’s test (P <0.05, Bonferroni corrected), only the virulence genes significantly more prevalent are shown. The cpsACP gene and the ugd gene bars are coloured red and magenta, respectively. (b) Onovel32 clade isolates belonging to the STs ST10, ST167 and their locus variants belong to phylogroup A. The presence or absence of a virulence gene is indicated by a red or white colour on the heatmap, respectively.
Fig. 5.
Fig. 5.
(a) Schematic cluster in ST1294 ONovel32 chromosome that includes the ugd and cpsACP genes. The genes within the cluster are syntenic and identical with a cluster from K. variicola (accession no. CP079802.1). Above the schematic depiction of genes is a G+C content plot and mutational response index plot. (b) Comparison of the ONovel32 cluster with the analogous cluster in K. variicola strain EMBL-1.
Fig. 6.
Fig. 6.
Resistance profile of ExPEC isolates. The main bar chart demonstrates the number of ExPEC isolates with each combination of resistance to tested antibiotics, and is ordered in descending order by the frequency of resistance profiles observed among 67 ExPEC isolates. The side bar chart demonstrates the number of isolates that are resistant to each of the named antibiotics. The dots and lines between dots at the base of the main bar chart (and the right side of the side bar chart) show the co-resistance status of the ExPEC isolates. All isolates were susceptible to amikacin, meropenem, imipenem and ertapenem. AMP, Ampicillin; CIP, ciprofloxacin; CRO, ceftriaxone; CXM, cefuroxime; CXMA, cefuroxime axetil; FEP, cefepime; GEN, gentamicin; NAL. nalidixic acid; NIT, nitrofurantoin; SFP, cefoperazone/sulbactam; SXT, trimethoprim/sulfamethoxazole; TZP, piperacillin/tazobactam. (b) AMR phenotypes of ExPEC Isolates, stratified by sentinel site [LAU (n=28), OAU (n=22), UCH (n=21)]. The size of the coloured circles represents the proportion of isolates recovered from each sentinel site that demonstrated resistance to the tested antibiotics.
Fig. 7.
Fig. 7.
Quinolone-resistance gene combinations in ExPEC isolates. The upset plots (a, b) show the number of ExPEC isolates carrying each combination of genes conferring resistance to the quinolones, and (b) is coloured by the proportion of observed phenotypic antimicrobial susceptibility, and is ordered in descending order by the frequency of resistance gene profiles observed. The side bar chart in (a) demonstrates the number of isolates that carry each of the resistance genes. The dots and lines between dots at the base of the main bar chart (and the right side of the side bar chart) show the co-resistance gene profile of the ExPEC isolates. NA, phenotypic antimicrobial-susceptibility data for the isolate is absent.

References

    1. de Kraker MEA, Jarlier V, Monen JCM, Heuer OE, van de Sande N, et al. The changing epidemiology of bacteraemias in Europe: trends from the European antimicrobial resistance surveillance system. Clin Microbiol Infect. 2013;19:860–868. doi: 10.1111/1469-0691.12028. - DOI - PubMed
    1. Foxman B. The epidemiology of urinary tract infection. Nat Rev Urol. 2010;7:653–660. doi: 10.1038/nrurol.2010.190. - DOI - PubMed
    1. Manges AR, Geum HM, Guo A, Edens TJ, Fibke CD, et al. Global extraintestinal pathogenic Escherichia coli (ExPEC) lineages. Clin Microbiol Rev. 2019;32:e00135-18. doi: 10.1128/CMR.00135-18. - DOI - PMC - PubMed
    1. Johnson JR, Russo TA. Molecular epidemiology of extraintestinal pathogenic Escherichia coli . EcoSal Plus. 2018;8:ESP-0004-2017. doi: 10.1128/ecosalplus.ESP-0004-2017. - DOI - PMC - PubMed
    1. Sarowska J, Futoma-Koloch B, Jama-Kmiecik A, Frej-Madrzak M, Ksiazczyk M, et al. Virulence factors, prevalence and potential transmission of extraintestinal pathogenic Escherichia coli isolated from different sources: recent reports. Gut Pathog. 2019;11:10. doi: 10.1186/s13099-019-0290-0. - DOI - PMC - PubMed

Publication types