Review
. 2023 Mar;306(3):e222575.
doi: 10.1148/radiol.222575. Epub 2023 Feb 7.

Beyond Breast Density: Risk Measures for Breast Cancer in Multiple Imaging Modalities

Affiliations
Review

Beyond Breast Density: Risk Measures for Breast Cancer in Multiple Imaging Modalities

Raymond J Acciavatti et al. Radiology. 2023 Mar.

Abstract

Breast density is an independent risk factor for breast cancer. In digital mammography and digital breast tomosynthesis, breast density is assessed visually using the four-category scale developed by the American College of Radiology Breast Imaging Reporting and Data System (5th edition as of November 2022). Epidemiologically based risk models, such as the Tyrer-Cuzick model (version 8), demonstrate superior modeling performance when mammographic density is incorporated. Beyond just density, a separate mammographic measure of breast cancer risk is parenchymal textural complexity. With advancements in radiomics and deep learning, mammographic textural patterns can be assessed quantitatively and incorporated into risk models. Other supplemental screening modalities, such as breast US and MRI, offer independent risk measures complementary to those derived from mammography. Breast US allows the two components of fibroglandular tissue (stromal and glandular) to be visualized separately in a manner that is not possible with mammography. A higher glandular component at screening breast US is associated with higher risk. With MRI, a higher background parenchymal enhancement of the fibroglandular tissue has also emerged as an imaging marker for risk assessment. Imaging markers observed at mammography, US, and MRI are powerful tools in refining breast cancer risk prediction, beyond mammographic density alone.


Conflict of interest statement

Disclosures of conflicts of interest: R.J.A. Grants from the Breast Cancer Alliance, Burroughs Wellcome Fund, U.S. Department of Defense Breast Cancer Research Program, and National Institutes of Health (NIH); patents planned, issued, or pending. S.H.L. No relevant relationships. B.R. No relevant relationships. L.M. Editor, Radiology; grants from Siemens Healthcare, Gordon and Betty Moore Foundation, Mary Kay Foundation, and Google; personal fees, Lunit Insight, iCAD advisory board, Guerbet; meeting and travel expenses, British Society of Breast Radiology and European Society of Breast Imaging. E.F.C. Grants or contracts from iCAD, Hologic, and OM1; payment or honoraria from MedScape and Aunt Minnie; lecture travel support from the RSNA for European Congress of Radiology 2022; advisory board, iCAD and Hologic; current board member, Society of Breast Imaging. D.K. Grants from NIH; institutional research agreement with iCAD; patents planned, issued, or pending. W.K.M. Institutional research grant from Bayer.

Figures

None
Graphical abstract
Mediolateral oblique digital mammograms illustrating the four
categories of visually assessed breast density according to the 5th edition
of the Breast Imaging Reporting and Data System show (A) breast that is
almost entirely fatty; (B) breast with scattered areas of fibroglandular
density; (C) breast that is heterogeneously dense, which may obscure
detection of small masses; and (D) breast that is extremely dense, which
lowers the sensitivity of mammography. Of note, with increasing higher
density, there is a higher risk of breast cancer.
Figure 1:
Mediolateral oblique digital mammograms illustrating the four categories of visually assessed breast density according to the 5th edition of the Breast Imaging Reporting and Data System show (A) breast that is almost entirely fatty; (B) breast with scattered areas of fibroglandular density; (C) breast that is heterogeneously dense, which may obscure detection of small masses; and (D) breast that is extremely dense, which lowers the sensitivity of mammography. Of note, with increasing higher density, there is a higher risk of breast cancer.
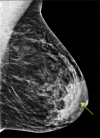
Mediolateral oblique screening digital mammogram in a 56-year-old
woman shows dense tissue in the anterior subareolar area of the breast
(arrow). If assigned a Breast Imaging Reporting and Data System (BI-RADS)
breast density based on the 4th edition, the percent density in the breast
would be less than 51% and, therefore, would be considered category 2 or
“scattered fibroglandular densities.” However, if classified
according to the 5th Edition of BI-RADS for density, the dense tissue in the
anterior breast could “mask” or obscure a lesion, causing a
reduction in detection sensitivity. Based on the density definitions in the
5th Edition, this breast would be considered “heterogeneously dense,
which may obscure detection of small masses.”
Figure 2:
Mediolateral oblique screening digital mammogram in a 56-year-old woman shows dense tissue in the anterior subareolar area of the breast (arrow). If assigned a Breast Imaging Reporting and Data System (BI-RADS) breast density based on the 4th edition, the percent density in the breast would be less than 51% and, therefore, would be considered category 2 or “scattered fibroglandular densities.” However, if classified according to the 5th Edition of BI-RADS for density, the dense tissue in the anterior breast could “mask” or obscure a lesion, causing a reduction in detection sensitivity. Based on the density definitions in the 5th Edition, this breast would be considered “heterogeneously dense, which may obscure detection of small masses.”
Mediolateral oblique digital mammograms in four different women show
effectively equivalent volumetric percent density (approximately 25%) but
broad variation in the total dense volumes, which range from 62 mL to 233
mL. Volume-based density measures include the total dense volume (sum total
of all fibroglandular pixel volumes) and volumetric percent
density
Figure 3:
Mediolateral oblique digital mammograms in four different women show effectively equivalent volumetric percent density (approximately 25%) but broad variation in the total dense volumes, which range from 62 mL to 233 mL. Volume-based density measures include the total dense volume (sum total of all fibroglandular pixel volumes) and volumetric percent density.
(A, B) Digital mammographic heat maps show radiomic feature
calculations in the breast area; for example, skewness (A) (a gray-scale
feature) and entropy (B) (a co-occurrence feature). (C) To capture
heterogeneities in breast texture in the breast area (dashed yellow line),
radiomic features can be calculated in multiple windows whereby each window
(example in red, with the length of each side defined as W) is centered on a
lattice point (blue circle) and green lines define the lattice grid, with
the spacing between lattice points defined as D. (Reprinted, with
permission, from reference 38.)
Figure 4:
(A, B) Digital mammographic heat maps show radiomic feature calculations in the breast area; for example, skewness (A) (a gray-scale feature) and entropy (B) (a co-occurrence feature). (C) To capture heterogeneities in breast texture in the breast area (dashed yellow line), radiomic features can be calculated in multiple windows whereby each window (example in red, with the length of each side defined as W) is centered on a lattice point (blue circle) and green lines define the lattice grid, with the spacing between lattice points defined as D. (Reprinted, with permission, from reference .)
 Mediolateral oblique digital mammograms with negative findings at
screening in women with (A) high density and high complexity, (B) high
density and low complexity, (C) low density and high complexity, and (D) low
density and low complexity. Breast density is associated with higher risk
for developing breast cancer. In addition, breasts with more complex
parenchymal patterns are at higher risk for breast cancer. These parenchymal
patterns were assessed with handcrafted radiomic features to develop an
overall complexity score. (Reprinted, with permission, from reference
39.)
Figure 5:
Mediolateral oblique digital mammograms with negative findings at screening in women with (A) high density and high complexity, (B) high density and low complexity, (C) low density and high complexity, and (D) low density and low complexity. Breast density is associated with higher risk for developing breast cancer. In addition, breasts with more complex parenchymal patterns are at higher risk for breast cancer. These parenchymal patterns were assessed with handcrafted radiomic features to develop an overall complexity score. (Reprinted, with permission, from reference .)
(A, B) Mammograms (left) of heterogeneously dense breasts are analyzed
in terms of a convolutional neural network–based pixel-wise risk
model (right), which identifies the breast at higher risk for cancer (A) by
having more substantial areas in red, corresponding to features that overlap
with patients who developed breast cancer, as opposed to normal (blue)
areas. (C, D) Similarly, among two breasts with scattered areas of
fibroglandular density at mammography (left), the breast at higher risk for
cancer (C) is identified by having more substantial red areas (right).
(Reprinted, with permission, from reference 48.)
Figure 6:
(A, B) Mammograms (left) of heterogeneously dense breasts are analyzed in terms of a convolutional neural network–based pixel-wise risk model (right), which identifies the breast at higher risk for cancer (A) by having more substantial areas in red, corresponding to features that overlap with patients who developed breast cancer, as opposed to normal (blue) areas. (C, D) Similarly, among two breasts with scattered areas of fibroglandular density at mammography (left), the breast at higher risk for cancer (C) is identified by having more substantial red areas (right). (Reprinted, with permission, from reference .)
Top: Classification of tissue composition at breast US according to
the Breast Imaging Reporting and Data System, 5th edition. Representative US
images show (A) homogeneous background echotexture (fat), (B) homogeneous
background echotexture (fibroglandular), and (C) heterogeneous background
echotexture. Bottom: Corresponding craniocaudal mammograms show (A) almost
entirely fat, (B) extremely dense, and (C) heterogeneously dense or
scattered fibroglandular tissue at mammography.
Figure 7:
Top: Classification of tissue composition at breast US according to the Breast Imaging Reporting and Data System, 5th edition. Representative US images show (A) homogeneous background echotexture (fat), (B) homogeneous background echotexture (fibroglandular), and (C) heterogeneous background echotexture. Bottom: Corresponding craniocaudal mammograms show (A) almost entirely fat, (B) extremely dense, and (C) heterogeneously dense or scattered fibroglandular tissue at mammography.
(A) Handheld breast US and (B) automated breast US images show
qualitative four-category classification of the glandular tissue component
in women with dense breasts. When distribution of the glandular tissue
component in the breast is not uniform, the dominant pattern seen in at
least two quadrants, or in the area of densest fibroglandular tissue, is
subjectively determined to be the glandular tissue component.
Figure 8:
(A) Handheld breast US and (B) automated breast US images show qualitative four-category classification of the glandular tissue component in women with dense breasts. When distribution of the glandular tissue component in the breast is not uniform, the dominant pattern seen in at least two quadrants, or in the area of densest fibroglandular tissue, is subjectively determined to be the glandular tissue component.
Spectrum of sonographic and histologic appearance of dense breasts at
mammography. (A) Craniocaudal mammograms show extremely dense fibroglandular
tissue in both cases. (B) Breast US images show predominately hyperechoic
fibrous tissue at one end (left) and abundant isoechoic or hypoechoic
glandular tissue at the other end (right) of the spectrum. (C) Histologic
images (hematoxylin-eosin [H&E] stain; original magnification, x200)
show the breast lobules are involuted and replaced by fibrous stroma in the
former case (left), whereas the lobular involution is minimal and the size
and number of acini per lobule is large in the latter case (right). GTC =
glandular tissue component. (Reprinted, with permission, from reference
70.)
Figure 9:
Spectrum of sonographic and histologic appearance of dense breasts at mammography. (A) Craniocaudal mammograms show extremely dense fibroglandular tissue in both cases. (B) Breast US images show predominately hyperechoic fibrous tissue at one end (left) and abundant isoechoic or hypoechoic glandular tissue at the other end (right) of the spectrum. (C) Histologic images (hematoxylin-eosin [H&E] stain; original magnification, x200) show the breast lobules are involuted and replaced by fibrous stroma in the former case (left), whereas the lobular involution is minimal and the size and number of acini per lobule is large in the latter case (right). GTC = glandular tissue component. (Reprinted, with permission, from reference .)
Qualitative background parenchymal enhancement (BPE) assessment
according to the Breast Imaging Reporting and Data System lexicon. Axial,
subtracted, postcontrast, maximum intensity projection breast MRI scans show
(A) minimal, (B) mild, (C) moderate, and (D) marked BPE in four
patients.
Figure 10:
Qualitative background parenchymal enhancement (BPE) assessment according to the Breast Imaging Reporting and Data System lexicon. Axial, subtracted, postcontrast, maximum intensity projection breast MRI scans show (A) minimal, (B) mild, (C) moderate, and (D) marked BPE in four patients.
Images in a 46-year-old woman at high risk for breast cancer due to
strong family history (calculated lifetime risk of 33%). Screening MRI
demonstrated extreme fibroglandular tissue. (A) Axial, subtracted,
postcontrast maximum intensity projection MRI scan shows moderate background
parenchymal enhancement (BPE) and a mass in the left axillary tail (circle).
(B) Postcontrast, T1-weighted subtracted axial MRI scan with the section
centered at the level of the left breast mass shows the enhancing irregular
mass (arrow) that was subsequently biopsied yielding moderately
differentiated carcinoma with mixed ductal and lobular features.A higher BPE
level has been associated with risk of breast cancer in women at high
risk.
Figure 11:
Images in a 46-year-old woman at high risk for breast cancer due to strong family history (calculated lifetime risk of 33%). Screening MRI demonstrated extreme fibroglandular tissue. (A) Axial, subtracted, postcontrast maximum intensity projection MRI scan shows moderate background parenchymal enhancement (BPE) and a mass in the left axillary tail (circle). (B) Postcontrast, T1-weighted subtracted axial MRI scan with the section centered at the level of the left breast mass shows the enhancing irregular mass (arrow) that was subsequently biopsied yielding moderately differentiated carcinoma with mixed ductal and lobular features.A higher BPE level has been associated with risk of breast cancer in women at high risk.
Images in a 34-year-old woman without family history of breast cancer
with newly diagnosed left breast cancer manifesting as a palpable lump. MRI
performed for extent of disease demonstrates heterogeneous fibroglandular
tissue. (A) Axial, subtracted, postcontrast maximum intensity projection MRI
scan shows minimal background parenchymal enhancement (BPE) and a mass in
the left lateral breast (arrow). (B) Postcontrast, T1-weighted subtracted
axial MRI scan with the section centered at the level of the left breast
mass shows the enhancing irregular mass (arrow) that was subsequently
biopsied yielding poorly differentiated invasive ductal carcinoma. Studies
show mixed results regarding the association between BPE and breast cancer
in patients at average risk (ie, without family history of breast cancer or
known deleterious genetic alteration).
Figure 12:
Images in a 34-year-old woman without family history of breast cancer with newly diagnosed left breast cancer manifesting as a palpable lump. MRI performed for extent of disease demonstrates heterogeneous fibroglandular tissue. (A) Axial, subtracted, postcontrast maximum intensity projection MRI scan shows minimal background parenchymal enhancement (BPE) and a mass in the left lateral breast (arrow). (B) Postcontrast, T1-weighted subtracted axial MRI scan with the section centered at the level of the left breast mass shows the enhancing irregular mass (arrow) that was subsequently biopsied yielding poorly differentiated invasive ductal carcinoma. Studies show mixed results regarding the association between BPE and breast cancer in patients at average risk (ie, without family history of breast cancer or known deleterious genetic alteration).

References

    1. Vachon CM , van Gils CH , Sellers TA , et al. . Mammographic density, breast cancer risk and risk prediction . Breast Cancer Res 2007. ; 9 ( 6 ): 217 . - PMC - PubMed
    1. Holland K , van Gils CH , Mann RM , Karssemeijer N . Quantification of masking risk in screening mammography with volumetric breast density maps . Breast Cancer Res Treat 2017. ; 162 ( 3 ): 541 – 548 . - PMC - PubMed
    1. Sherratt MJ , McConnell JC , Streuli CH . Raised mammographic density: causative mechanisms and biological consequences . Breast Cancer Res 2016. ; 18 ( 1 ): 45 . - PMC - PubMed
    1. Johns PC , Yaffe MJ . X-ray characterisation of normal and neoplastic breast tissues . Phys Med Biol 1987. ; 32 ( 6 ): 675 – 695 . - PubMed
    1. Checka CM , Chun JE , Schnabel FR , Lee J , Toth H . The relationship of mammographic density and age: implications for breast cancer screening . AJR Am J Roentgenol 2012. ; 198 ( 3 ): W292 – W295 . - PubMed

Publication types