. 2023 Apr 14;83(8):1203-1213.
doi: 10.1158/0008-5472.CAN-22-2236.

DNA Methylation Landscapes of Prostate Cancer Brain Metastasis Are Shaped by Early Driver Genetic Alterations

Affiliations

DNA Methylation Landscapes of Prostate Cancer Brain Metastasis Are Shaped by Early Driver Genetic Alterations

John Gallon et al. Cancer Res. .

Abstract

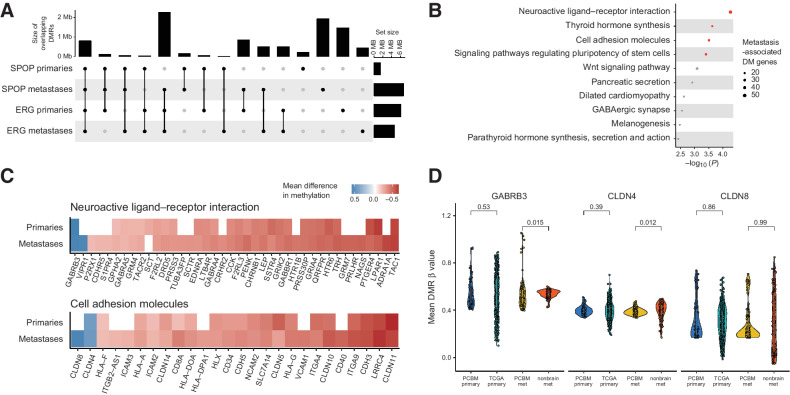
Metastases from primary prostate cancers to rare locations, such as the brain, are becoming more common due to longer life expectancy resulting from improved treatments. Epigenetic dysregulation is a feature of primary prostate cancer, and distinct DNA methylation profiles have been shown to be associated with the mutually exclusive SPOP-mutant or TMPRSS2-ERG fusion genetic backgrounds. Using a cohort of prostate cancer brain metastases (PCBM) from 42 patients, with matched primary tumors for 17 patients, we carried out a DNA methylation analysis to examine the epigenetic distinction between primary prostate cancer and PCBM, the association between epigenetic alterations and mutational background, and particular epigenetic alterations that may be associated with PCBM. Multiregion sampling of PCBM revealed epigenetic stability within metastases. Aberrant methylation in PCBM was associated with mutational background and PRC2 complex activity, an effect that is particularly pronounced in SPOP-mutant PCBM. While PCBM displayed a CpG island hypermethylator phenotype, hypomethylation at the promoters of genes involved in neuroactive ligand-receptor interaction and cell adhesion molecules such as GABRB3, CLDN8, and CLDN4 was also observed, suggesting that cells from primary tumors may require specific reprogramming to form brain metastasis. This study revealed the DNA methylation landscapes of PCBM and the potential mechanisms and effects of PCBM-associated aberrant DNA methylation.

Significance: DNA methylation analysis reveals the molecular characteristics of PCBM and may serve as a starting point for efforts to identify and target susceptibilities of these rare metastases.


Figures

Figure 1. The methylome of brain metastases from prostate cancer is largely inherited from primary tumors and is driven by genomic background. A, PCA using the 1% most variably methylated CpG sites from the Illumina EPIC array (8,038 sites). B, Spearman correlation between eigenvectors of PCs 1–10, with sample type (i.e., primary tumor vs. metastasis), patient, and mutational status (*, P < 0.05; **, P < 0.01; ***, P < 0.001). C, Euclidean distance between primary samples and normal prostate samples and between metastatic and normal samples. D, Euclidean distance between primary samples within each patient, metastatic samples within each patient, and between primary and metastatic samples within each patient. E, As in D, but comparison done between patients. PCBM primary n = 57, PCBM metastasis n = 95, normal prostate n = 2.
Figure 1.
The methylome of brain metastases from prostate cancer is largely inherited from primary tumors and is driven by genomic background. A, PCA using the 1% most variably methylated CpG sites from the Illumina EPIC array (8,038 sites). B, Spearman correlation between eigenvectors of PCs 1–10, with sample type (i.e., primary tumor vs. metastasis), patient, and mutational status. *, P < 0.05; **, P < 0.01; ***, P < 0.001. C, Euclidean distance between primary samples and normal prostate samples and between metastatic and normal samples. D, Euclidean distance between primary samples within each patient, metastatic samples within each patient, and between primary and metastatic samples within each patient. E, As in D, but comparison done between patients. PCBM primary, n = 57; PCBM metastasis, n = 95; normal prostate, n = 2.
Figure 2. Intrapatient variation between selected primary and metastatic samples. The samples from each patient were clustered using the 1% most variably methylated CpG sites from the Illumina EPIC array (8,038 sites). Heatmap shows β values for primary and metastatic samples. Class of CpG (in relation to CpG island) is shown in blue/green heatmap on the left. Average log2 fold change of the primary tumors and metastases compared with normal prostate tissue are shown on the right. Sample type (primary or metastatic), histology, and genetic alterations from whole-exome sequencing are annotated below.
Figure 2.
Intrapatient variation between selected primary and metastatic samples. The samples from each patient were clustered using the 1% most variably methylated CpG sites from the Illumina EPIC array (8,038 sites). Heatmap shows β values for primary and metastatic samples. Class of CpG (in relation to CpG island) is shown in blue/green heatmap on the left. Average log2-fold change of the primary tumors and metastases compared with normal prostate tissue is shown on the right. Sample type (primary or metastatic), histology, and genetic alterations from whole-exome sequencing are annotated below.
Figure 3. SPOP-mutant and TMPRSS2-ERG fusion PCBM have distinct methylomes. A, Unsupervised hierarchical consensus clustering of metastatic samples from 42 patients. Samples from each patient were clustered using 1% most variably methylated CpG sites from the Illumina EPIC array (8,038 sites). The heatmap shows the β values. Class of CpG (in relation to CpG island) is shown in blue/green heatmap on the left, along with methylation status of CpG sites in normal prostate tissue. Mutational burden (mutations/Mb) is shown in the barplot on top. Sample type (primary or metastatic), histology, and genetic alterations from whole-exome sequencing are annotated below. B, Enrichment in CpG types among the variably methylated CpGs, showing CpGs with log2 fold difference to mean β value of normal prostates below −2 and above 2 (left column), and below −10 and above 3 (right column). Values and colors indicate Pearson correlation coefficients. P values were < 2.22 × 10⁻¹⁶ in all cases. C, Number of DMRs in primary cancers compared with normal prostate and metastases compared with normal prostate (DMR ≥ 5 CpGs, >|20%| change in methylation, q < 0.05). D, Number of DMRs in metastases with SPOP mutation versus samples with neither SPOP mutation nor TMPRSS2-ERG fusion, and metastases with TMPRSS2-ERG fusion versus samples with neither SPOP mutation nor TMPRSS2-ERG fusion (DMR ≥ 5 CpGs, >|20%| change in methylation). E, Enrichment for differentially methylated CpGs between all metastases and normal prostate tissue, SPOP-mutant metastases and normal prostate tissue, TMPRSS2-ERG fusion metastases, and normal prostate tissue, SPOP-mutant metastases compared with non-TMPRSS2-ERG/SPOP-mutant metastases, and TMPRSS2-ERG fusion metastases compared with non-TMPRSS2-ERG/SPOP-mutant metastases. Values indicate the log-OR from Fisher exact tests.
Figure 3.
SPOP-mutant and TMPRSS2-ERG fusion PCBM have distinct methylomes. A, Unsupervised hierarchical consensus clustering of metastatic samples from 42 patients. Samples from each patient were clustered using 1% most variably methylated CpG sites from the Illumina EPIC array (8,038 sites). The heatmap shows the β values. Class of CpG (in relation to CpG island) is shown in blue/green heatmap on the left, along with methylation status of CpG sites in normal prostate tissue. Mutational burden (mutations/Mb) is shown in the barplot on top. Sample type (primary or metastatic), histology, and genetic alterations from whole-exome sequencing are annotated below. B, Enrichment in CpG types among the variably methylated CpGs, showing CpGs with log2-fold difference to mean β value of normal prostates below −2 and above 2 (left column), and below −10 and above 3 (right column). Values and colors indicate Pearson correlation coefficients. P values were < 2.22 × 10⁻¹⁶ in all cases. C, Number of DMRs in primary cancers compared with normal prostate and metastases compared with normal prostate (DMR ≥ 5 CpGs, >|20%| change in methylation, q < 0.05). D, Number of DMRs in metastases with SPOP mutation versus samples with neither SPOP mutation nor TMPRSS2-ERG fusion and metastases with TMPRSS2-ERG fusion versus samples with neither SPOP mutation nor TMPRSS2-ERG fusion (DMR ≥ 5 CpGs, >|20%| change in methylation). E, Enrichment for differentially methylated CpGs between all metastases and normal prostate tissue, SPOP-mutant metastases and normal prostate tissue, TMPRSS2-ERG fusion metastases, and normal prostate tissue, SPOP-mutant metastases compared with non–TMPRSS2-ERG/SPOP-mutant metastases, and TMPRSS2-ERG fusion metastases compared with non–TMPRSS2-ERG/SPOP-mutant metastases. Values indicate the log-OR from Fisher exact tests.
Figure 4. Global CpG island hypermethylation in PCBM is associated with the PRC2 complex. A, Mean methylation of CpG sites in relation to CpG islands in normal prostate, primary, and metastatic samples. P values computed from Wilcoxon tests. B, Mean methylation of CpG sites in relation to CpG islands in normal prostate, primary, and metastatic samples, stratified by TMPRSS2-ERG fusion, SPOP mutation, or neither. P values computed from Wilcoxon tests. C, Gene set enrichment analysis on DM CpG sites between primary tumors and normal prostates, metastases and normal prostates, and metastases and primary tumors, using curated gene sets from MSigDB. Pathways shown are from the union of the top 10 DM pathways from each of the three comparisons. D, Same as C but showing the union of the 10 most DM pathways between SPOP-mutant or TMPRSS2-ERG fusion metastases against metastases with neither alteration. E, Expression of EZH2 in primary tumors and metastases from targeted RNA-seq. P values computed from Wilcoxon tests. F, Same as E, with samples stratified by TMPRSS2-ERG fusion, SPOP mutation, or neither.
Figure 4.
Global CpG island hypermethylation in PCBM is associated with the PRC2 complex. A, Mean methylation of CpG sites in relation to CpG islands in normal prostate, primary, and metastatic samples. P values computed from Wilcoxon tests. B, Mean methylation of CpG sites in relation to CpG islands in normal prostate, primary, and metastatic samples, stratified by TMPRSS2-ERG fusion, SPOP mutation, or neither. P values computed from Wilcoxon tests. C, Gene set enrichment analysis on DM CpG sites between primary tumors and normal prostates, metastases and normal prostates, and metastases and primary tumors, using curated gene sets from MSigDB. Pathways shown are from the union of the top 10 DM pathways from each of the three comparisons. D, Same as C but showing the union of the 10 most DM pathways between SPOP-mutant or TMPRSS2-ERG fusion metastases against metastases with neither alteration. E, Expression of EZH2 in primary tumors and metastases from targeted RNA-seq. P values computed from Wilcoxon tests. F, Same as E, with samples stratified by TMPRSS2-ERG fusion, SPOP mutation, or neither.
Figure 5. PCBM DNA methylation changes may suggest mechanisms driving PCBM. A, Overlap between DMRs in SPOP-mutant primaries, SPOP-mutant metastases, TMPRSS2-ERG fusion primaries, and TMPRSS2-ERG fusion metastases, compared with normal prostates. Dots and lines show sets being intersected, bar plots on top show the intersection size (Mb), and bar plots on the right show the size of set (Mb). B, Gene ontology analysis on genes with promoter-associated DMRs in PCBM compared with normal prostate tissue. C, Heatmap showing mean difference in methylation level at DM promoters of genes in the neuroactive ligand–receptor interaction and cell adhesion molecules gene sets for primary tumors and metastases, compared with normal prostates. White indicates the absence of a DMR at a given promoter. D, Mean level of methylation at promoter DMRs of GABRB3, CLDN4, and CLDN8 in primary samples from the PCBM cohort, TCGA primary prostate cancers, metastatic samples from the PCBM cohort, and non-brain metastases from Zhao and colleagues (2021). P values computed from Wilcoxon tests. PCBM primary n = 57, TCGA primary n = 502, PCBM metastasis n = 95, non-brain metastasis n = 100.
Figure 5.
PCBM DNA methylation changes may suggest mechanisms driving PCBM. A, Overlap between DMRs in SPOP-mutant primaries, SPOP-mutant metastases, TMPRSS2-ERG fusion primaries, and TMPRSS2-ERG fusion metastases, compared with normal prostates. Dots and lines show sets being intersected, bar plots on top show the intersection size (Mb), and bar plots on the right show the size of set (Mb). B, Gene ontology analysis on genes with promoter-associated DMRs in PCBM compared with normal prostate tissue. C, Heatmap showing mean difference in methylation level at DM promoters of genes in the neuroactive ligand–receptor interaction and cell adhesion molecules gene sets for primary tumors and metastases, compared with normal prostates. White, the absence of a DMR at a given promoter. D, Mean level of methylation at promoter DMRs of GABRB3, CLDN4, and CLDN8 in primary samples from the PCBM cohort, TCGA primary prostate cancers, metastatic samples from the PCBM cohort, and nonbrain metastases from Zhao and colleagues (13). P values computed from Wilcoxon tests. PCBM primary, n = 57; TCGA primary, n = 502; PCBM metastasis, n = 95; nonbrain metastasis, n = 100.

References

    1. Tomlins SA, Rhodes DR, Perner S, Dhanasekaran SM, Mehra R, Sun X-W, et al. . Recurrent fusion of TMPRSS2 and ETS transcription factor genes in prostate cancer. Science 2005;310:644–8. - PubMed
    1. Barbieri CE, Baca SC, Lawrence MS, Demichelis F, Blattner M, Theurillat J-P, et al. . Exome sequencing identifies recurrent SPOP, FOXA1, and MED12 mutations in prostate cancer. Nat Genet 2012;44:685–9. - PMC - PubMed
    1. Fraser M, Rouette A. Prostate cancer genomic subtypes. Adv Exp Med Biol 2019;1210:87–110. - PubMed
    1. Robinson D, Van Allen EM, Wu Y-M, Schultz N, Lonigro RJ, Mosquera J-M, et al. . Integrative clinical genomics of advanced prostate cancer. Cell 2015;162:454. - PubMed
    1. Quigley DA, Dang HX, Zhao SG, Lloyd P, Aggarwal R, Alumkal JJ, et al. . Genomic hallmarks and structural variation in metastatic prostate cancer. Cell 2018;175:889. - PubMed

Publication types