. 2023 Apr 3;220(4):e20221007.
doi: 10.1084/jem.20221007. Epub 2023 Feb 7.

Macrophages promote anti-androgen resistance in prostate cancer bone disease

Affiliations

Macrophages promote anti-androgen resistance in prostate cancer bone disease

Xue-Feng Li et al. J Exp Med. .

Abstract

Metastatic castration-resistant prostate cancer (PC) is the final stage of PC that acquires resistance to androgen deprivation therapies (ADT). Despite progresses in understanding of disease mechanisms, the specific contribution of the metastatic microenvironment to ADT resistance remains largely unknown. The current study identified that the macrophage is the major microenvironmental component of bone-metastatic PC in patients. Using a novel in vivo model, we demonstrated that macrophages were critical for enzalutamide resistance through induction of a wound-healing-like response of ECM-receptor gene expression. Mechanistically, macrophages drove resistance through cytokine activin A that induced fibronectin (FN1)-integrin alpha 5 (ITGA5)-tyrosine kinase Src (SRC) signaling cascade in PC cells. This novel mechanism was strongly supported by bioinformatics analysis of patient transcriptomics datasets. Furthermore, macrophage depletion or SRC inhibition using a novel specific inhibitor significantly inhibited resistant growth. Together, our findings elucidated a novel mechanism of macrophage-induced anti-androgen resistance of metastatic PC and a promising therapeutic approach to treat this deadly disease.


Conflict of interest statement

Disclosures: J. Cao was sponsored by China Scholarship Council. A. Unciti-Broceta and N.O. Carragher reported grants from Nuvectis Pharma outside the submitted work; in addition, A. Unciti-Broceta and N.O. Carragher had patents to EP3298015B1, JP6684831B2, US10294227B2, CN107849050B, and CA3021550A1 licensed (Nuvectis Pharma). C. Sawyers reported personal fees from Novartis, Blueprint, Beigene, Foghorn, PMV, KSQ, Housey, Nextech, Column Group, Cellcarta, and Oric outside the submitted work; in addition, C. Sawyers had a patent to enzalutamide with royalties paid and a patent to apalutamide with royalties paid. B.Z. Qian reported personal fees from Medanexx Ltd and Nuvectis Pharma outside the submitted work. No other disclosures were reported.

Figures

None
Graphical abstract
Figure 1.
Figure 1.
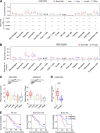
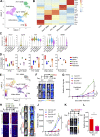
Specific enrichment of macrophages in bone-metastatic PC is associated with patient survival. (A) Macrophages are significantly enriched in bone metastasis compared with PC metastasis from other organs. Top: Box plot showing quantification of xCell enrichment score of different stromal cell types in PC metastases in different organs. Bottom: Illustration showing significance of the comparisons: ↑, significantly higher in bone metastasis; —, not significantly different; ×, specific cell type is not present; N.S.E., not significantly estimated with xCell. Significant means P < 0.05 with ANOVA test. (B) Macrophages are significantly enriched in bone metastasis compared with PC primary tumor. Top: Box plot showing quantification of xCell enrichment score of different stromal cell types in PC bone metastasis versus primary PC. Bottom: Illustration showing significance of the comparisons: ↑, significantly higher in bone metastasis; —, not significantly different; ×, specific cell type is not present; N.S.E., not significantly estimated with xCell. Significant means P < 0.05 with two-tailed unpaired Student’s t test. (C) Estimation of macrophage abundance in patient PC bone metastasis and metastases from other organs in indicated datasets. **, P < 0.01; ***, P < 0.001; ****, P < 0.0001; ns, not significant. ANOVA was used. (D) Estimation of macrophage abundance in patient PC bone metastasis and primary PC in Gene Expression Omnibus dataset GSE32269. **, P < 0.01; ***, P < 0.001; ****, P < 0.0001; ns, not significant. Two-tailed unpaired Student’s t test was used. (E) Overall survival of macrophage abundance with median as cut-off in all patients (left), patients without bone metastasis (middle), and patients with bone metastasis (right) in the SU2C dataset. *, P < 0.05; ns, not significant. P value was calculated using the Mantel–Cox test.
Figure S1.
Figure S1.
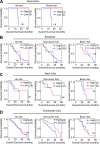
PC bone metastasis–associated neutrophils, basophils, mast cells, and endothelial cells are not inversely correlated with patient survival. (A) Kaplan–Meier curve showing association of overall survival with the abundance of neutrophils (estimated using xCell enrichment score) with mean as cut-off in all patients, and patients with bone metastasis in the SU2C dataset. (B) Kaplan–Meier curve showing association of overall survival with the abundance of basophils (estimated using xCell enrichment score) with mean as cut-off in all patients, patients with non-bone metastasis, and patients with bone metastasis in the SU2C dataset. (C) Kaplan–Meier curve showing association of overall survival with the abundance of mast cells (estimated using xCell enrichment score) with mean as cut-off in all patients, patients with non-bone metastasis, and patients with bone metastasis in the SU2C dataset. (D) Kaplan–Meier curve showing association of overall survival with the abundance of endothelial cells (estimated using xCell enrichment score) with mean as cut-off in all patients, patients with non-bone metastasis, and patients with bone metastasis in the SU2C dataset. *, P < 0.05; ns, not significant. P value was calculated using Mantel–Cox test.
Figure 2.
Figure 2.
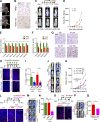
Enzalutamide resistance of bone-metastatic PC is dependent on macrophages. (A) Representative x-ray images showing mixed osteolytic and osteoblastic MycCaP-Bo bone metastasis lesion compared with normal bone. Bone marrow region and bone matrix are indicated by red and yellow arrows, respectively. (B) Representative immunohistochemistry staining of mouse macrophage marker Iba1 in samples of HiMyc primary prostate tumor (HiMyc) and MycCaP-Bo–derived bone metastasis (Bone met). (C) Representative BLI of bone metastasis receiving daily treatment of vehicle (Veh) or enzalutamide (Enz) on days 0, 7, and 18 following the treatment schematic diagram shown on top. (D) Quantification of BLI signals of bone metastasis of hind legs (see Materials and methods) in mice with indicated treatment (n = 12∼14). (E) In vitro response to enzalutamide of MycCaP-Bo cells recovered from in vivo enzalutamide naive (Naive #1–3) or resistant (Resist #1–3) bone metastasis compared with parental MycCaP-Bo cells as measured by relative growth (n = 3). (F) In vivo response to enzalutamide of bone metastasis derived from MycCaP-Bo cells recovered from enzalutamide-resistant bone metastasis (Resist #1–3) compared with bone metastasis of parental MycCaP-Bo cells on day 18 as measured by relative BLI signal (n = 6∼10). (G) Representative images of Iba1 staining in MycCaP-Bo bone metastasis with indicated treatment. (H) Macrophage depletion by L-Clod inhibits the development of enzalutamide resistance of PC bone metastasis. Representative images of Iba1 whole-mount staining of bone metastasis samples collected on day 18 with indicated treatment. (I) FACS quantification of percentage of F4/80+ macrophages in total CD45+ cells of bone metastasis samples collected on day 18 with indicated treatment. (J) Representative BLI of mice from H on day 0 and day 18. (K) Quantification of BLI signals of bone metastasis in mice receiving treatments as indicated in H (n ≥ 10). Coefficient of drug interaction on day 18 equals 0.61, indicating significant synergistic effect. (L) Representative images of whole-mount staining of Iba1 in bone metastasis samples collected on day 21 with indicated treatment as shown in the diagram on top. (M) Representative BLI of mice from L on day 14 and day 21. (N) Quantification of BLI signal of bone metastasis from L on day 21 relative to day 14 receiving indicated treatments (n = 8∼10). Shown as relative signal of bone metastasis at day 21 normalized to same tumor at day 14. (O) Representative images of whole-mount staining of Iba1 in bone metastasis samples collected on day 21 in CD11b-DTR bone marrow mosaic mice with indicated treatment, as shown in the diagram on top. (P) Representative BLI of mice from O on day 14 and day 21. (Q) Quantification of BLI signal of bone metastasis on day 21 relative to day 14 in mice from O (n = 6). Data are mean ± SEM; *, P < 0.05; **, P < 0.01; ***, P < 0.001; ****, P < 0.0001; ns, not significant. ANOVA was used in N, and two-tailed unpaired Student’s t test was used in the rest of the analyses. Scale bar = 100 μm.
Figure S2.
Figure S2.
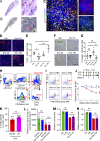
Neutrophils contribute minimally to anti-androgen resistance. Data related to Fig. 2. (A) Representative H&E staining of MycCaP-Bo bone metastasis sample. Circled area indicates the tumor region. Red arrows indicate newly formed bone matrix; black arrow indicates bone absorption area. (B) Representative TRAP staining of MycCaP-Bo bone metastasis. Red arrows indicate TRAP+ osteoclasts. (C) Representative image of Iba1 (red) and F4/80 (green) IF staining in bone metastasis lesion showing the specificity of Iba1 as the macrophage marker. (D) Representative images of Ki-67 staining of bone metastasis lesions with treatment of vehicle (Veh) or enzalutamide (Enz) at indicated time points. (E) Quantification of Ki-67 staining in bone metastasis lesions with treatment of vehicle or enzalutamide at indicated time points. (F) Representative images of cleaved caspase-3 staining of the same samples as in D and E. (G) Quantification of cleaved caspase-3 staining in the same samples as in D and E. (H) Gating strategy for identification of F4/80+ macrophages, CCR2+ Inflam-Monos, and neutrophils in bone metastasis. (I) Representative flow cytometry dot plots showing macrophage depletion using liposomal clodronate, shown as the percentage of F4/80+ cells (gated cells) in CD45+ total cells. (J) Relative growth of spontaneous tumor in HiMyc mice under vehicle or enzalutamide combined with the treatment of liposome PBS (L-PBS) or L-Clod following the schematic diagram on top. (K) Quantification showing the percentage of neutrophils (gated as CD45+CD11b+Ly-6G+, shown as in Fig. S2 H) in total CD45+ cells from bone metastasis samples collected on day 21 with DT and Glu-DT (control toxin) treatment (n = 6). (L) Quantification of relative tumor growth on day 14 after treatments (normalized to day 0) showing that neutrophil depletion using anti-Ly-6G Ab did not affect anti-androgen response in vivo. MycCaP-Bo bone metastasis received daily treatment of vehicle or enzalutamide plus isotype (Iso) or neutrophil-depleting Abs (Anti-Ly-6G, 200 mg/mouse, i.p. injection, twice a week; n = 6). (M) Relative cell number of MycCaP-Bo cells upon 4 d of indicated treatments revealed that IL-23 did not affect enzalutamide response in vitro. Enzalutamide pre-treated MycCaP-Bo cells were further treated with normal medium (Ctrl), IL-23 alone (100 ng/ml), enzalutamide alone (Enz, 1 mM), and enzalutamide plus IL-23 (Enz+IL-23), followed by MTT assay on day 4 of treatments (n = 4). (N) Relative cell number of MycCaP-Bo cells upon 4 d of indicated treatments revealed that MDSC-conditioned medium did not affect enzalutamide response in vitro. Enzalutamide–pre-treated MycCaP-Bo cells were further treated with normal culture (Ctrl), MDSC-conditioned medium alone (CM), enzalutamide alone (Enz, 1 mM), and enzalutamide plus enzalutamide-primed MDSC-conditioned medium (Enz+Enz-CM), followed by MTT assay on day 4 of treatments (n = 4). Data are mean ± SEM; *, P < 0.05; ***, P < 0.001; ****, P < 0.0001; ns, not significant. ANOVA was used in E and G, and two-tailed unpaired Student’s t test was used in J–N. Scale bar = 100 μm.
Figure 3.
Figure 3.
Enzalutamide resistance depends on both monocyte-derived and bone-resident macrophages. (A) UMAP of monocyte/macrophage populations from all samples. All cells are colored by their cell types. (B) Heatmap showing the expression of representative genes for each population. (C) Expression level of featured genes in each population. (D) Box plots showing the percentage of each population in total monocyte/macrophage across different treatment groups. Healthy (n = 2), naive tumor (n = 3), enzalutamide 4 d (Enz-4d, n = 2), enzalutamide 7 d (Enz-7d, n = 3), and enzalutamide 18 d (Resistant, n = 3). (E) Pseudotime analysis of all monocyte/macrophage populations by Monocle3. All cells were colored by pseudotime score. (F) Deficiency of monocyte derived macrophage in Ccr2−/− mice inhibits enzalutamide resistance of MycCaP-Bo bone metastasis. Representative BLI of MycCaP-Bo bone metastasis receiving daily treatment of vehicle (Veh) or enzalutamide (Enz) in WT and CCR2-knockout (Ccr2−/−) mice (n = 6∼14). (G) Quantification of MycCaP-Bo bone metastasis as indicated in F (n = 6∼14). Coefficient of drug interaction = 0.88 on day 14 indicating significant synergistic effect. (H) Depletion of bone marrow–resident macrophage in CD169-DTR mice delayed enzalutamide resistance of MycCaP-Bo bone metastasis. Representative images of Iba1 staining in bone metastasis samples collected on day 14 with indicated treatment as shown in the diagram on top. Glu-DT, control mutant toxin. (I) Representative BLI of bone metastasis in mice at specified time points receiving indicated treatments. Glu-DT, control mutant toxin. (J) Quantification of bone metastasis in mice at specified time points receiving indicated treatments (n = 6∼16). Coefficient of drug interaction on day 14 indicating significant synergistic effect. Glu-DT, control mutant toxin. (K) Macrophage depletion in CD169-DTR mice blocked growth of resistant bone metastases. Representative BLI of bone metastasis on day 14 and day 21 in mice receiving indicated treatments. (L) Quantification of BLI of bone metastasis on day 21 relative to day 14 in mice receiving indicated treatments as indicated in K (n = 6). Data in D are median ± quartiles; all other data are mean ± SEM. *, P < 0.05; **, P < 0.01; ***, P < 0.001; ns, not significant. Calculated by two-tailed unpaired Student’s t test. Scale bar = 100 μm.
Figure S3.
Figure S3.
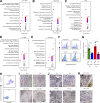
Macrophage sub-populations in bone-metastatic PC. Data related to Fig. 3. (A) Enriched pathways of Isg15+ MAM based on differentially expressed genes. (B) Enriched pathways of Inflam-Mono based on differentially expressed genes. (C) Enriched pathways of RTM based on differentially expressed genes. (D) Enriched pathways of Ftl1+ based on differentially expressed genes. (E) Enriched pathways of proliferating monocyte (Prolif-Mono) based on differentially expressed genes. (F) Representative flow cytometry dot plots showing the percentage of SSCloF4/80+ macrophages (gated cells) in total CD45+ cells from bone metastasis samples in CD169-DTR mice collected on day 14 with DT and Glu-DT (control toxin) treatment (n = 3). (G) Quantification of FACS data showing the percentage of SSCloF4/80+ macrophages (gated as in F) in total CD45+ cells from bone metastasis samples in CD169-DTR mice collected on day 14 with DT and Glu-DT (control toxin) treatment (n = 3). (H) Representative flow cytometry dot plots showing the depletion efficiency of bone marrow resident macrophages (CD169+CD106+) of all F4/80+ macrophages from F. (I) Representative TRAP staining of MycCaP-Bo bone metastasis in WT mice with indicated treatments for 18 d. (J) Representative TRAP staining of MycCaP-Bo bone metastasis in CD169-DTR mice with indicated treatments for 18 d. (K) Representative TRAP staining of MycCaP-Bo bone metastasis in Ccr2−/− mice with indicated treatments for 18 d. Data are mean ± SEM in G; *, P < 0.05. P value was calculated using two-tailed unpaired Student’s t test. Scale bar = 100 μm.
Figure S4.
Figure S4.
Macrophages-mediated upregulation of FN1, but not LAMB2, in tumor cells is highly enriched in bone metastasis. (A) Gating strategy of FACS sorting of tumor cells from bone metastasis lesions for transcriptome RNA-seq. (B) Expression of FN1 in bone metastasis and primary PC in the indicated patient dataset. (C) Expression of FN1 in bone metastasis and metastases from different organs in indicated patient datasets. (D) Expression of LAMB2 in bone metastasis and primary PC in the indicated patient dataset. (E) Expression of LAMB2 in bone metastasis and metastases from different organs in indicated patient datasets. (F) Representative image of FN1 IF staining in bone metastasis lesion and adjacent bone marrow. (G) Gene expression of Fn1 (fragments per kilobase of transcript per million mapped reads [FPKM]) from RNA-seq of FACS purified MycCaP-Bo cells and macrophages from indicated tumors. *, P < 0.05; **, P < 0.01; ***, P < 0.001; ****, P < 0.0001, ns, not significant. Two-tailed unpaired Student’s t test was used in B and D, and ANOVA was used in C and E. Scale bar = 50 μm.
Figure 4.
Figure 4.
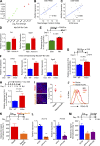
Macrophage-induced tumor cell FN1 expression promotes enzalutamide resistance. (A) Venn diagram showing numbers of differentially regulated genes from comparisons of RNA-seq transcriptome profiles of FACS-purified MycCaP-Bo cells from bone metastasis lesions with no treatment (Naive), enzalutamide treatment for 18 d (Resist), and enzalutamide treatment for 18 d plus macrophage depletion by L-Clod in the last 4 d (Resist-Mac). (B) Pie chart showing numbers of overlapping genes with indicated alterations from the two comparisons in A. (C) Schematic plot showing expression pattern of 394 genes upregulated in both comparisons from B. (D) Total five significantly enriched KEGG signaling pathways of the 394 upregulated genes from B. (E) ssGSEA estimation of KEGG ECM–receptor gene expression (ECM score) in bone metastasis and primary PC in patient dataset GSE32269. (F) ECM score in bone metastasis and metastases from different organs in indicated patient datasets. (G) Time on treatment (indicating resistance) probability of all patients (left) and patients with bone metastasis (right) who received anti-androgen therapy, with median expression of ECM score as cut-off. P value was calculated using Mantel–Cox test. (H) Correlation of ECM score with macrophage abundance in indicated bone metastasis datasets. (I) Correlation of FN1 expression with macrophage abundance in indicated bone metastasis datasets. (J) Gene expression in FPKM from RNA-seq of FACS-purified MycCaP-Bo cells from indicated tumors. (K) Representative IF staining of MycCaP-Bo bone metastasis sections and quantification of FN1 protein. (L) Quantification of Fn1 expression in doxycycline inducible Fn1 knockdown MycCaP-Bo cells by real time PCR (n = 3). (M) Quantification of FN1 expression in doxycycline-inducible Fn1 knockdown MycCaP-Bo cells by IF staining. (N) Fn1 knockdown significantly inhibited resistant tumor growth in vivo, but not further affected by macrophage depletion using L-Clod, shown by quantification of BLI signals of bone metastasis on day 21 relative to day 14 derived from doxycycline-inducible shCtrl (blue), shFn1 (red), or shFn1-Mac (purple) following the treatment scheme shown on top (n = 6∼8). (O) Time on treatment (indicating time to resistance) probability of all patients (left) and patients with bone metastasis (right) who received anti-androgen therapy, with median expression of FN1 as cut-off, showing high FN1 expression is significantly associated with anti-androgen resistance in mCRPC patients. Data are mean ± SEM in J–L and N; *, P < 0.05; **, P < 0.01; ***, P < 0.001; ****, P < 0.0001; ns, not significant. Two-tailed unpaired Student’s t test was used in E and L, and ANOVA was used in F, J, K, and N. Pearson correlation analysis was used in I. Mantel–Cox test was used in G and O. Scale bar = 100 μm.
Figure 5.
Figure 5.
Macrophage-induced integrin a5 (ITGA5) expression promotes enzalutamide resistance. (A) Correlation of ITGA5 expression with macrophage abundance in indicated bone metastasis datasets. (B) Expression of ITGA5 in bone metastasis and metastases from different organs in indicated patient datasets. (C) Expression of Itga5 in FPKM of MycCaP-Bo cells FACS-purified from indicated in vivo bone metastasis. (D) Representative histogram of ITGA5 expression on MycCaP-Bo cells FACS-purified from indicated in vivo bone metastasis. Number indicates mean fluorescent intensity. FMO, fluorescent minus one; negative control for flow cytometry staining. (E) Schematic showing key elements in the UniSAM vector. (F) Flow histogram of ITGA5 expression in control (Ctrl), and Itga5 overexpressing MycCaP-Bo cells clone 1 (#1 sgRNA, left) and clone 4 (#4 sgRNA, right); number indicating MFI. (G) In vitro response of control (Ctrl) and cells overexpressing Itga5 (#1, #4) to enzalutamide treatment in the presence of FN1 (1 μg/ml). Response was defined by relative growth of indicated cells with enzalutamide (1 μM) over vehicle treatment (n = 3). (H) High expression of Itga5 promotes enzalutamide resistance in vivo shown by relative growth of control (Ctrl) and cells overexpressing Itga5 (#4) with enzalutamide treatment versus vehicle, shown as relative BLI signal of enzalutamide treatment over vehicle treatment on day 18. Data are mean ± SEM in C, G, and H; *, P < 0.05; **, P < 0.01; ****, P < 0.0001; ns, not significant. Pearson correlation analysis was used in A, ANOVA was used in B, C, and G, and two-tailed unpaired Student’s t test was used in H.
Figure 6.
Figure 6.
Macrophage-derived activin-A induction of FN1-ITGA5 axis in bone-metastatic PC. (A) Relative expression of all significantly altered cytokine genes of monocytes and macrophages associated with in vivo enzalutamide-resistant MycCaP-Bo bone metastasis compared with those associated with naive tumors as defined in Fig. 4 A. Red and green indicates up- and downregulated in resistance-associated monocytes/macrophages, respectively. (B) Correlation of INHBA expression with macrophage content in indicated patient bone metastasis dataset. (C) Correlation of INHBA expression with ECM score in indicated patient bone metastasis dataset. (D) Relative expression of Fn1 and Itga5 in MycCaP-Bo cells treated with activin-A quantified by qPCR (n = 4). (E) Response of MycCaP-Bo cells treated with activin-A (20 ng/ml) to enzalutamide treatment in the presence of BSA (1%) or FN1 (1 μg/ml). Response was defined by relative growth of indicated cells with enzalutamide (1 μM) to FBS-cultured cells (n = 3). (F) Relative expression of Inhba, Fn1, and Itga5 in Inhba doxycycline-inducible overexpressing MycCaP-Bo cells treated with doxycycline quantified by qPCR (n = 3). (G) Response of control (WT) cells and cells with inducible overexpression of Inhba to enzalutamide treatment in the presence of fibronectin in vitro. Response was defined by relative growth of indicated cells with enzalutamide (1 μM) to FBS-cultured cells (n = 3). (H) Overexpression of Inhba drives resistance in vivo indicated by enzalutamide response of control (WT) and cells with inducible overexpression of Inhba following the treatments shown in the diagram on top. Data shown as the relative growth of indicated cells with enzalutamide to vehicle on day 18 (n = 10). (I) Representative images and quantification of FN1 staining in MycCaP-Bo bone metastasis with indicated treatment. (J) Flow cytometry histogram of ITGA5 expression on tumor cells in MycCaP-Bo bone metastasis with indicated treatment as shown in the top diagram of J); number indicates MFI. (K) Activin receptor signaling is critical for enzalutamide resistance shown by representative growth of resistant MycCaP-Bo bone metastasis following indicated treatment (n = 12). (L) Quantification of Acvr1b and Acvr2a expression in indicated doxycycline-inducible knockdown MycCaP-Bo cells by qPCR (n = 3). (M) Activin receptor is critical for enzalutamide resistance in vivo indicated by quantification of BLI signals on day 21 relative to day 14 of bone metastasis of doxycycline-inducible shCtrl, shAcvr1b, or shAcvr2a MycCaP-Bo cells following the treatment scheme shown on top (n = 6). Data are mean ± SEM; *, P < 0.05; **, P < 0.01; ***, P < 0.001. Two-tailed unpaired Student’s t test. Pearson correlation analysis was used in B and C. Scale bar = 100 μm.
Figure S5.
Figure S5.
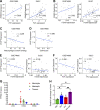
INHBA, but not CNTF, correlated with macrophage content. (A) Correlation of INHBA with FN1 in independent patient datasets. (B) Correlation of INHBA with ITGA5 in independent patient datasets. (C) Correlation of CNTF with macrophage content in independent patient datasets. (D) Correlation of CNTF with ECM score in independent patient datasets. (E) Correlation of CNTF with ITGA5 in independent patient datasets. (F) Correlation of CNTF with FN1 in independent patient datasets. (G) FPKM of three Inhibin genes in FACS-purified monocyte, macrophage, and tumor cells from enzalutamide-resistant bone metastasis of MycCaP-Bo cells as defined in Fig. 4 A. (H) Relative expression of Inhba in bone marrow–derived macrophages cultured alone (Ctrl), treated with conditional medium of MycCaP-Bo (CM), enzalutamide (1 μM, Enz) or conditioned medium of MycCaP-Bo cells and enzalutamide together (CM+Enz) quantified by qPCR (n = 4). Data are mean ± SEM; *, P < 0.05; **, P < 0.01; ns, not significant. ANOVA test was used in H, and Pearson correlation analysis was used in A–F.
Figure 7.
Figure 7.
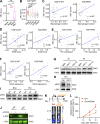
Enzalutamide resistance of bone-metastatic PC can be blocked by SRC-specific inhibitor. (A) Src activity estimated using Src score (see Materials and methods) in RNA-seq data of FACS-purified MycCaP-Bo tumor cells from indicated disease stage/treatment (as described in Fig. 4 A). (B) Src score in patient bone metastasis and metastases from other organs. (C) Correlation of Src score with macrophage abundance in patient bone metastasis datasets. (D) Correlation of Src score with ECM score in patient bone metastasis datasets. (E) Correlation of Src score with FN1 expression in patient bone metastasis datasets. (F) Correlation of Src score with ITGA5 expression in patient bone metastasis datasets. (G) Immunoblot showing the level of phosphorylated SRC (pSRC) and total SRC (t-SRC) in MycCaP-Bo cells seeded in wells precoated with 1% BSA (BSA), 1 μg/ml FN1 (FN1-1), and 10 μg/ml FN1 (FN1-10) for indicated time. (H) Immunoblotting showing the level of pSRC and t-SRC in modified MycCaP-Bo cells with doxycycline-induced expression of control shRNA or shRNA-targeting Fn1. The cells were treated with doxycycline (500 ng/ml) for 4 d. (I) Immunoblotting showing the level of pSRC and t-SRC in control MycCaP-Bo cells (Ctrl), MycCaP-Bo cells overexpressing ITGA5 clone 1 (#1) and clone 4 (#4) seeded in wells precoated with 1% BSA (BSA) or 1 μg/ml FN1 (FN1) for 6 h before sample harvest. (J) Immunoblotting showing the level of pSRC and t-SRC in in vivo MycCaP-Bo bone metastasis samples with indicated treatments. (K) Representative BLI images of resistant MycCaP-Bo bone metastasis following eCF506 treatment. (L) BLI quantification of resistant MycCaP-Bo bone metastasis following eCF506 treatment (n = 8∼10). Data are mean ± SEM; *, P < 0.05; **, P < 0.01; ns, not significant. ANOVA was used in A and B, two-tailed unpaired Student’s t test was used for L, and Pearson correlation analysis was used in C–F. Source data are available for this figure: SourceData F7.

Comment in

  • Macrophages and bone metastasis.
    Di Mitri D, Conforti F, Mantovani A. Di Mitri D, et al. J Exp Med. 2023 Apr 3;220(4):e20222188. doi: 10.1084/jem.20222188. Epub 2023 Feb 24. J Exp Med. 2023. PMID: 36828392 Free PMC article.

References

    1. Abida, W., Cyrta J., Heller G., Prandi D., Armenia J., Coleman I., Cieslik M., Benelli M., Robinson D., Van Allen E.M., et al. . 2019. Genomic correlates of clinical outcome in advanced prostate cancer. Proc. Natl. Acad. Sci. USA. 116:11428–11436. 10.1073/pnas.1902651116 - DOI - PMC - PubMed
    1. Antonarakis, E.S., Heath E.I., Posadas E.M., Yu E.Y., Harrison M.R., Bruce J.Y., Cho S.Y., Wilding G.E., Fetterly G.J., Hangauer D.G., et al. . 2013. A phase 2 study of KX2-391, an oral inhibitor of Src kinase and tubulin polymerization, in men with bone-metastatic castration-resistant prostate cancer. Cancer Chemother. Pharmacol. 71:883–892. 10.1007/s00280-013-2079-z - DOI - PMC - PubMed
    1. Aran, D., Hu Z., and Butte A.J.. 2017. xCell: Digitally portraying the tissue cellular heterogeneity landscape. Genome Biol. 18:220. 10.1186/s13059-017-1349-1 - DOI - PMC - PubMed
    1. Araujo, J.C., Trudel G.C., Saad F., Armstrong A.J., Yu E.Y., Bellmunt J., Wilding G., McCaffrey J., Serrano S.V., Matveev V.B., et al. . 2013. Docetaxel and dasatinib or placebo in men with metastatic castration-resistant prostate cancer (READY): A randomised, double-blind phase 3 trial. Lancet Oncol. 14:1307–1316. 10.1016/S1470-2045(13)70479-0 - DOI - PMC - PubMed
    1. Barbie, D.A., Tamayo P., Boehm J.S., Kim S.Y., Moody S.E., Dunn I.F., Schinzel A.C., Sandy P., Meylan E., Scholl C., et al. . 2009. Systematic RNA interference reveals that oncogenic KRAS-driven cancers require TBK1. Nature. 462:108–112. 10.1038/nature08460 - DOI - PMC - PubMed

Publication types

MeSH terms