Editorial
. 2023 Jun 13;29(12):2250-2265.
doi: 10.1158/1078-0432.CCR-22-3298.

Exploring the Immunogenicity of Noncanonical HLA-I Tumor Ligands Identified through Proteogenomics

Affiliations
Editorial

Exploring the Immunogenicity of Noncanonical HLA-I Tumor Ligands Identified through Proteogenomics

Maria Lozano-Rabella et al. Clin Cancer Res. .

Abstract

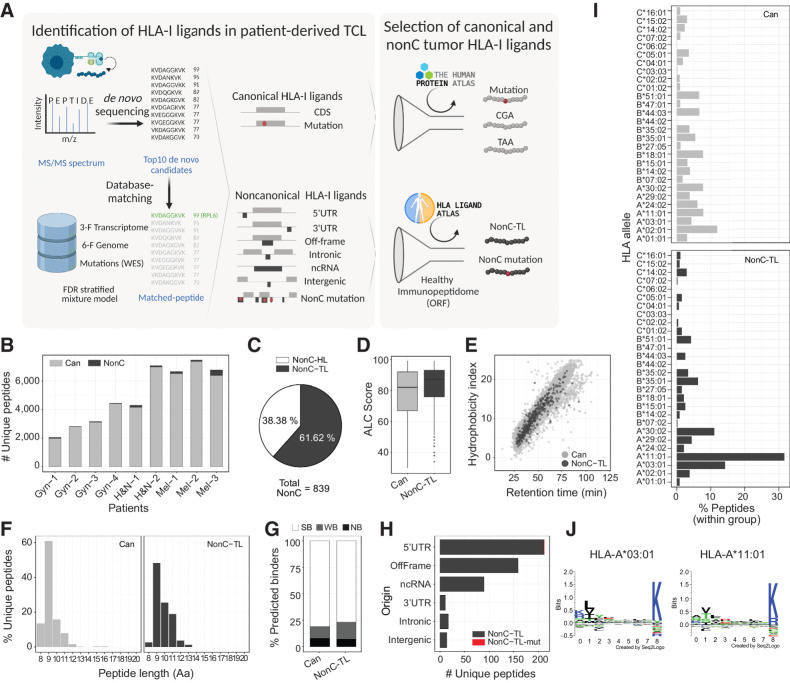
Purpose: Tumor antigens are central to antitumor immunity. Recent evidence suggests that peptides from noncanonical (nonC) aberrantly translated proteins can be presented on HLA-I by tumor cells. Here, we investigated the immunogenicity of nonC tumor HLA-I ligands (nonC-TL) to better understand their contribution to cancer immunosurveillance and their therapeutic applicability.

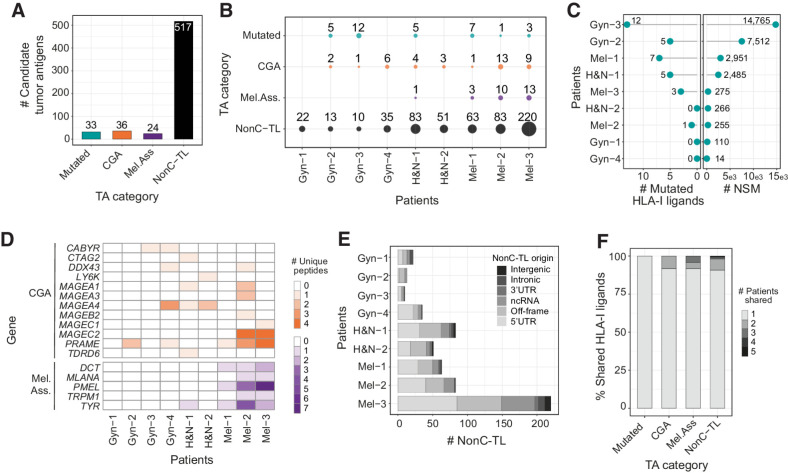
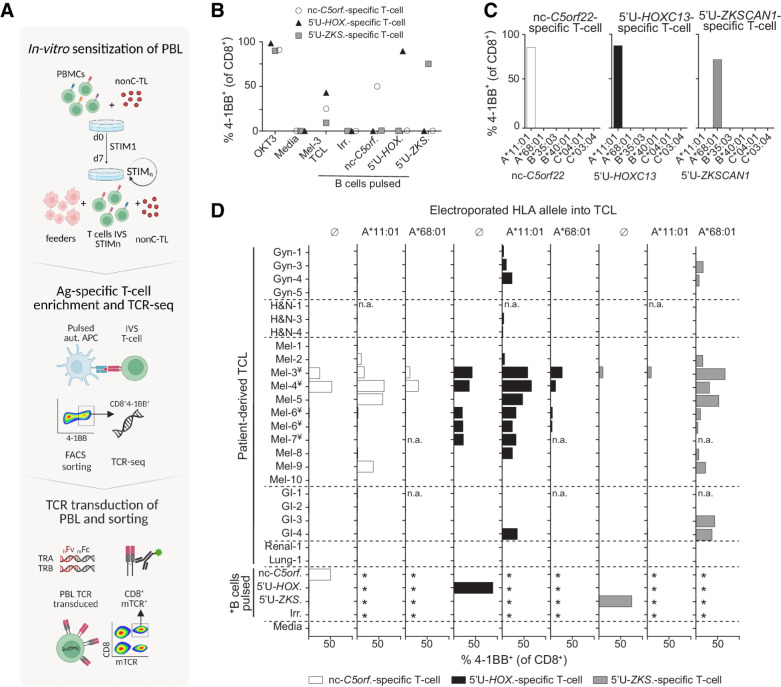
Experimental design: Peptides presented on HLA-I were identified in 9 patient-derived tumor cell lines from melanoma, gynecologic, and head and neck cancer through proteogenomics. A total of 507 candidate tumor antigens, including nonC-TL, neoantigens, cancer-germline, or melanocyte differentiation antigens, were tested for T-cell recognition of preexisting responses in patients with cancer. Donor peripheral blood lymphocytes (PBL) were in vitro sensitized against 170 selected nonC-TL to isolate antigen-specific T-cell receptors (TCR) and evaluate their therapeutic potential.

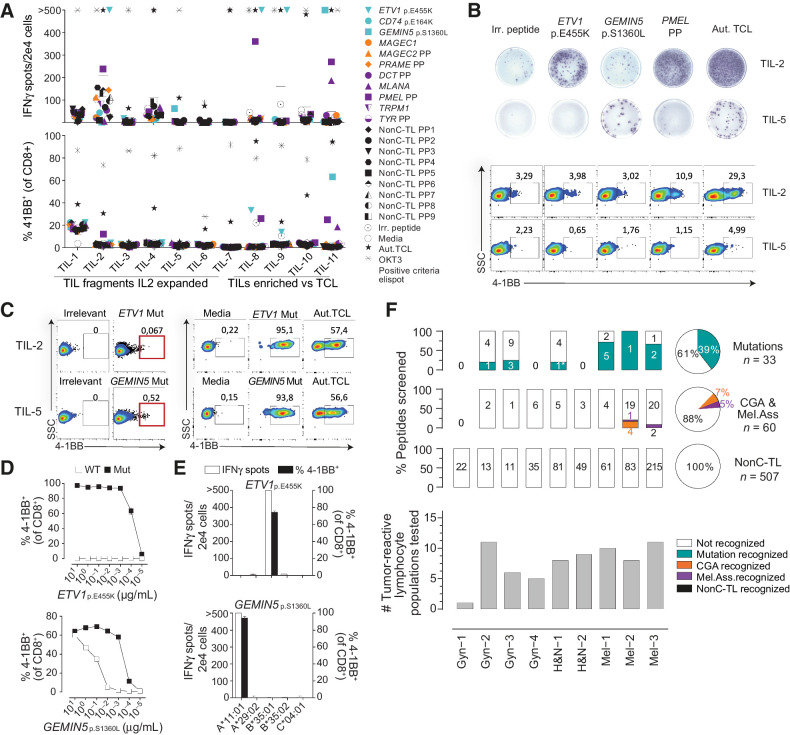
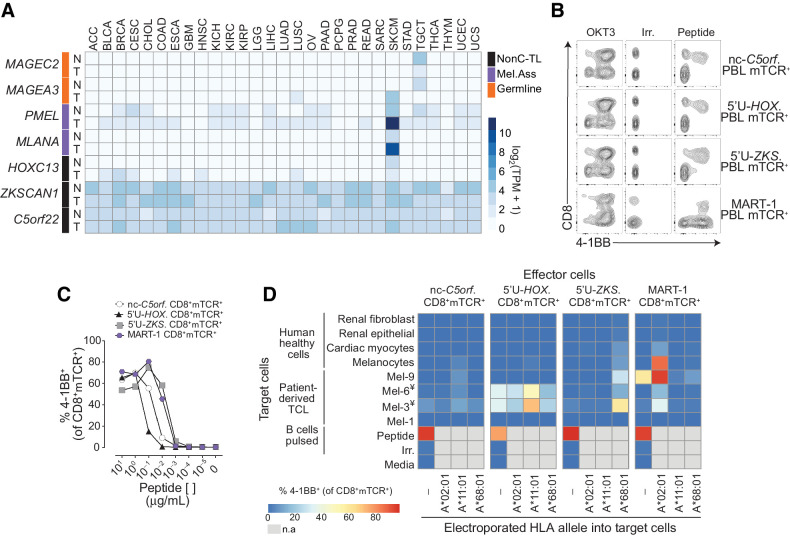
Results: We found no recognition of the 507 nonC-TL tested by autologous ex vivo expanded tumor-reactive T-cell cultures while the same cultures demonstrated reactivity to mutated, cancer-germline, or melanocyte differentiation antigens. However, in vitro sensitization of donor PBL against 170 selected nonC-TL, led to the identification of TCRs specific to three nonC-TL, two of which mapped to the 5' UTR regions of HOXC13 and ZKSCAN1, and one mapping to a noncoding spliced variant of C5orf22C. T cells targeting these nonC-TL recognized cancer cell lines naturally presenting their corresponding antigens. Expression of the three immunogenic nonC-TL was shared across tumor types and barely or not detected in normal cells.

Conclusions: Our findings predict a limited contribution of nonC-TL to cancer immunosurveillance but demonstrate they may be attractive novel targets for widely applicable immunotherapies. See related commentary by Fox et al., p. 2173.


Figures

Figure 1. Identification and characteristics of nonC HLA-I ligands presented by patient-derived TCLs. A, Diagram depicting the pipeline used to identify HLA-I ligands derived from canonical (Can) and nonC proteins presented by patient-derived TCL. The top 10 candidates for each MS spectrum were identified by de novo sequencing and aligned to a database containing the 3-frame transcriptome, 6-frame genome, and the NSM identified by WES. The FDR was calculated for each category shown using a stratified mixture model (left). All canonical peptides containing mutations as well as peptides derived from CGA or TAA were further studied. For nonC HLA-I ligands, healthy immunopeptidomics data from HLA ligand atlas was used to filter out peptides presented in healthy tissues at the ORF level to obtain the nonC-TL (right). B, Number of canonical and nonC HLA-I peptides identified per patient. C, Percentage of nonC peptides derived from predicted ORF present or absent in a healthy tissue immunopeptidome data set (nonC-HL and nonC-TL, respectively). D, ALC identification score of canonical and nonC-TL. E, Predicted hydrophobicity index (y axis) and retention time (x axis). Each dot represents a unique peptide sequence. F, Length distribution of unique HLA-I peptide sequences. Only peptides < 20 Aa are depicted. G, Percentage of peptides predicted to bind to the patient-specific HLA alleles according to NetMHCPan4.0. Peptides were categorized into strong binders (SB; %-tile ran ≤ 0.5), weak binders (WB; %-tile rank = 0.5–2), or nonbinders (NB; %-tile rank > 2). H, Number of nonC-TL originated from each of the ORF categories noted. I, HLA allele binding preference of Can and nonC-TL. For each peptide, only the min rank predicted by NetMHCpan4.0 was considered. J, Consensus peptide binding motif of the two HLAs predicted to present the majority of the nonC peptides identified. Image downloaded from NetMHCpan4.0 motif viewer. In all the analyses shown, the FDR threshold was set at 0.01 and ALC score at 30. (A, Created with BioRender.com.)
Figure 1.
Identification and characteristics of nonC HLA-I ligands presented by patient-derived TCLs. A, Diagram depicting the pipeline used to identify HLA-I ligands derived from canonical (Can) and nonC proteins presented by patient-derived TCL. The top 10 candidates for each MS spectrum were identified by de novo sequencing and aligned to a database containing the 3-frame transcriptome, 6-frame genome, and the NSM identified by WES. The FDR was calculated for each category shown using a stratified mixture model (left). All canonical peptides containing mutations as well as peptides derived from CGA or TAA were further studied. For nonC HLA-I ligands, healthy immunopeptidomics data from HLA ligand atlas was used to filter out peptides presented in healthy tissues at the ORF level to obtain the nonC-TL (right). B, Number of canonical and nonC HLA-I peptides identified per patient. C, Percentage of nonC peptides derived from predicted ORF present or absent in a healthy tissue immunopeptidome data set (nonC-HL and nonC-TL, respectively). D, ALC identification score of canonical and nonC-TL. E, Predicted hydrophobicity index (y axis) and retention time (x axis). Each dot represents a unique peptide sequence. F, Length distribution of unique HLA-I peptide sequences. Only peptides < 20 Aa are depicted. G, Percentage of peptides predicted to bind to the patient-specific HLA alleles according to NetMHCPan4.0. Peptides were categorized into strong binders (SB; %-tile ran ≤ 0.5), weak binders (WB; %-tile rank = 0.5–2), or nonbinders (NB; %-tile rank > 2). H, Number of nonC-TL originated from each of the ORF categories noted. I, HLA allele binding preference of Can and nonC-TL. For each peptide, only the min rank predicted by NetMHCpan4.0 was considered. J, Consensus peptide binding motif of the two HLAs predicted to present the majority of the nonC peptides identified. Image downloaded from NetMHCpan4.0 motif viewer. In all the analyses shown, the FDR threshold was set at 0.01 and ALC score at 30. (A, Created with BioRender.com.)
Figure 2. Candidate tumor antigens presented on HLA-I from patient-derived TCL identified through proteogenomics. A, Total number of unique peptide sequences derived from candidate tumor antigens (TA) by category. Data from all patients were pooled together. Only unique peptide sequences were considered. B, The number and category of TA are displayed for each TCL. C, The number of mutated peptides eluted from HLA-I (left) and number of NSM identified by WES (right) are displayed for each patient. D, Heat map displaying the number of epitopes derived from specific CGA or melanoma-associated antigens per patient. E, Number of nonC-TL originated from each ORF category per patient. F, Percentage of candidate TA uniquely identified in one patient or shared by TA category. The FDR threshold was set at 0.02 for mutations and 0.01 for all other categories.
Figure 2.
Candidate tumor antigens presented on HLA-I from patient-derived TCL identified through proteogenomics. A, Total number of unique peptide sequences derived from candidate tumor antigens (TA) by category. Data from all patients were pooled together. Only unique peptide sequences were considered. B, The number and category of TA are displayed for each TCL. C, The number of mutated peptides eluted from HLA-I (left) and number of NSM identified by WES (right) are displayed for each patient. D, Heat map displaying the number of epitopes derived from specific CGA or melanoma-associated antigens per patient. E, Number of nonC-TL originated from each ORF category per patient. F, Percentage of candidate TA uniquely identified in one patient or shared by TA category. The FDR threshold was set at 0.02 for mutations and 0.01 for all other categories.
Figure 3. Preexisting T-cell responses to candidate tumor antigens in patients with cancer. For each patient, reactivity was evaluated by co-incubating 2e4 T cells (TIL or PBL sorted on the basis of specific markers, e.g., PD1hi), with 2e5 autologous APC pulsed with 1 μg/mL of selected peptides either alone or in pools (PP). IFNγ ELISPOT and 4–1BB upregulation by FACS were used to measure T-cell responses after 20 hours. A, Reactivity to tumor antigen candidates for Mel-3. The number of IFNγ spots per well (top) and the percentage of cells expressing 4–1BB (bottom) are shown. Mutated peptides are plotted in turquoise, CGA in orange, melanoma-associated in purple, and nonC-TL in black. B, Representative ELISPOT results (top) and flow cytometry plots (bottom) for TIL-2 and TIL-5 from Mel-3 with the targets specified. C, TIL populations recognizing the mutated HLA-I peptides indicated were enriched by flow cytometry sorting of 4–1BB+ lymphocytes and expanded for 14 days. Plot showing gates used for sorting (left) and recognition of the targets specified after expansion (right). D, T-cell reactivity of neoantigen-enriched T-cell populations to serial dilutions of the WT or mutant (Mut) ETV1p.E455K and GEMIN5p.S1360L peptides. E, Neoantigen-enriched population was cocultured with COS-7 cells transfected with the indicated individual HLA-I alleles and pulsed with the corresponding peptides to determine the restriction element. F, Summary of the reactivity against candidate tumor antigens in all patients studied. The percentage and the absolute number of recognized and non-recognized peptides within each category are shown per patient (bar plot) and for all the patients studied (pie chart). The number of tumor-reactive lymphocytes tested for each patient is shown on the bottom. Plotted cells were gated on live CD3+CD8+lymphocytes. ‘>’ denotes greater than 500 spots/2e4 cells. *Mutation recognized previously identified. Experiments were performed twice. Aut.TCL: autologous tumor cell line.
Figure 3.
Preexisting T-cell responses to candidate tumor antigens in patients with cancer. For each patient, reactivity was evaluated by co-incubating 2e4 T cells (TIL or PBL sorted on the basis of specific markers, e.g., PD1hi), with 2e5 autologous APC pulsed with 1 μg/mL of selected peptides either alone or in pools (PP). IFNγ ELISPOT and 4–1BB upregulation by FACS were used to measure T-cell responses after 20 hours. A, Reactivity to tumor antigen candidates for Mel-3. The number of IFNγ spots per well (top) and the percentage of cells expressing 4–1BB (bottom) are shown. Mutated peptides are plotted in turquoise, CGA in orange, melanoma-associated in purple, and nonC-TL in black. B, Representative ELISPOT results (top) and flow cytometry plots (bottom) for TIL-2 and TIL-5 from Mel-3 with the targets specified. C, TIL populations recognizing the mutated HLA-I peptides indicated were enriched by flow cytometry sorting of 4–1BB+ lymphocytes and expanded for 14 days. Plot showing gates used for sorting (left) and recognition of the targets specified after expansion (right). D, T-cell reactivity of neoantigen-enriched T-cell populations to serial dilutions of the WT or mutant (Mut) ETV1p.E455K and GEMIN5p.S1360L peptides. E, Neoantigen-enriched population was cocultured with COS-7 cells transfected with the indicated individual HLA-I alleles and pulsed with the corresponding peptides to determine the restriction element. F, Summary of the reactivity against candidate tumor antigens in all patients studied. The percentage and the absolute number of recognized and non-recognized peptides within each category are shown per patient (bar plot) and for all the patients studied (pie chart). The number of tumor-reactive lymphocytes tested for each patient is shown on the bottom. Plotted cells were gated on live CD3+CD8+lymphocytes. ‘>’ denotes greater than 500 spots/2e4 cells. *Mutation recognized previously identified. Experiments were performed twice. Aut.TCL: autologous tumor cell line.
Figure 4. IVS of donor PBLs identified three nonC-TL shared across patient-derived TCLs. A, Donor PBL were IVS via three consecutive rounds of stimulation with 170 selected nonC-TL predicted to bind to HLA-A*11:01. Reactive T cells were enriched through FACS sorting based on CD8+ 4–1BB+ expression after 20 hours coculture with autologous B cells pulsed with the specific peptides and expanded for 14 days. The top 1 αβ pairs were cloned into a retroviral vector to transduce PBL and CD8+ mTCRB+ cells were FACS sorted to obtain a pure transduced population. B, Reactivity of antigen-specific T cells generated by IVS following FACS sorting enrichment. Frequency of 4–1BB+ on CD8+ cells after 20 hours coculture with B cells pulsed with the HPLC peptides specified is depicted. C, Restriction element was evaluated by coculturing enriched T-cell populations with COS-7 cells expressing the donor HLA alleles and pulsed with the corresponding peptides. D, Expression and translation of the immunogenic nonC-TL in multiple patient-derived TCL indirectly evaluated through the detection of 4–1BB expression of nonC antigen-specific T cells cocultured with TCL left untreated or electroporated with RNA encoding the specified HLA-I alleles. *B cells were not electroporated. ¥TCL naturally expressing HLA-A*11:01. n.a., not assessed. (A, Created with BioRender.com.)
Figure 4.
IVS of donor PBLs identified three nonC-TL shared across patient-derived TCLs. A, Donor PBL were IVS via three consecutive rounds of stimulation with 170 selected nonC-TL predicted to bind to HLA-A*11:01. Reactive T cells were enriched through FACS sorting based on CD8+ 4–1BB+ expression after 20 hours coculture with autologous B cells pulsed with the specific peptides and expanded for 14 days. The top 1 αβ pairs were cloned into a retroviral vector to transduce PBL and CD8+ mTCRB+ cells were FACS sorted to obtain a pure transduced population. B, Reactivity of antigen-specific T cells generated by IVS following FACS sorting enrichment. Frequency of 4–1BB+ on CD8+ cells after 20 hours coculture with B cells pulsed with the HPLC peptides specified is depicted. C, Restriction element was evaluated by coculturing enriched T-cell populations with COS-7 cells expressing the donor HLA alleles and pulsed with the corresponding peptides. D, Expression and translation of the immunogenic nonC-TL in multiple patient-derived TCL indirectly evaluated through the detection of 4–1BB expression of nonC antigen-specific T cells cocultured with TCL left untreated or electroporated with RNA encoding the specified HLA-I alleles. *B cells were not electroporated. ¥TCL naturally expressing HLA-A*11:01. n.a., not assessed. (A, Created with BioRender.com.)
Figure 5. Evaluation of the tumor specificity of the three immunogenic nonC-TL. A, RNA expression analysis in tumors (T) and matched healthy tissues (N) of the canonical genes encoding immunogenic nonC-TL compared with TAA and CGA. TCGA and GTEX data were obtained from GEPIA. B, CD8 coreceptor activation-dependence of PBL transduced with antigen-specific TCRs. FACS plots show the expression of 4–1BB by CD8 (gated on CD3+mTCR+) after coculture with peptide pulsed B cells. B cells pulsed with an irrelevant (Irrel.) peptide were used as negative control. C, TCR-transduced T cells purified by FACS sorting (CD8+mTCR+) were cocultured with B cells pulsed with serial dilutions of the corresponding peptide. SD mean is plotted. D, Expression and translation of nonC-TL in healthy human cells and selected TCLs was indirectly evaluated by coculturing control and electroporated target cells with RNA encoding the specified HLA alleles with sort purified TCR-transduced T cells. T-cell activation was assessed by measuring 4–1BB expression on CD8+mTCR+. ¥TCL naturally expressing HLA-A*11:01. n.a, non-assessed.
Figure 5.
Evaluation of the tumor specificity of the three immunogenic nonC-TL. A, RNA expression analysis in tumors (T) and matched healthy tissues (N) of the canonical genes encoding immunogenic nonC-TL compared with TAA and CGA. TCGA and GTEX data were obtained from GEPIA. B, CD8 coreceptor activation-dependence of PBL transduced with antigen-specific TCRs. FACS plots show the expression of 4–1BB by CD8 (gated on CD3+mTCR+) after coculture with peptide pulsed B cells. B cells pulsed with an irrelevant (Irrel.) peptide were used as negative control. C, TCR-transduced T cells purified by FACS sorting (CD8+mTCR+) were cocultured with B cells pulsed with serial dilutions of the corresponding peptide. SD mean is plotted. D, Expression and translation of nonC-TL in healthy human cells and selected TCLs was indirectly evaluated by coculturing control and electroporated target cells with RNA encoding the specified HLA alleles with sort purified TCR-transduced T cells. T-cell activation was assessed by measuring 4–1BB expression on CD8+mTCR+. ¥TCL naturally expressing HLA-A*11:01. n.a, non-assessed.

Comment in

Comment on

References

    1. Coulie PG, van den Eynde BJ, van der Bruggen P, Boon T. Tumor antigens recognized by T lymphocytes: at the core of cancer immunotherapy. Nat Rev Cancer 2014;14:135–46. - PubMed
    1. Brichard V, Pel Av, W6lfel T, W61fel C, de Plaen E, Leth6 B, et al. . The tyrosinase gene codes for an antigen recognized by autologous cytolytic T lymphocytes on HLA-A2 melanomas. 1993. Available from: http://rupress.org/jem/article-pdf/178/2/489/1267835/489.pdf - PMC - PubMed
    1. van der Bruggen P, Traversari C, Chomez P, Lurquin C, de Plaen E, van den Eynde B, et al. . A gene encoding an antigen recognized by cytolytic T lymphocytes on a human. New Series 1991;254. - PubMed
    1. Robbins PF, Morgan RA, Feldman SA, Yang JC, Sherry RM, Dudley ME, et al. . Tumor regression in patients with metastatic synovial cell sarcoma and melanoma using genetically engineered lymphocytes reactive with NY-ESO-1. J Clin Oncol 2011;29:917–24. - PMC - PubMed
    1. Morgan RA, Dudley ME, Wunderlich JR, Hughes MS, Yang JC, Sherry RM, et al. . Cancer regression in patients after transfer of genetically engineered lymphocytes. Science 2006;314:126–9. - PMC - PubMed