. 2023 Jul 25;19(14):4689-4700.
doi: 10.1021/acs.jctc.2c01270. Epub 2023 Feb 7.

Learning Correlations between Internal Coordinates to Improve 3D Cartesian Coordinates for Proteins

Affiliations

Learning Correlations between Internal Coordinates to Improve 3D Cartesian Coordinates for Proteins

Jie Li et al. J Chem Theory Comput. .

Abstract

We consider a generic representation problem of internal coordinates (bond lengths, valence angles, and dihedral angles) and their transformation to 3-dimensional Cartesian coordinates of a biomolecule. We show that the internal-to-Cartesian process relies on correctly predicting chemically subtle correlations among the internal coordinates themselves, and learning these correlations increases the fidelity of the Cartesian representation. We developed a machine learning algorithm, Int2Cart, to predict bond lengths and bond angles from backbone torsion angles and residue types of a protein, which allows reconstruction of protein structures better than using fixed bond lengths and bond angles or a static library method that relies on backbone torsion angles and residue types in a local environment. The method is able to be used for structure validation, as we show that the agreement between Int2Cart-predicted bond geometries and those from an AlphaFold 2 model can be used to estimate model quality. Additionally, by using Int2Cart to reconstruct an IDP ensemble, we are able to decrease the clash rate during modeling. The Int2Cart algorithm has been implemented as a publicly accessible python package at https://github.com/THGLab/int2cart.


Figures

Figure 1:
Figure 1:. Schematic of the polypeptide backbone and internal degrees of freedom.
Definition of the prediction targets: backbone bond angles θ1θ3, backbone bond lengths d1d3, CαCβ sidechain bond lengths r1 and NCαCβ sidechain bond angles α1.
Figure 2:
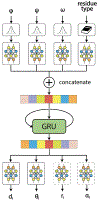
Figure 2:. Schematic of the Int2Cart neural network architecture.
The neural network is a gated recurrent unit (GRU) recurrent neural network. The inputs at each timestep are the concatenated latent vectors from Gaussian-smeared ϕ, ψ and ω torsion angles and embedded residue types; variations on the Int2Cart network can include the use of χ sidechain angles as well. The latent vector output from GRU are connected with multiple output networks to predict different targets.
Figure 3:
Figure 3:. Variations of bond angles and bond lengths as a function of (ϕ, ψ), or ω torsion angles.
a-f) Bond angle and bond length deviations from the mean values averaged over ϕ and ψ angles of the training set. The regions of red correspond to wider angles and longer bonds while the region in blue show reduced angle and bond values relative to the mean. The bond lengths and bond angles were categorized according to ϕ and ψ angles rounded to the closest tens, and the data are aggregated by calculating the means and standard deviations in each bin. The standard deviations are provided in Figure S1. g-i) Mean values and standard deviations of bond angles as a function of ω. The blue solid line represents mean values of bond angles at specific ω torsion angles, and the gray regions correspond to one standard deviation.
Figure 4:
Figure 4:. NCαC bond angle deviations from the mean values averaged over ϕ and ψ angles as a function of residue type.
The regions of red correspond to longer bonds while the region in blue show reduced bond values relative to the mean. The NCαC bond angles were categorized according to ϕ and ψ angles rounded to the closest tens.
Figure 5:
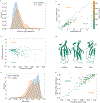
Figure 5:. Comparison of 3D Cartesian reconstructions of test set proteins using Int2Cart and compared to Fixed bonds and angles.
(a) Distribution of the RMSD in reconstructed Cartesian coordinates using Int2Cart and Fixed. (b) Comparison of Cartesian reconstruction error between Int2Cart and Fixed relative to the reference structure. (c) Improvement of Int2Cart over Fixed as a function of amino acid length. (d) An example of the backbone representation using Int2Cart and Fixed for the CASP12 TBM0872 protein, (e) The SS-match distribution and (f) comparison of SS-match for Int2Cart vs. Fixed across the test set.
Figure 6:
Figure 6:. Comparison of reconstructed structure Cα RMSD values in the test set as a function of sequence length using different sources of bond lengths and bond angles.
The Cα RMSDs were calculated against ground truth structures after using only their torsion angles for reconstruction. Shaded regions represent 1 standard deviation. The blue line represents Int2Cart, the orange line represents fixed bond lengths and angles, and the green line is the PGD method.
Figure 7:
Figure 7:. Correlation between AlphaFold2 (AF2) structure quality and the agreement between bond geometries from the AF2 predicted structures and Int2Cart predicted values using torsion angles from AF2 structures
(a) Correlation between θ1s (NCαC bond angles) from AF2 structures and Int2Cart predictions colored by AF2 pLDDT scores of the relevant residues. (b) Box plot showing distribution of AF2 pLDDT scores of individual residues based on absolute difference in θ1 between AF2 structures and Int2Cart predictions. The boxes represent the quartiles of the distribution and the whiskers represent the rest of the distribution. Individual data points are outliers identified from the inter-quartile range. (c) Relationship between the average AF2 structure prediction confidence (pLDDT score) and all bond angle correlations between AF2 and Int2Cart in an AF2 predicted protein structure (d) Relationship between the average AF2 structure prediction confidence (pLDDT score) and all bond angle absolute difference between AF2 and Int2Cart in an AF2 predicted protein structure.
Figure 8:
Figure 8:. Comparison of distribution of reconstruction RMSD for individual conformaions in the Sic1 IDP ensemble.
Structures reconstructed with Int2Cart method on average has lower RMSD to their original structures compared with using fixed bond lengths and bond angles.

Similar articles

Cited by

References

    1. Baker J; Kinghorn D; Pulay P. Geometry optimization in delocalized internal coordinates: An efficient quadratically scaling algorithm for large molecules. J. Chem. Phys 1999, 110, 4986–4991.
    1. Schwieters CD; Clore G. Internal Coordinates for Molecular Dynamics and Minimization in Structure Determination and Refinement. J. Magn. Reson 2001, 152, 288–302. - PubMed
    1. Adcock SA; McCammon JA Molecular Dynamics: Survey of Methods for Simulating the Activity of Proteins. Chem. Rev 2006, 106, 1589–1615, PMID: 16683746. - PMC - PubMed
    1. wwPDB consortium, Protein Data Bank: the single global archive for 3D macromolecular structure data. Nucleic Acids Res. 2018, 47, D520–D528. - PMC - PubMed
    1. Parsons J; Holmes JB; Rojas JM; Tsai J; Strauss CE Practical conversion from torsion space to Cartesian space for in silico protein synthesis. J. Comput. Chem 2005, 26, 1063–1068. - PubMed