. 2023 Feb;11(3):e15599.
doi: 10.14814/phy2.15599.

Impaired calcium handling mechanisms in atrial trabeculae of diabetic patients

Affiliations

Impaired calcium handling mechanisms in atrial trabeculae of diabetic patients

Timothy L M Jones et al. Physiol Rep. 2023 Feb.

Abstract

The aim of this study was to investigate cardiomyocyte Ca2+ handling and contractile function in freshly excised human atrial tissue from diabetic and non-diabetic patients undergoing routine surgery. Multicellular trabeculae (283 ± 20 μm in diameter) were dissected from the endocardial surface of freshly obtained right atrial appendage samples from consenting surgical patients. Trabeculae were mounted in a force transducer at optimal length, electrically stimulated to contract, and loaded with fura-2/AM for intracellular Ca2+ measurements. The response to stimulation frequencies encompassing the physiological range was recorded at 37°C. Myofilament Ca2+ sensitivity was assessed from phase plots and high potassium contractures of force against [Ca2+ ]i . Trabeculae from diabetic patients (n = 12) had increased diastolic (resting) [Ca2+ ]i (p = 0.03) and reduced Ca2+ transient amplitude (p = 0.04) when compared to non-diabetic patients (n = 11), with no difference in the Ca2+ transient time course. Diastolic stress was increased (p = 0.008) in trabeculae from diabetic patients, and peak developed stress decreased (p ≤ 0.001), which were not accounted for by reduction in the cardiomyocyte, or contractile protein, content of trabeculae. Trabeculae from diabetic patients also displayed diminished myofilament Ca2+ sensitivity (p = 0.018) compared to non-diabetic patients. Our data provides evidence of impaired calcium handling during excitation-contraction coupling with resulting contractile dysfunction in atrial tissue from patients with type 2 diabetes in comparison to the non-diabetic. This highlights the importance of targeting cardiomyocyte Ca2+ homeostasis in developing more effective treatment options for diabetic heart disease in the future.

Keywords: calcium handling; diabetes; human right atrial trabeculae; myofilament sensitivity.


Conflict of interest statement

The authors declare no conflicts of interest.

Figures

FIGURE 1
FIGURE 1
Cardiac trabeculae: structure and example data. (a) and (b) Representative trabeculae data from ND and T2D patients, respectively. Intracellular Ca2+ is shown in red, assessed by the 340/380 fura‐2 emitted fluorescence ratio. Contractile stress is shown in black, assessed by the force produced by the muscle, normalized to the total XSA of the muscle as determined by immunohistochemistry. (c, d) Example images of fixed trabeculae from non‐diabetic patients, labeled using immunohistochemistry in the transverse and longitudinal planes, respectively. Both sections were labeled with wheat germ agglutinin (WGA, green), labelling sialic acid residues on the cell membranes and extracellular matrix, and phalloidin (Phal, red), labelling cardiomyocyte myofilament F‐actin.
FIGURE 2
FIGURE 2
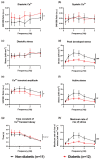
Trabeculae Ca2+ handling and contractile parameters during force–frequency response. Ca2+ handling and contractile parameters were obtained from each trabecula by averaging 10 consecutive Ca2+ transients, and their associated twitches, at six different stimulation frequencies. Mean ± SEM trabeculae data are shown from n = 11 ND and n = 12 T2D patients. Significance was determined by two‐way ANOVA, with #p ≤ 0.05, and ###p ≤ 0.001 for the group effect. Ca2+ transient parameters are shown in panels: (a) diastolic, (b) systolic, (e) amplitude (peak minus diastolic), and the (g) time constant of Ca2+ decay. Contractile parameters are shown in panels: (c) diastolic stress, d) peak developed stress, (f) active (systolic minus diatolic) stress, and (h) the maximum rate of rise in stress.
FIGURE 3
FIGURE 3
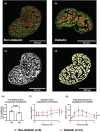
Immunohistochemical analysis of trabeculae cross‐sectional area. 10 μm thick sections of human RAA trabeculae imaged on a Zeiss LSM 710 confocal microscope. (a) and (b) Examples of images of trabeculae from ND and T2D patients, respectively. Sialic acid residues labeled with WGA are shown in green while myofilament f‐actin labeled with phalloidin is shown in red. (c) The method of measuring total trabecula XSA by tracing the outline of the WGA labelling (shown in white). (d) The method of measuring myofilament XSA by outlining the phalloidin labelling and measuring the area within using Fiji. (e) The percentage of total XSA occupied by myofilaments from eight trabeculae from ND patients and 11 trabeculae from T2D patients. (f) and (g) The diastolic and peak developed stress, respectively during the force frequency response normalized to myofilament XSA. All data are presented as mean ± SEM with significance determined by unpaired t‐tests, or two‐way ANOVA, with #representing p ≤ 0.05 and ###p ≤ 0.001 for the group effect.
FIGURE 4
FIGURE 4
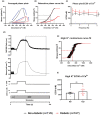
Myofilament Ca2+ sensitivity. Assessment of myofilament Ca2+ sensitivity through either phase plots generated from Ca2+ transients and associated contractions during the force‐frequency response, or from exposure to high [K+] contractures. (a) Representative phase plots from averaged data at 1 Hz in trabeculae from patients with (red), and without (black) diabetes. (b) The curve fits for the relaxation component of the phase plots in (a), with dotted lines for the calculated EC50 values. (c) The calculated EC50 values from the curve fits during the force frequency response in trabeculae from ND (n = 11) and T2D (n = 12) patients. (d) An example of a high K+ contracture with the dotted rectangle representing the relaxation phase used for curve fitting. (e) An example of curve fitting for a representative high K+ contracture. (f) The calculated EC50 mean values of the high K+ contractures in trabeculae from T2D (n = 7) and ND (n = 9). Data are presented as mean ± SEM with significance determined by two‐way ANOVA, with # representing p ≤ 0.05 for the group effect.

References

    1. Akella, A. B. , Ding, X. L. , Cheng, R. , & Gulati, J. (1995). Diminished Ca2+ sensitivity of skinned cardiac muscle contractility coincident with troponin T‐band shifts in the diabetic rat. Circulation Research, 76(4), 600–606. - PubMed
    1. Allo, S. N. , Lincoln, T. M. , Wilson, G. L. , Green, F. J. , Watanabe, A. M. , & Schaffer, S. W. (1991). Non‐insulin‐dependent diabetes‐induced defects in cardiac cellular calcium regulation. The American Journal of Physiology, 260(6 Pt 1), C1165–C1171. - PubMed
    1. Backx, P. H. , Gao, W. D. , Azanbackx, M. D. , & Marban, E. (1995). The relationship between contractile‐force and intracellular [Ca2+] in intact rat cardiac trabeculae. The Journal of General Physiology, 105(1), 1–19. - PMC - PubMed
    1. Belke, D. D. , & Dillmann, W. H. (2004). Altered cardiac calcium handling in diabetes. Current Hypertension Reports, 6(6), 424–429. - PubMed
    1. Bers, D. M. (2002). Cardiac excitation–contraction coupling. Nature, 415(6868), 198–205. - PubMed

Publication types

MeSH terms