. 2023 Feb 7;6(4):e202201650.
doi: 10.26508/lsa.202201650. Print 2023 Apr.

Expansion microscopy reveals subdomains in C. elegans germ granules

Affiliations

Expansion microscopy reveals subdomains in C. elegans germ granules

Kin M Suen et al. Life Sci Alliance. .

Erratum in

Abstract

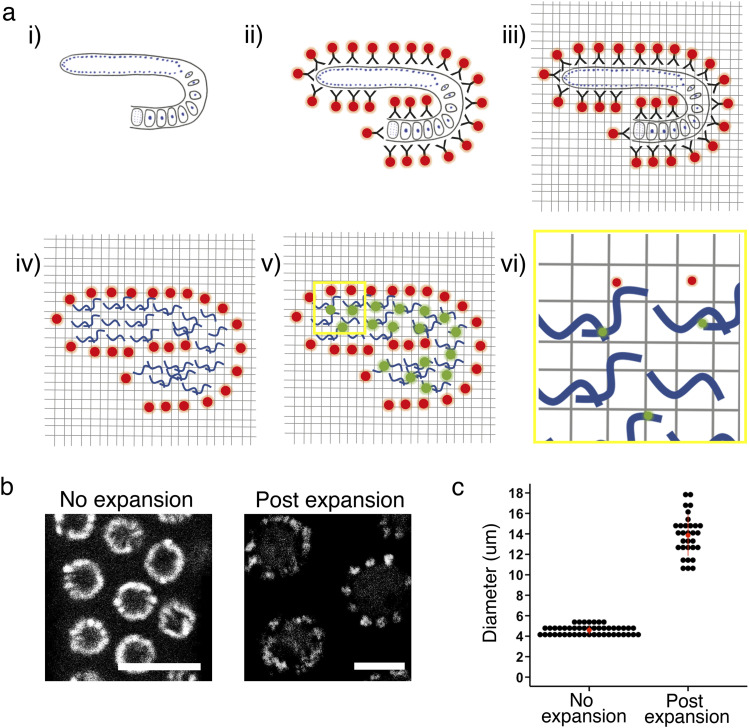
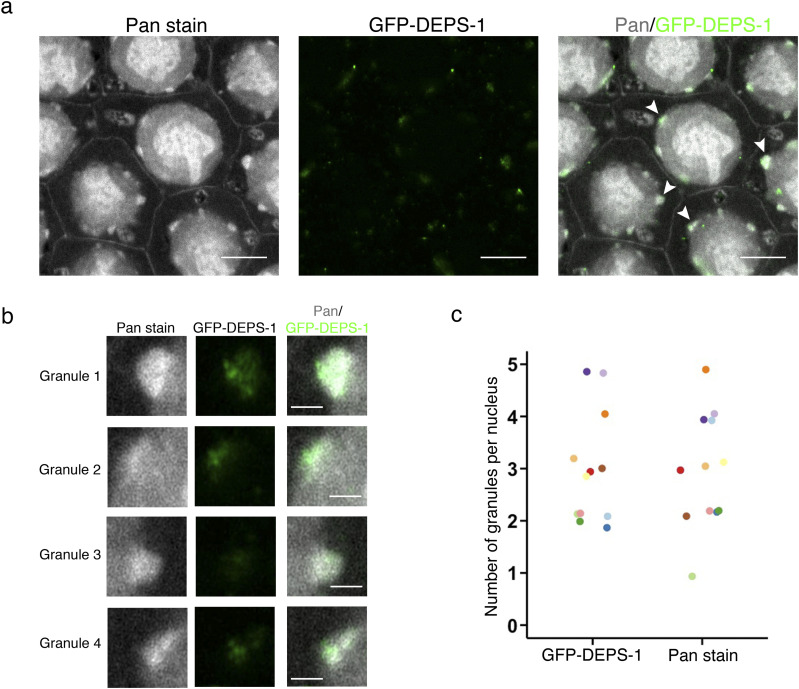
Light and electron microscopy techniques have been indispensable in the identification and characterization of liquid-liquid phase separation membraneless organelles. However, for complex membraneless organelles such as the perinuclear germ granule in C. elegans, our understanding of how the intact organelle is regulated is hampered by (1) technical limitations in confocal fluorescence imaging for the simultaneous examination of multiple granule protein markers and (2) inaccessibility of electron microscopy. We take advantage of the newly developed super resolution method of expansion microscopy (ExM) and in situ staining of the whole proteome to examine the C. elegans germ granule, the P granule. We show that in small RNA pathway mutants, the P granule is smaller compared with WT animals. Furthermore, we investigate the relationship between the P granule and two other germ granules, Mutator foci and Z granule, and show that they are located within the same protein-dense regions while occupying distinct subdomains within this ultrastructure. This study will serve as an important tool in our understanding of germ granule biology and the biological role of liquid-liquid phase separation.


Conflict of interest statement

The authors declare that they have no conflict of interest.

Figures

Figure 1.
Figure 1.. Workflow of expansion microscopy on C. elegans germline.
(A) Schematic of workflow. 3× EExM of immune-stained C. elegans germline with pan-protein stain. (i, ii) Dissected C. elegans germline tissues are stained with primary antibodies followed by fluorescently labelled secondary antibodies. (iii) Tissue is then chemically cross-linked to hydrogel which forms a mold of the tissue. (iv) Proteins within the tissue are digested before (v) pan-protein staining, whereby free amines are labelled with fluorescent dye. (vi) Hydrogel is expanded 3× and imaged. Resulting resolutions are xy ∼40 nm and z ∼100 nm. (B) DAPI staining of the pachytene nuclei in C. elegans germline pre- and post-expansion. Scale bar = 10 µm. (C) Nucleus diameter measured via DAPI staining to determine expansion factor. The average expansion factor across experiments is 3×. 31 expanded nuclei were measured from six independent experiments, and 47 non-expanded nuclei were measured from three independent experiments. Source data are available for this figure.
Figure S1.
Figure S1.. Expansion isotropy of C. elegans germline.
(A) Pan-protein staining of the germline tissue pre-expansion. Germ granules cannot be easily observable without expansion. Scale bar = 10 µm. (B) Aspect ratio of nuclei DAPI staining of pre- and post-expansion of germline tissue in the pachytene region. Source data are available for this figure.
Figure 2.
Figure 2.. Pan-protein staining reveals P granules as protein-dense perinuclear structures.
(A) Pan-protein (NHS ester) and anti-GFP staining of animals expressing gfp::deps-1. Pan-protein staining reveals a number of features including P granules. GFP-DEPS-1 condensates (green) are localised to the P granule (gray). White arrows highlight P granules that are enlarged in (B). Scale bar = 10 µm. (B) Zoomed images of P granules highlighted by arrowheads in (A). DEPS-1 condensates appear as small protein clusters that are localised to P granules. Scale bar = 2 µm. (C) Number of granules observed per nucleus in a single optical slice. Granule is defined as perinuclear density observed either via GFP-DEPS-1 staining (green) or pan-protein staining (NHS ester; gray). 12 nuclei from four independent experiments were counted. Counts obtained from the same nucleus have the same colour. Source data are available for this figure.
Figure 3.
Figure 3.. Mutator foci are juxtaposed to PRG-1 condensates.
(A) Pan-protein (NHS ester), anti–PRG-1, and anti-GFP staining of animals expressing GFP-tagged MUT-16. PRG-1 (red) and MUT-16 (green) colocalise to P granules (gray). MUT-16 and PRG-1 occupy distinct areas, whereby MUT-16 is frequently observed on the edge of the P granule space. White arrowheads in merged image highlight granules that are enlarged in (B). Scale bar = 10 µm. (B) Zoomed image of granules marked by arrowheads in (A). PRG-1 (red) exists as small cluster of proteins within the P granule. White line outlines the P granule boundary based on pan-protein staining (gray). MUT-16 (green) appears as single clusters that are either inside the P granule (granules 1, 3, and 4) or outside the P granule (granules 1 and 2). Scale bar = 2 µm. For each granule, the intensity of the staining was measured along the white arrow (inset of the plots) and normalized to the intensity of the entire granule to show the distribution of MUT-16 (green) and PRG-1 (red) relative to germ granule (gray). Source data are available for this figure.
Figure 4.
Figure 4.. ZNFX-1 and PRG-1 condensates are subdomains within the same germ granules.
(A) Pan-protein (NHS ester), anti–PRG-1, and anti-GFP staining of animals expressing GFP-tagged ZNFX-1. PRG-1 (red) and ZNFX-1 (green) colocalise to P granules (gray). ZNFX-1 and PRG-1 occupy distinct, and overlapping areas within the P granule space. White arrowheads in merged image highlight granules that are enlarged in (B). Scale bar = 10 µm. (B) Zoomed image of granules marked by arrowheads in (A). Both PRG-1 (red) and ZNFX-1 (green) exist as small clusters of proteins within the P granule. The white line outlines the P granule boundary based on pan-protein staining (gray). ZNFX-1 is concentrated in areas closer to the cytoplasmic edge of the P granule than PRG-1 (granules 1, 3, and 4). Scale bar = 2 µm. For each granule, the intensity of the staining was measured along the white arrow (inset of the plots) and normalized to the intensity of the entire granule to show the distribution of ZNFX-1 (green) and PRG-1 (red) relative to germ granule (gray). Source data are available for this figure.
Figure 5.
Figure 5.. P granules are malformed in animals defective in small RNA pathways.
(A) Pan-protein (NHS ester) and anti-GFP staining of animals expressing gfp::deps-1. Scale bar = 10 µm. (B) Pan-protein (NHS ester) and anti–PRG-1 staining of deps-1(bn124) mutant animals. deps-1 mutation leads to a reduction in the size of germ granules. Arrowheads highlight a germ granule that is mislocalised. Scale bar = 10 µm. The intensity of the staining was measured along the white arrow (inset of the plot; scale bar = 2 µm) and normalized to the intensity of the entire granule to show the distribution of PRG-1 relative to the germ granule. (C) Pan-protein (NHS ester), anti-DEPS-1, and anti–PRG-1 staining of mut-16 (pk710) mutant animals. mut-16 mutation leads to a reduction in the size of germ granules. Scale bar = 10 µm. (D) P granule size in WT animals, deps-1 (bn124), and mut-16 (pk710) mutants. P granule size was calculated by measuring the maximum length of the P granule perpendicular to the nuclear membrane and normalizing it to the diameter of the nucleus. P granules are smaller in both mutants compared with WT animals. *P-value < 0.001 and **P-value < 0.0001. Source data are available for this figure.
Figure S2.
Figure S2.. Germ granules in deps-1 mutants dissociates from nuclear membrane.
(A) Pan-protein and anti–PRG-1 staining of deps-1 (bn124) mutant. Arrow heads highlight a germ granule that is mislocalised. Scale bar = 10 µm. The intensity of the staining was measured along the white arrow (inset of the plot; scale bar = 2 µm) and normalized to the intensity of the entire granule to show the distribution of PRG-1 relative to the germ granule. Source data are available for this figure.

References

    1. Banani SF, Lee HO, Hyman AA, Rosen MK (2017) Biomolecular condensates: Organizers of cellular biochemistry. Nat Rev Mol Cell Biol 18: 285–298. 10.1038/nrm.2017.7 - DOI - PMC - PubMed
    1. Batista PJ, Ruby JG, Claycomb JM, Chiang R, Fahlgren N, Kasschau KD, Chaves DA, Gu W, Vasale JJ, Duan S, et al. (2008) PRG-1 and 21U-RNAs interact to form the piRNA complex required for fertility in C. elegans. Mol Cell 31: 67–78. 10.1016/j.molcel.2008.06.002 - DOI - PMC - PubMed
    1. Brangwynne CP, Eckmann CR, Courson DS, Rybarska A, Hoege C, Gharakhani J, Julicher F, Hyman AA (2009) Germline P granules are liquid droplets that localize by controlled dissolution/condensation. Science 324: 1729–1732. 10.1126/science.1172046 - DOI - PubMed
    1. Büttner M, Lagerholm CB, Waithe D, Galiani S, Schliebs W, Erdmann R, Eggeling C, Reglinski K (2021) Challenges of using expansion microscopy for super-resolved imaging of cellular organelles. Chembiochem 22: 686–693. 10.1002/cbic.202000571 - DOI - PMC - PubMed
    1. Chen F, Tillberg PW, Boyden ES (2015) Expansion microscopy. Science 347: 543–548. 10.1126/science.1260088 - DOI - PMC - PubMed

Publication types

MeSH terms

Substances