

Measuring cognitive effort without difficulty
- PMID: 36750498
- PMCID: PMC10050044
- DOI: 10.3758/s13415-023-01065-9
Measuring cognitive effort without difficulty
Erratum in
-
Correction: Measuring cognitive effort without difficulty.Cogn Affect Behav Neurosci. 2023 Apr;23(2):457. doi: 10.3758/s13415-023-01078-4. Cogn Affect Behav Neurosci. 2023. PMID: 36823251 Free PMC article. No abstract available.
Abstract
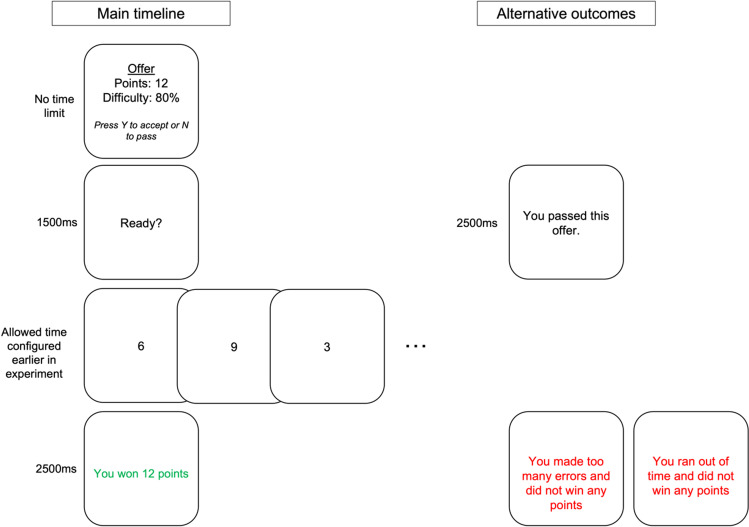
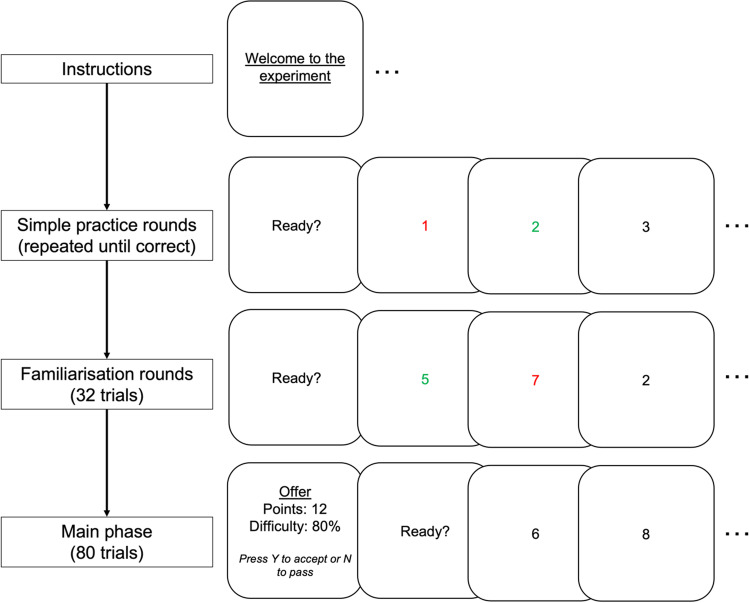
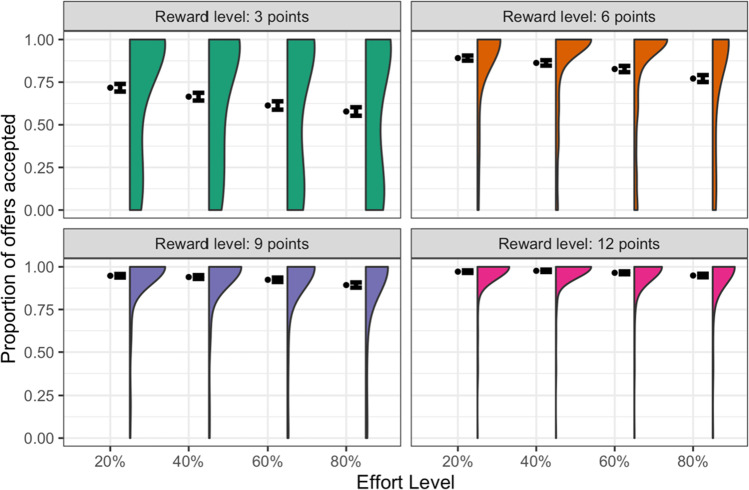
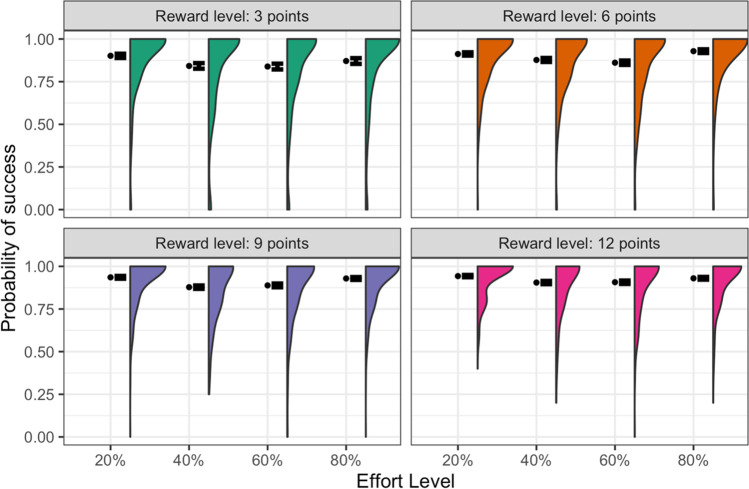
An important finding in the cognitive effort literature has been that sensitivity to the costs of effort varies between individuals, suggesting that some people find effort more aversive than others. It has been suggested this may explain individual differences in other aspects of cognition; in particular that greater effort sensitivity may underlie some of the symptoms of conditions such as depression and schizophrenia. In this paper, we highlight a major problem with existing measures of cognitive effort that hampers this line of research, specifically the confounding of effort and difficulty. This means that behaviour thought to reveal effort costs could equally be explained by cognitive capacity, which influences the frequency of success and thereby the chance of obtaining reward. To address this shortcoming, we introduce a new test, the Number Switching Task (NST), specially designed such that difficulty will be unaffected by the effort manipulation and can easily be standardised across participants. In a large, online sample, we show that these criteria are met successfully and reproduce classic effort discounting results with the NST. We also demonstrate the use of Bayesian modelling with this task, producing behavioural parameters which can be associated with other measures, and report a preliminary association with the Need for Cognition scale.
Keywords: Anhedonia; Cognitive effort; Computational psychiatry; Depression; Individual differences; New measures.
© 2023. The Author(s).
Conflict of interest statement
HF has no financial or non-financial interests to declare. OJR's MRC senior fellowship is partially in collaboration with Cambridge Cognition Ltd (who plan to provide in-kind contribution) and he is running an investigator-initiated trial with medication donated by Lundbeck (escitalopram and placebo, no financial contribution). He also holds an MRC-Proximity to discovery award with Roche (who provide in-kind contributions and have sponsored travel for ACP) regarding work on heart-rate variability and anxiety. He also has completed consultancy work on affective bias modification for Peak and online CBT for IESO digital health. OJR sits on the committee of the British Association of Psychopharmacology. In the past 3 years, JPR has held a PhD studentship co-funded by Cambridge Cognition and performed consultancy work for GE Ltd. These disclosures are made in the interest of full transparency and do not constitute a conflict of interest with the current work.
Figures
References
-
- Ang, Y., Gelda, S., & Pizzagalli, D. (2022). Cognitive effort-based decision-making in major depressive disorder. Psychological Medicine, 1–8. 10.1017/S0033291722000964 - PubMed
-
- Bates D, Mächler M, Bolker B, Walker S. Fitting Linear Mixed-Effects Models Using lme4. Journal of Statistical Software. 2015;67(1):1–48. doi: 10.18637/jss.v067.i01. - DOI
-
- Betancourt, M. (2018). A conceptual introduction to Hamiltonian Monte Carlo. ArXiv:1701.02434. https://arxiv.org/abs/1701.02434. Accessed 29 Jan 2023
Publication types
MeSH terms
Grants and funding
LinkOut - more resources
Full Text Sources
Miscellaneous
