. 2023 Feb 7;14(1):663.
doi: 10.1038/s41467-023-36325-2.

Dissecting the immune suppressive human prostate tumor microenvironment via integrated single-cell and spatial transcriptomic analyses

Affiliations

Dissecting the immune suppressive human prostate tumor microenvironment via integrated single-cell and spatial transcriptomic analyses

Taghreed Hirz et al. Nat Commun. .

Abstract

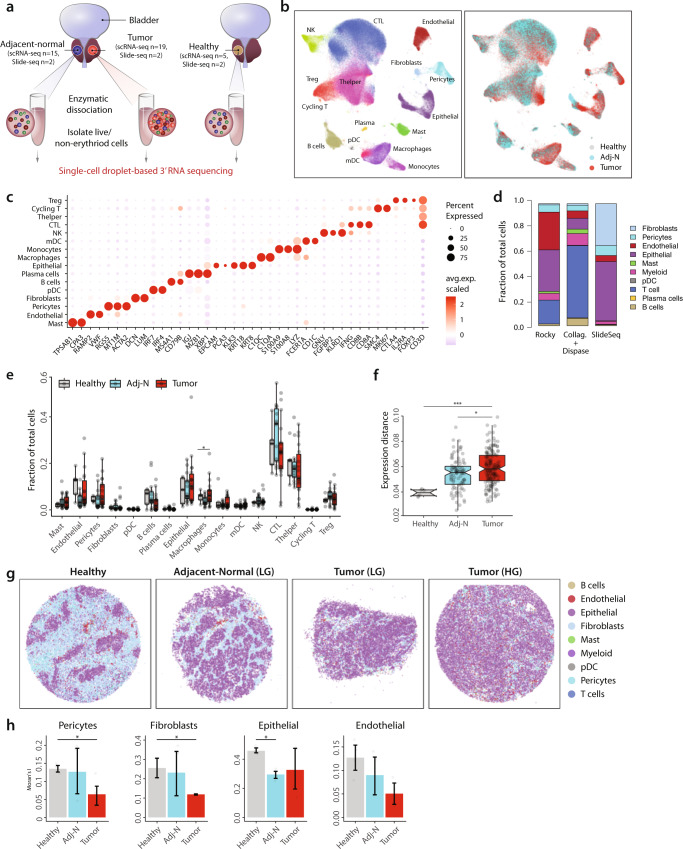
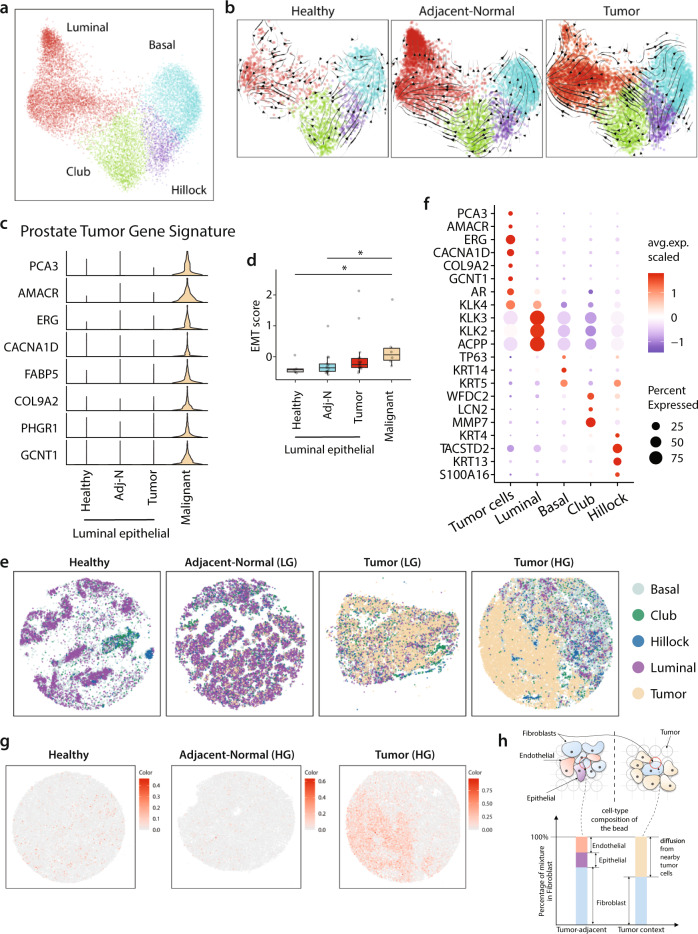
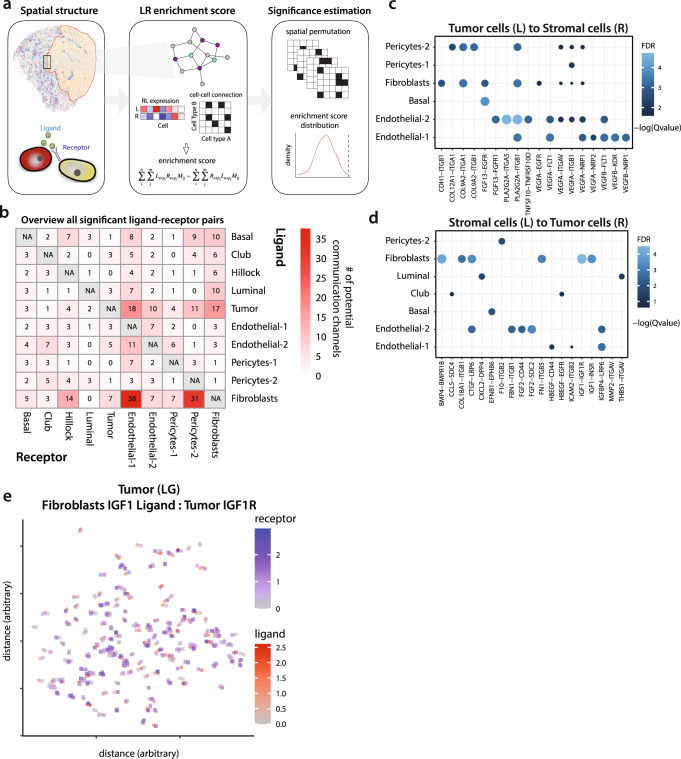
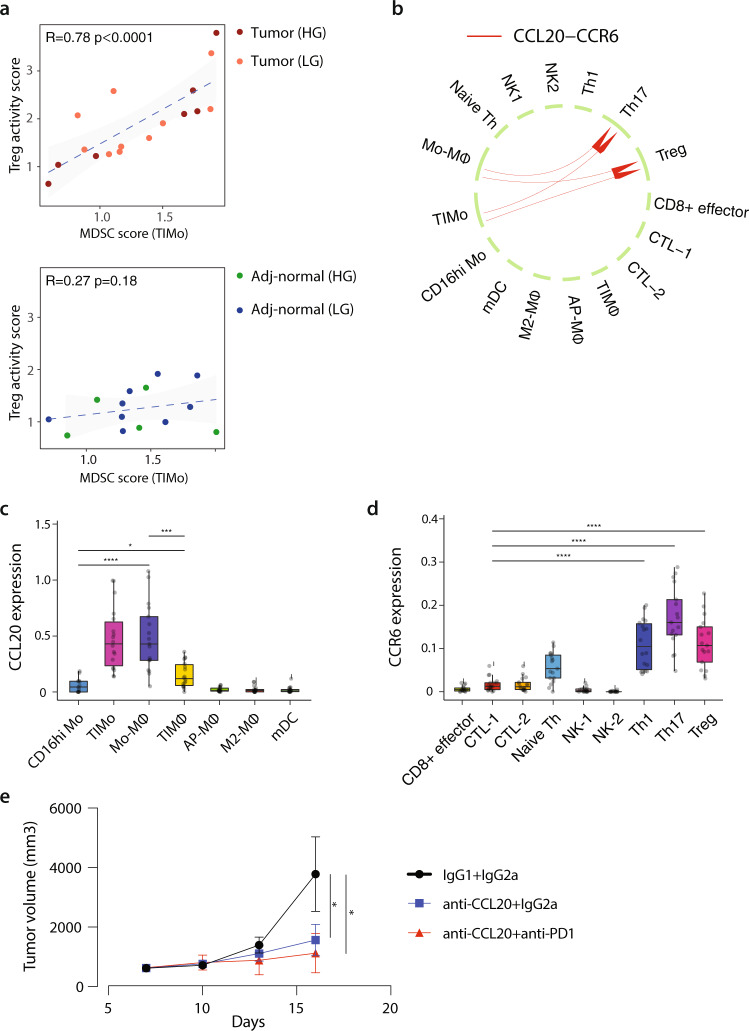
The treatment of low-risk primary prostate cancer entails active surveillance only, while high-risk disease requires multimodal treatment including surgery, radiation therapy, and hormonal therapy. Recurrence and development of metastatic disease remains a clinical problem, without a clear understanding of what drives immune escape and tumor progression. Here, we comprehensively describe the tumor microenvironment of localized prostate cancer in comparison with adjacent normal samples and healthy controls. Single-cell RNA sequencing and high-resolution spatial transcriptomic analyses reveal tumor context dependent changes in gene expression. Our data indicate that an immune suppressive tumor microenvironment associates with suppressive myeloid populations and exhausted T-cells, in addition to high stromal angiogenic activity. We infer cell-to-cell relationships from high throughput ligand-receptor interaction measurements within undissociated tissue sections. Our work thus provides a highly detailed and comprehensive resource of the prostate tumor microenvironment as well as tumor-stromal cell interactions.


Conflict of interest statement

A.O.S. own shares in TScan Therapeutics and BioNTech. P.V.K. serves on the Scientific Advisory Board to Celsius Therapeutics Inc. and Biomage Inc. P.V.K. is an employee of Altos Labs. D.T.S. is a founder, director, and stockholder of Magenta Therapeutics, Clear Creek Bio, and LifeVaultBio. He is a director and stockholder of Agios Pharmaceuticals and Editas Medicines and a founder and stockholder of Fate Therapeutics and Geruda Therapeutics. He is a consultant for FOG Pharma, Inzen Therapeutics, ResoluteBio, and VCanBio and receives sponsored research support on an unrelated project from Sumitomo Dianippon. D.B.S. is a founder, consultant, and shareholder for Clear Creek Bio. K.S. is a recipient of sponsored research funding from Convergent Genomics. F.C. and E.Z.M. are consultants for Atlas Bio, inc. The remaining authors declare no competing interests.

Figures

Fig. 1
Fig. 1. The prostate TME characterized by single-cell and spatial transcriptomic analyses.
a Schematic illustration of samples collection and processing. b Integrative analysis of scRNA-seq samples visualized using a common UMAP embedding for cell annotation (left) and sample fractions (right). c Dotplot representing key-marker gene expression in major cell types. The color represents scaled average expression of marker genes in each cell type, and the size indicates the proportion of cells expressing marker genes. d Stacked barplots showing the fractional composition of cell number for different clusters within scRNA-seq (using two different dissociation protocols: Collagenases+Dispase and Rocky, see text) and Slide-seqV2. e Boxplot comparing proportion of major cell populations between healthy prostate tissues (n = 5) and tissues collected from cancerous prostates (tumor n = 18 and adj-normal n = 14). Significance was assessed using two-sided Wilcoxon rank-sum test (Macrophage: *p = 0.03). f Boxplot showing inter-individual gene expression distances (based on Pearson correlation) within healthy, adj-normal, and tumor samples, averaged across all cell types. Significance was assessed using two-sided Wilcoxon rank-sum test (tumor vs. adj-normal *p = 0.015; Tumor vs. Healthy ***p = 0.0003). Boxplots in e, f include centerline, median; box limits, upper and lower quartiles; and whiskers are highest and lowest values no greater than 1.5× interquartile range. g Spatial presentation at a high-resolution level using Slide-seqV2 for the major cell populations in healthy (n = 4), adj-normal of LG case (n = 2), and two tumor tissues collected from a low-grade (Tumor-LG n = 2) and high-grade (Tumor-HG n = 2) patients. Patinets ID from Supplementary Data 2 represented here as healthy is HP1, adj-normal of LG case is Benign04, tumor tissue of LG case is Tumor08, tumor tissue of HG case is Tumor02. h Barplots showing spatial autocorrelation (Moran’s I) of fibroblasts and pericytes in Healthy (n = 4), adj-Nomral (n = 4), and Tumor samples (n = 4). Moran’s I evaluates whether the cells are clustered (high Moran’s I score) or dispersed (low Moran’s I score). Statistical analysis was performed using two-sided Wilcoxon rank-sum test. (Pericytes *p = 0.03; Fibroblasts *p = 0.029; Epithelial *p = 0.03, error bars: SEM). Source data are provided as a Source Data file. P values <0.05 were considered significant: *p < 0.05; **p < 0.01; ***p < 0.001; ****p < 0.0001.
Fig. 2
Fig. 2. A Prostate Tumor Gene Signature distinguishes normal and malignant luminal epithelial cells.
a Joint embedding represent the detailed annotation of epithelial subpopulations in prostate tissues. b RNA velocity analysis of the transitions of epithelial cells, estimated on different sample fraction. c Violin plot showing the expression of genes panel of “Prostate Tumor Gene Signature” in malignant cells and in the epithelial luminal cells of healthy, adj-normal, and tumor prostate samples. d Boxplot representing the epithelial-mesenchymal transition (EMT) score in malignant cells (n = 6) and the luminal epithelial cells of healthy (n = 5), adj-normal (n = 14), and tumor (n = 17) prostate samples. The box is bounded by the first and third quartile with a horizontal line at the median and whiskers extend to the maximum and minimum value. Significance was assessed using two-sided Wilcoxon rank-sum test (Malignant vs. adj-normal *p = 0.02; Malignant vs. Healthy *p = 0.03). e Spatial presentation of epithelial subpopulations in healthy (n = 4), adj-normal (Adj-normal LG n = 2) and two tumor tissues collected from low-grade (Tumor-LG n = 2) and high-grade (Tumor-HG n = 2) patients. Patinets ID from Supplementary Data 2 represented here as healthy is HP1, adj-normal of LG case is Benign04, tumor tissue of LG case is Tumor08, tumor tissue of HG case is Tumor02. f Dotplot representing key-marker genes expression in epithelial subpopulations in Slide-seqV2. The color represents scaled average expression of marker genes in each cell type, and the size indicates the proportion of cells expressing marker genes. g Spatial presentation for “Prostate Tumor Gene Signature” average expression in healthy, adjacent-normal (HG) and tumor (HG) Slide-SeqV2 pucks. h A schematic view of the admixture problem in the Slide-seqV2 puck. The barplot shows the cell type composition in two different contexts within the same puck. The barplot related to the tumor context contains substantial admixture from nearby tumor cells whereas the one related to tumor-adjacent context is a heterogeneous mixture of different cell types. Source data are provided as a Source Data file.
Fig. 3
Fig. 3. The prostate tumor microenvironment exhibits high endothelial angiogenic activity.
a Joint embedding represent the detailed annotation of stromal cells in prostate tissues. b Overview of enriched GO terms of top 200 upregulated genes for each stromal subpopulation based on single-cell data analysis. c Boxplot comparing the angiogenesis signature across the three different sample fractions (healthy n = 5; adj-normal n = 14; tumor n = 18) for each stromal subpopulation. See Supplementary Data 4 for the genes defining angiogenesis signature. Boxplots include centerline, median; box limits, upper and lower quartiles; and whiskers are highest and lowest values no >1.5× interquartile range. Statistical significance was accessed using two-sided Wilcoxon rank-sum test (*p < 0.05, ****p < 0.0001), p values could be found in Supplementary Data 6. d The scatterplot showing the effect of linear model-based correction on Endothelial-2 cells. Red dots indicate tumor marker genes. The x axis is the log-fold change of the genes without the correction, the y axis is the same after the correction. The top DE genes are text-labeled. e Dotplot shows enriched GO terms of upregulated genes in Endothelial-2 cells in a tumor context compared to tumor-adjacent context. f Spatial presentation at a high-resolution level using Slide-seqV2 for the stromal subpopulations in healthy (n = 4), adj-normal (Adj-normal LG n = 2), and two tumor tissues collected from a low-grade (Tumor-LG n = 2) and high-grade (Tumor-HG n = 2) patients. Patients ID from Supplementary Data 2 represented here as healthy is HP1, adj-normal of LG case is Benign04, tumor tissue of LG case is Tumor08, tumor tissue of HG case is Tumor02. g Comparison of spatial autocorrelation (Moran’s I) of Endothelial-2 cells and Pericytes-1 cells in healthy (n = 4), adj-normal (n = 4), and tumor samples (n = 4). Statistical significance was accessed using two-sided Wilcoxon rank-sum test (Endothelial cells-2 *p = 0.03. Pericytes-1: Tumor vs. Adj-normal *p = 0.03; Tumor vs. Healthy ***p = 0.03; Healthy vs. Adj-normal *p = 0.03, error bars: SEM). Source data are provided as a Source Data file. P values <0.05 were considered significant: *p < 0.05; **p < 0.01; ***p < 0.001; ****p < 0.0001.
Fig. 4
Fig. 4. Coordination between tumor cells and stromal compartment in tumor context.
a Schematic of ligand-receptor analysis for Slide-seqV2 data. b Summary of the total number of significant ligand-receptor interactions between stromal and epithelial cells. Each cell indicates potential channels of communication from ligand (row) to receptor (column). c, d Communication channels between tumor cells and stromal cells, communication from tumor cells (ligand) to stromal cells (receptor) (c), and from stromal cells (ligand) to tumor cells (receptor) (d). Color and size represent the significance (−log10 adjust p value) of ligand and receptor pairs, (e.g., Ligand IGF1 in fibroblasts and receptor IGF1Rin tumor cells). e Dot plot showing expression of IGF1 ligand-IGF1 receptor (IGF1R) axis in colocalized fibroblasts and tumor cells, respectively, on a low-grade (LG) tumor case. Source data are provided as a Source Data file.
Fig. 5
Fig. 5. Immunosuppressive myeloid cells are enriched in prostate tumors.
a, b Joint embedding showing the detailed annotation of the myeloid subpopulations (a) and the expression of select gene markers for each subpopulation (b). c Gene expression pattern: boxplots representing the average gene expression pattern of monocyte, macrophage, inflammatory, antigen processing and presentation, MDSC gene signatures, and M2-macrophages gene signature across the different myeloid subpopulations (top). Heatmap showing the average gene expression of representative genes across the different myeloid subpopulations in healthy, adj-normal, and tumor prostate samples (bottom). See Supplementary Data 4 for the genes defining the above-mentioned signatures. d Boxplot comparing the average expression of MDSC gene signature in tumor-inflammatory monocytes (TIMo) across the three different samples (healthy n = 5, adj-normal n = 14, and tumor n = 18). e Boxplot representing the cell fraction of different myeloid subpopulations across the healthy (n = 5), tumor (n = 18), and their adj-normal (n = 14) prostate tissues. Boxplots in ce include centerline, median; box limits, upper and lower quartiles; and whiskers are highest and lowest values no >1.5× interquartile range. Statistical significance was accessed using two-sided Wilcoxon rank-sum test (*p < 0.05; **p < 0.01; ***p < 0.001; ****p < 0.0001), p values could be found in Supplementary Data 6. f Top: multiplex fluorescence immunohistochemistry (mFIHC) staining of prostate tumor tissue (bottom) and its adj-normal tissue (top) collected from a prostatectomy case of Gleason score 5 + 5. Samples are labeled with PD-1 (Clone EH33) (color Red), FOXP3 (color Orange), CD8 (color Yellow), CD68 (color Magenta), CD3 (color Cyan), CD163 (color Green), and DAPI (Blue) by using mFIHC. Bottom: quantification of absolute number of macrophages (left) and M2-macrophages (right) from mIHC data comparing tumor tissues to their matched adj-normal tissues collected from prostatectomy cases of different Gleason scores. Red circles represent the tumor samples and black circles represent their matched adj-normal samples. Source data are provided as a Source Data file.
Fig. 6
Fig. 6. Prostate cancer is characterized by T-cell exhaustion and immunosuppressive Treg activity.
a Joint embedding showing the detailed annotation of lymphoid subpopulations. b Dotplot representing key-marker gene expression in lymphoid subpopulations. The color represents the scaled average expression of marker genes in each subpopulation, and the size indicates the proportion of cells expressing marker genes. c Boxplots represent the average expression of exhaustion score in CD8+ CTLs subpopulations (CTL-1 n = 37, CTL-2 n = 36 and CD8+ effector cells n = 35). Statistics are accessed with two-sided Wilcoxon rank-sum test (CTL-1 vs. CTL-2 ****p = 3.32E-06; CTL-2 vs. CD8 + effector ****p = 1.61E-06). d Boxplots comparing the average expression of exhaustion score in CTL-1 (left) and CD8 + effector (right) subpopulations across healthy (n = 5), adj-normal (n = 14) and tumor (n = 18) samples. Statistics are accessed with two-sided Wilcoxon rank-sum test (*p < 0.05, **p < 0.01, ***p < 0.001), p values could be found in Supplementary Data 6. e Boxplots represent the average expression of cytotoxicity score in CD8 + CTLs (CD8 + effector cells, CTL-1 and CTL-2) in cold tumors including prostate cancer (PCA n = 18) and pancreatic ductal adenocarcinoma (PDAC n = 19), and in hot tumors including Head and Neck squamous cell carcinoma (HNSCC n = 26), liver hepatocelluar carcinoma (LIHC n = 8) and lung cancer (lung n = 10). Statistical significance was accessed using two-sided Wilcoxon rank-sum test (*p < 0.05; **p < 0.01; ***p < 0.001; ****p < 0.0001), p values could be found in Supplementary Data 6. f Boxplot represents the average expression of Treg activity gene signature in Treg subpopulation across the three different samples. Significance was assessed using two-sided Wilcoxon rank-sum test (Tumor vs. adj-normal *p = 0.013; Tumor vs. Healthy *p = 0.015). Boxplots in cf include centerline, median; box limits, upper and lower quartiles; and whiskers are highest and lowest values no >1.5× interquartile range. Source data are provided as a Source Data file.
Fig. 7
Fig. 7. Coordination between myeloid and lymphoid compartments.
a Scatter plot showing the correlation between Treg activity score in Tregs and MDSC score in TIMo subpopulation in tumor (top) and adj-normal prostate tissues (bottom). Each dot represents a sample. Pearson linear correlation estimate, and p values are shown. The error band indicates 95% confidence interval. b A computational approach highlighting CCL20-CCR6 interaction between myeloid and T-cell subsets. Significance of ligand-receptor pair is determined by permutation test. c, d Average expression of CCL20 (c) and CCR6 (d) is shown for different cell populations from tumor (n = 18). Statistical significance was assessed using two-sided Wilcoxon test. Boxplots in c, d include centerline, median; box limits, upper and lower quartiles; and whiskers are highest and lowest values no greater than 1.5x interquartile range. Statistical significance was accessed using Wilcoxon rank-sum test (*p < 0.05; **p < 0.01; ***p < 0.001; ****p < 0.0001), p values could be found in Supplementary Data 6. e Tumor volume of RM1 prostate tumor. Mice (5 mice/group) were injected subcutaneously with 0.25×10⁶ RM1 cells. anti-CCL20 (200ug/kg) and/or anti-PD-1 (6 mg/kg) were injected intraperitoneally to mice every 3 days for a total of 4 times. Tumor growth was monitored by caliper measurement of the tumor volume every 3 days. Statistical significance was accessed using Wilcoxon rank-sum test (IGg1 + IGg2a vs. anti-CCL20 + anti-PD-1 p = 0.016; IGg1 + IGg2a vs. anti-CCL20 + IGg2a p = 0.029). Source data are provided as a Source Data file.

Comment in

References

    1. Held-Warmkessel J. Treatment of advanced prostate cancer. Semin. Oncol. Nurs. 2001;17:118–128. - PubMed
    1. Azizi E, et al. Single-cell map of diverse immune phenotypes in the breast tumor microenvironment. Cell. 2018;174:1293–1308.e36. - PMC - PubMed
    1. Lambrechts D, et al. Phenotype molding of stromal cells in the lung tumor microenvironment. Nat. Med. 2018;24:1277–1289. - PubMed
    1. Henry GH, et al. A cellular anatomy of the normal adult human prostate and prostatic urethra. Cell Rep. 2018;25:3530–3542.e5. - PMC - PubMed
    1. Miyamoto DT, et al. RNA-Seq of single prostate CTCs implicates noncanonical Wnt signaling in antiandrogen resistance. Science. 2015;349:1351–1356. - PMC - PubMed

Publication types