. 2023 Feb 7;14(1):675.
doi: 10.1038/s41467-023-36388-1.

JNK signaling in pioneer neurons organizes ventral nerve cord architecture in Drosophila embryos

Affiliations

JNK signaling in pioneer neurons organizes ventral nerve cord architecture in Drosophila embryos

Katerina Karkali et al. Nat Commun. .

Abstract

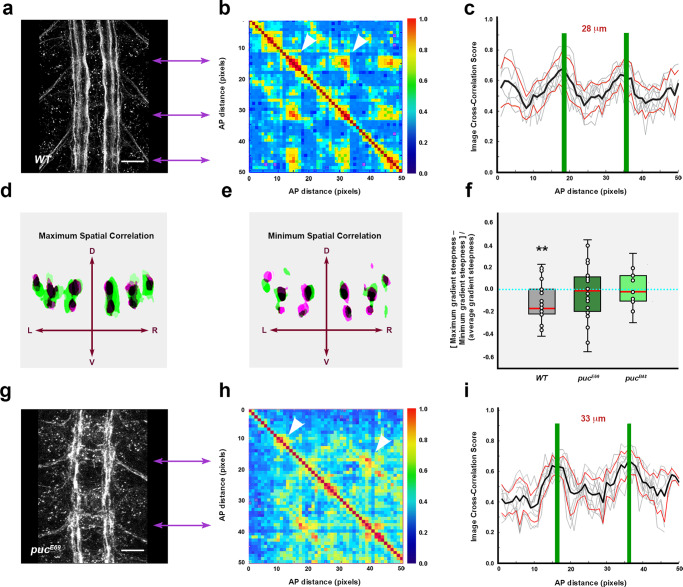
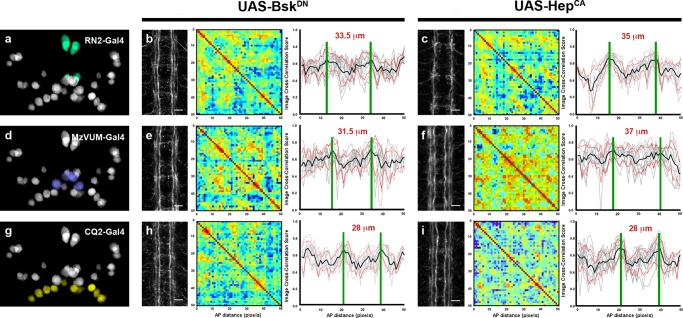
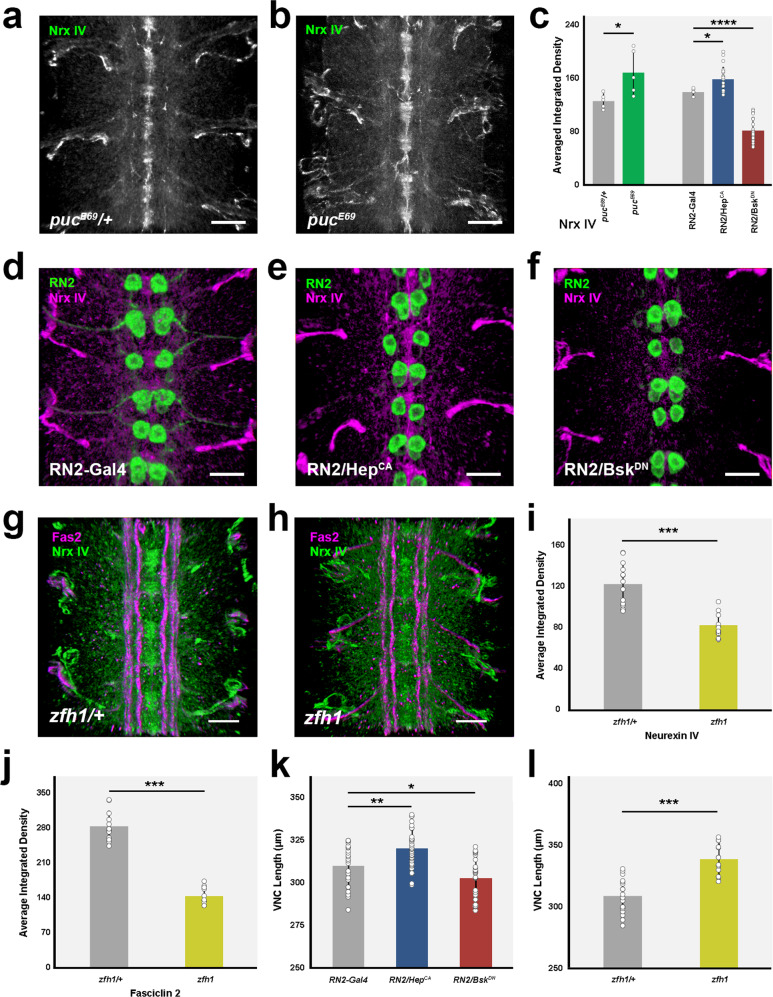
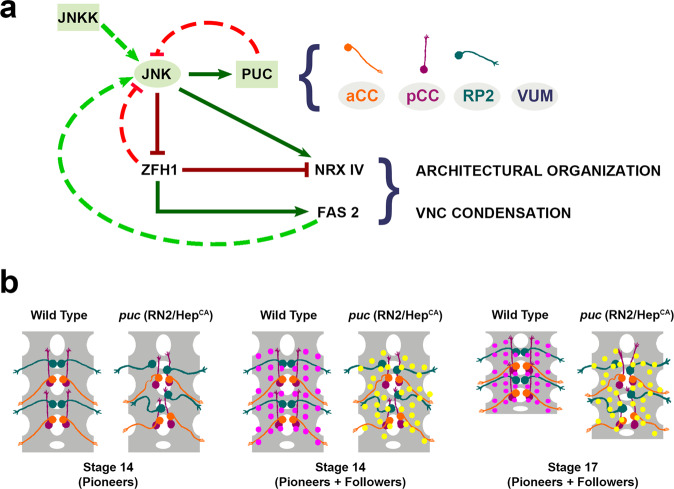
Morphogenesis of the Central Nervous System (CNS) is a complex process that obeys precise architectural rules. Yet, the mechanisms dictating these rules remain unknown. Analyzing morphogenesis of the Drosophila embryo Ventral Nerve Cord (VNC), we observe that a tight control of JNK signaling is essential for attaining the final VNC architecture. JNK signaling in a specific subset of pioneer neurons autonomously regulates the expression of Fasciclin 2 (Fas 2) and Neurexin IV (Nrx IV) adhesion molecules, probably via the transcription factor zfh1. Interfering at any step in this cascade affects fasciculation along pioneer axons, leading to secondary cumulative scaffolding defects during the structural organization of the axonal network. The global disorder of architectural landmarks ultimately influences nervous system condensation. In summary, our data point to JNK signaling in a subset of pioneer neurons as a key element underpinning VNC architecture, revealing critical milestones on the mechanism of control of its structural organization.


Conflict of interest statement

The authors declare no competing interests.

Figures

Fig. 1
Fig. 1. Structural Architecture of the Ventral Nerve Cord (VNC) of the Drosophila embryo.
a Maximum projection of the VNC of a stage 16 wild type embryo stained with Fas 2. Anterior is up. See Supplementary Movie 1. Scale Bar is 10 μm. b Self-cross-correlation matrix of the Z sections of the image in (a) along the AP axis (in pixels). The cross-correlation matrices correspond to hemisegments. The panel is scaled to fit with (a). The pixel size after the scaling is 1.65 µm. The color-coded representation (0−1), in all figures from now on, shows the correlation level along the AP axis. One conspicuous node per segment was detected (white arrowheads). Double headed purple arrows point to 3D nodes in (a). c Image cross-correlation score along the AP axis for (b) (n = 6). Fas 2 3D nodes fall 28 μm apart and the internodal minimum correlation maps 9 μm posterior to the node. The grey lines show individual profiles. Black line: average values; red lines ± SD; green bars indicate maximum correlation (3D nodes). d Z sections at two different maximal (green and magenta) correlation positions (from (a)). DV and ML [Left (L) and Right (R)] axes are indicated by arrows. e Z sections at two different minimal (green and magenta) correlation positions (from (a)). DV and ML axes are indicated by arrows. f Gradient of spatial correlation along the AP axis. Data was derived from n = 3 embryos, in each condition, with at least 3 positions compared. Red bar denotes the median. Top and bottom of the boxes indicate the 25th and 75th percentiles. Whiskers extend to the maximum and minimum values. Mann–Whitney tests were employed. Statistically significant differences from 0 were detected for the wild type (**p = 0.008). g Equivalent image to (a) for a pucE69 embryo. Note the defasciculation and collapse of the longitudinal connectives. See Supplementary Movie 2. Scale Bar is 10 μm. h Self-cross-correlation matrix of the Z sections of (g). In pucE69, matrices are noisier although a single node per segment persists (white arrowheads). i Image cross-correlation score along the AP axis for (h) (n = 9). Fas 2 3D nodes spread 33 µm away and the internodal minima fades out. Lines and bars are coded as in (c). Source data are provided as a Source Data file.
Fig. 2
Fig. 2. JNK signaling is dynamically regulated during development.
ad Dorsal and ventral sections highlighting the expression of puc (green) in the VNC of stage 17 pucE69I-Gal4> UAS-GFP embryo, double-stained for the pan-neuronal marker Elav ((a) and (b) - magenta) or the glial marker Repo ((c) and (d)- magenta). puc is expressed in a subset of neurons in each segment but not in glia. Scale bar 10 μm. ee”‘) four different snapshots from Supplementary Movie 3 at the indicated time points from the UAS-GFP; pucE69I-Gal4 viable line. puc expression can be observed from stage 14 in a few neurons at the midline. As development progresses, further neurons express puc. Scale bar 50 μm. ff”‘ Diagrams of cumulative puc expression at the same time points as in ee”‘. A minimum consensus of 18 neurons per hemisegment was defined. At each time point the intensity (defined by visual inspection) was displayed as low (red), medium (blue) and high (green) (see also Supplementary Movie 4). g Composition summarizing the expression of puc in the CNS [puc expressing cells in the VNC, at stage 16, including those identified by coexpressing Eve (magenta) or En (cyan) plus those putatively identified by morphological and positional criteria (yellow - AD, ADV, dMP2 and 2 VUM En-negative motor neurons)]. To facilitate understanding, a scaled Fas 2 expression image from an embryo of the same stage was over-imposed to the diagram. Positions of the 3D nodes are highlighted by dark blue lines. h Maximum projection of the VNC of a stage 13 pucE69I-Gal4> UAS-GFP embryo double-stained with Fas 2 (Magenta). The Fas 2 positive pioneers expressing puc are indicated. Note that GFP expression penetrance at this stage is partial. Anterior is up. Scale bar 20 μm.
Fig. 3
Fig. 3. Targeted activation and inhibition of the JNK pathway in the VNC.
a Cartoon representing the full set of puc expressing neurons per segment in the VNC, highlighting cells expressing RN2-Gal4 (turquoise). From left to right, pattern of Fas 2 expression, self-cross-correlation matrix and image cross-correlation profiles (scales and colormap as in Fig. 1) for VNCs of 16-stage embryos upon expression of UAS-BskDN b and UAS-HepCA c transgenes, under the control of the RN2-Gal4 respectively, inhibiting and hyperactivating JNK activity in the aCC, pCC and RP2 cells. In this condition connectives defasciculation and 3D nodes cross-correlation profiles are affected. Grey lines show individual profiles. Black line corresponds to average, with red lines ± SD. Green bars indicate positions of maximum correlation (3D nodes) along the AP axis. Distances between nodes are indicated. Scale bar 10 μm. d Cartoon highlighting the puc + neurons expressing MzVum-Gal4 (purple). e, f As (b) and (c) but employing MzVum-Gal4 for interfering in JNK activity in the VUM neurons. Affecting JNK activity levels in VUMs also affects defasciculation, 3D nodes profiles and condensation. Scale bar 10 μm. g Cartoon highlighting the puc + cells expressing CQ2-Gal4 (yellow). h and i) As (b) and (c) but employing CQ2-Gal4 for interfering in JNK activity in the U motoneurons. This condition does not have a phenotype distinct from wild type. Scale bar 10 μm. Control data are presented in Fig. 1. Micrographs and self-cross-correlation matrices correspond to representative embryos for each condition. Image cross-correlation profiles present the cumulative data (mean ± SD) of all embryos analyzed ((b), n = 10; (c), n = 10; (e), n = 9; (f), n = 10; (h), n = 10; (i), n = 10).
Fig. 4
Fig. 4. Fas 2 is necessary for VNC condensation and its expression is modulated by the JNK pathway.
a wild type, b pucE69 and c pucB48, stage 16 embryos, Fas 2 immunoreactivity. Maximum projection of ventral views across three abdominal segments. Overlaid squares represent the ROIs used for measuring the Average Integrated Density at nodes (magenta) and internodes (yellow). Anterior is up. Scale bar 10 μm. d Quantification of the Average Integrated Density of Fas 2 signal at nodes (magenta perimeter) and internodes (yellow perimeter). Wild type (grey) (Nodes, n = 43; Internodes, n = 49); pucE69 (dark green) (Nodes, n = 16; Internodes, n = 16); pucB48 (light green) (Nodes, n = 26; Internodes, n = 32). Data presented as mean ± SD. Parametric Student t-tests were employed. Significant differences (****p < 0.0001) were detected in all cases. e Immunodetection of Fas 2 in extracts from stage 16 embryos. The Fas 2 antibody detected a band at 140 kD (magenta arrow), the intensity of which was reduced in puc embryos. Actin (>42 kD) served as loading control. Averaged Fas 2 band intensities were normalized to actin levels and to interblot signal variations. The wild type (pucE69 / + or pucB48 / +) signal level was employed as a reference. pucE69 / + (n = 3); pucE69 (n = 3); pucB48 / + (n = 3); pucB48 (n = 3). Data presented as mean ± SD. Parametric Student t-tests were employed. Significant differences in Fas 2 levels (**p = 0.0011 for pucE69 and **p = 0015 for pucB48) were detected. f Fas 2-GFP pattern of a stage 16 Fas 2 mutant embryo (Fas 2CB03613 / Fas 2EB112). Maximum projection of ventral views across three abdominal segments. Axonal network is disrupted [compare to the Fas 2-GFP expression in heterozygous (Fas 2CB03613 / + ) (inset)]. Scale bar 10 μm. g Self-cross-correlation matrix along the AP axis of the Z sections of the image in (f). Scales and colormap as in Fig. 1. One disperse node per segment was detected. h Quantification of the VNC length in μm. Data presented as mean ± SD. Parametric Student t-tests were employed. Significant differences in length (*p = 0.0172 and **p = 0.0011) were detected between wild type (n = 4) and Fas 2 allelic combinations (Fas 2CB03613 / Fas 2EB112 (dark red) (n = 5); Fas 2E76 / Fas 2EB112 (light red) (n = 8)). Source data provided as a Source Data file.
Fig. 5
Fig. 5. Nrx IV expression is modulated by JNK signaling and Zfh1 activity.
a pucE69 / + and b pucE69, stage 16 embryos, Nrx IV immunoreactivity. Nrx IV increases in puc mutants. Anterior is up. Scale bar 10 μm. c Nrx IV Average Integrated Density per segment for (a) (grey) (pucE69 / +, n = 5); (b) (green) (pucE69, n = 5); (d) (grey) RN2-Gal4 / +, n = 5; (e) (blue) RN2-Gal4 > UAS-HepCA, n = 21; and (f) (red) RN2-Gal4 > UAS-BskDN, n = 22. Data presented as mean ± SD. Parametric Student t-tests were employed. Significant differences in Nrx IV levels were detected. *p = 0.0277, pucE69/ + vs pucE69; *p = 0.022, RN2-Gal4 / + vs RN2-Gal4 > UAS-HepCA; and ****p < 0.0001, RN2-Gal4 / + vs RN2-Gal4 > UAS-BskDN. d RN2-Gal4 / +, RN2-Gal4 > UAS-HepCA and f RN2-Gal4 > UAS-BskDN stage 16 embryos. Sum projections of ventral views across three abdominal segments (RN2 - green). Autonomous hyperactivation of the pathway led to an increase of Nrx IV levels (magenta), while its inhibition reduced its expression. Anterior is up. Scale bar 10 μm. g zfh1 / + and h zfh1 stage 16 embryos Fas 2 (magenta) and Nrx IV (green) immunoreactivity. Scale bar 10 μm. i, j Average Integrated Densities per segment of Nrx IV and Fas 2 for (g) (zfh1 / + (grey) (Fas 2, n = 12; Nrx IV, n = 13) and (h) (zfh1 (dark yellow) (Fas 2, n = 10; Nrx IV, n = 10). Data presented as mean ± SD. Parametric Student t-tests were employed. Significant differences (***p < 0.001) for Fas 2 and Nrx IV levels were observed. k VNC length in μm for RN2-Gal4 / + (grey) (n = 24), RN2-Gal4 > UAS-HepCA (blue) (n = 34) and RN2-Gal4 > UAS-BskDN (red) (n = 27) stage 16 embryos. Data presented as mean ± SD. Parametric Student t-tests were employed. Significant differences in length were detected upon hyperactivation (**p = 0.0018) or inactivation (*p = 0.0364) of the pathway. l VNC length in μm for zfh1 / + (grey) (n = 18) and zfh1 (dark yellow) (n = 13) stage 16 embryos. Data presented as mean ± SD. Parametric Student t-tests were employed. Significant differences in length were detected (***p < 0.001). Source data provided as a Source Data file.
Fig. 6
Fig. 6. JNK signaling modulates the expression of Zfh1, which feedbacks on JNK activity and affects Fas 2 and Nrx IV expression.
a Maximum projection of the VNC of a stage 16 zfh1 embryo stained with Fas 2. Anterior is up. Scale bar 10 μm. b Self-cross-correlation matrix of the Z sections of (a) along the AP axis. Scales and colormap as in Fig. 1. Nodes are sustained but structural noise increases dramatically. c Image cross-correlation score along the AP axis for (b) (n = 8 embryos). 3D nodes fall 33 μm apart and the internodal correlation flattens. The grey lines show individual profiles, black averaged values and red ± SD. Green bars indicate maximum correlations (3D nodes). d zfh1 / + and e) zfh1 stage 16 embryos Fas 2 immunoreactivity. Maximum projection of ventral views across three abdominal segments. Overlaid squares [nodes (magenta) and internodes (yellow)] are the ROIs employed on Average Integrated Density measurements. Scale bar 10 μm. f Average Integrated Density at nodes and internodes (magenta and yellow perimeters) for (d) (grey) (Nodes, n = 41; Internodes, n = 44) and (e) (dark yellow) (Nodes, n = 43; Internodes, n = 42)). Data presented as mean ± SD. Parametric Student t-tests were employed. Significant differences in Fas 2 (*p = 0.0174 and ****p < 0.0001) were observed at nodes and internodes between zfh1 / + and zfh1. g Overlay of aligned 3D reconstructions of the VNC of pucE69 / + (magenta) and pucE69 (green) stage 16 embryos immunostained for Zfh1. Arrowheads point to segmental midpoints. Scale bar 10 μm. h Z cross-sections from (g) at segmental midpoints. The VNC of pucE69 shows dramatic flattening. Several neurons lose Zfh1 (yellow arrow). Scale bar 10 μm. i Zfh1 Average Integrated Density per segment on pucE69 / + (grey) (n = 5) and pucE69 (dark green) (n = 4) embryos. Data presented as mean ± SD. Parametric Student t-tests were employed. A significant decrease (*p = 0.0175) was detected for pucE69. j zfh1 / + and k) zfh1 stage 16 embryos Fas 2 (magenta) and P-JNK (green) immunoreactivity. Anterior is up. Scale bar 10 μm. l Average Integrated Density per segment for (j) (Fas 2 (n = 13); P-JNK (n = 14)) and (k) (Fas 2 (n = 7); P-JNK (n = 9)). Data presented as mean ± SD. Parametric Student t-tests were employed. P-JNK levels increase (*p = 0.0356) and Fas 2 decrease (*p = 0.0214) from zfh1 / + (grey) to zfh1 (dark yellow). Source data provided as a Source Data file.
Fig. 7
Fig. 7. JNK signaling activity in pioneer neurons modulates the architectural organization of the CNS.
a Regulatory network modulating VNC architectural organization and condensation. Precise JNK activity levels in early-specified neurons (aCC, pCC, RP2 and VUMs) are regulated by a primary negative feedback loop mediated by Puc. Excessive JNK activity in puc mutants or upon early overexpression of HepCA (constitutively active JNKK) in aCC, pCC, RP2 and/or VUMs neurons leads to a general downregulation of Fas 2 (mainly autonomous) and an increase in Nrx IV expression. This affects the general architectural robustness of the VNC, preventing its condensation. Zfh1 acts as an intermediate factor in pioneers regulating Fas 2 and Nrx IV expression in response to JNK activity. On the other hand, Zfh1, negatively, and Fas 2, positively, affect JNK activity, establishing secondary control loops. Regulatory links at the level of expression control are indicated by continuous lines (Dark Green - positive; Dark Red- negative). Links at the level of activity control are represented by discontinuous lines (Light Green - positive; Light Red - negative). Schematic diagrams of the aCC, pCC, RP2 and VUM neurons are color coded as in (b). b The modification of the canonical topography and axonal paths of pioneer neurons by alterations in JNK activity levels disturbs their instructive structural roles. The RN2 positive longitudinal connectives and motoneuron ISN pioneers (aCC, pCC and RP2 - color coded as in (a) locate in precise positions of the neuropile and project axons with stereotyped trajectories. In puc mutants or after overexpressing HepCA, their positions are altered (mostly the RP2) and the paths of their axons distorted (Stage 14 Pioneers). This results in the repositioning of followers (magenta in the wild type and yellow in mutant conditions), adapting to the aberrant axonal landscape (Stage 14 Pioneers and Followers). One secondary effect of the disorganization of the architecture of the VNC, along other defects in neuron/glia interactions, is its failure to condense (Stage 17).

References

    1. Arendt D, Tosches MA, Marlow H. From nerve net to nerve ring, nerve cord and brain–evolution of the nervous system. Nat. Rev. Neurosci. 2016;17:61–72. - PubMed
    1. Qing Yu ZL, Chuanzi OuYang, Lingjun Li. Biologically Active Peptides in Invertebrates: Discovery and Functional Studies. In: Colloquium Series on neuropeptides). Morgan & Claypool Publishers (2015).
    1. Leise EM. Modular construction of nervous systems: a basic principle of design for invertebrates and vertebrates. Brain Res. Rev. 1990;15:1–23. - PubMed
    1. Chen BL, Hall DH, Chklovskii DB. Wiring optimization can relate neuronal structure and function. Proc. Natl Acad. Sci. 2006;103:4723–4728. - PMC - PubMed
    1. Redies C, Puelles L. Modularity in vertebrate brain development and evolution. BioEssays. 2001;23:1100–1111. - PubMed

Publication types

MeSH terms

LinkOut - more resources