. 2023 Feb 7;13(1):1770.
doi: 10.1038/s41598-023-28489-0.

Upwelling, climate change, and the shifting geography of coral reef development

Affiliations

Upwelling, climate change, and the shifting geography of coral reef development

Victor Rodriguez-Ruano et al. Sci Rep. .

Abstract

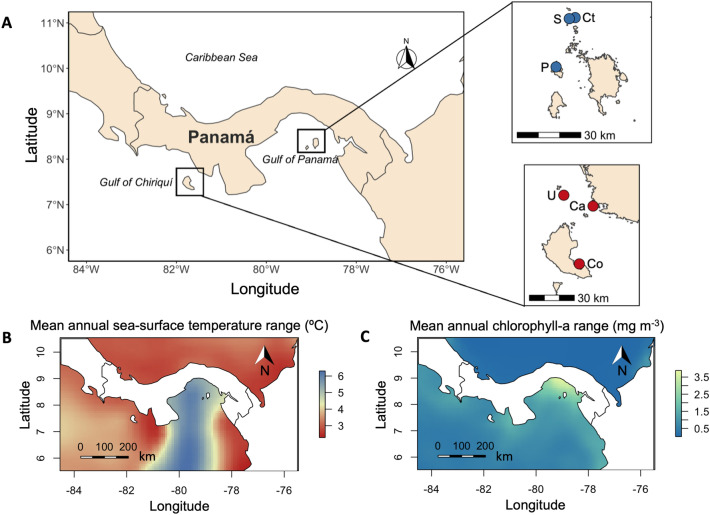
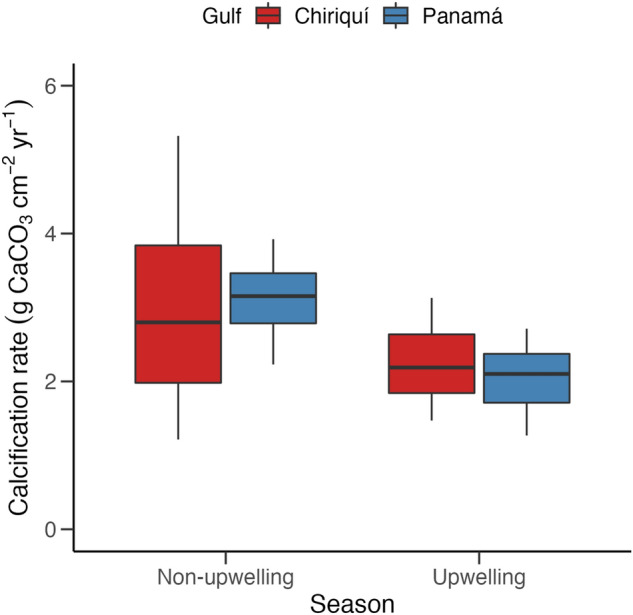
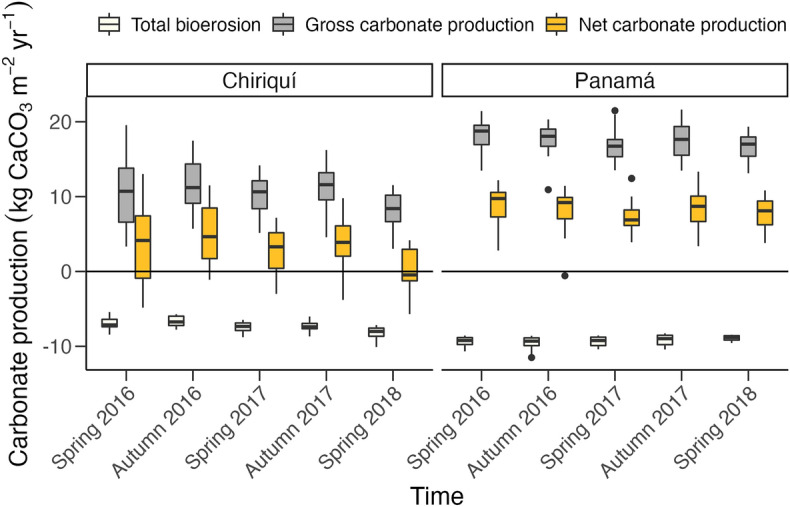
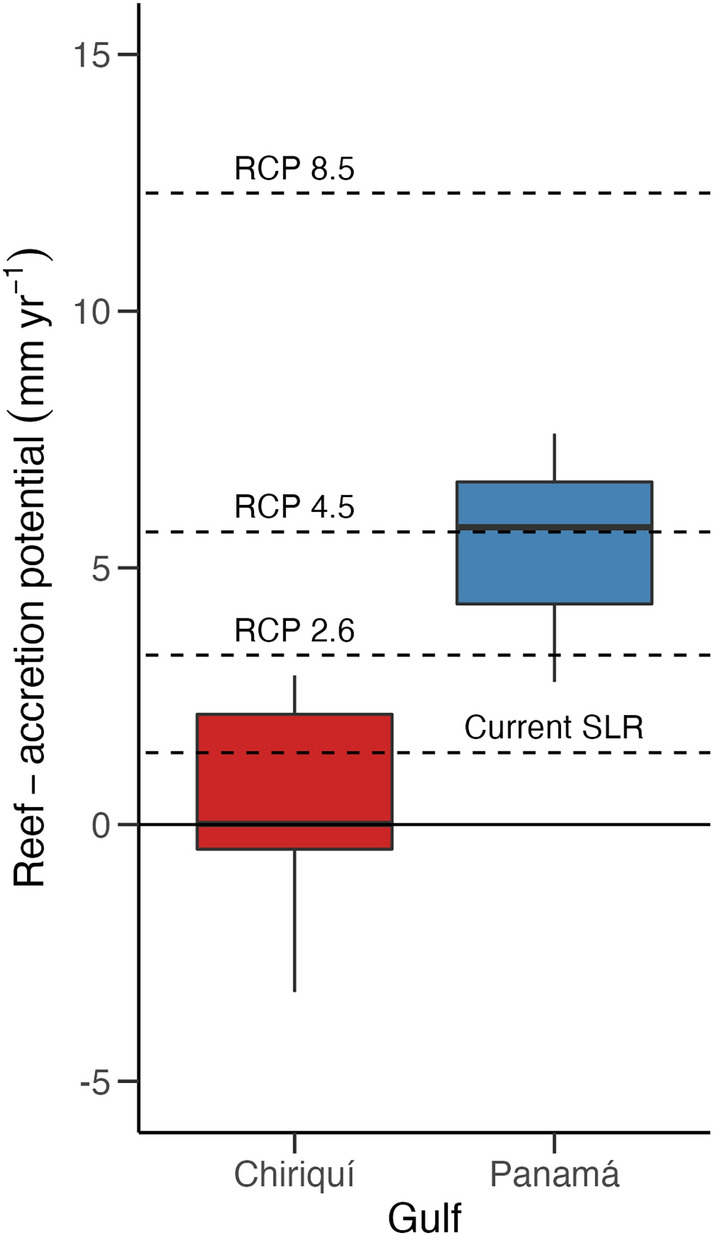
The eastern tropical Pacific is oceanographically unfavorable for coral-reef development. Nevertheless, reefs have persisted there for the last 7000 years. Rates of vertical accretion during the Holocene have been similar in the strong-upwelling Gulf of Panamá (GoP) and the adjacent, weak-upwelling Gulf of Chiriquí (GoC); however, seasonal upwelling in the GoP exacerbated a climate-driven hiatus in reef development in the late Holocene. The situation is now reversed and seasonal upwelling in the GoP currently buffers thermal stress, creating a refuge for coral growth. We developed carbonate budget models to project the capacity of reefs in both gulfs to keep up with future sea-level rise. On average, the GoP had significantly higher net carbonate production rates than the GoC. With an estimated contemporary reef-accretion potential (RAP) of 5.5 mm year-1, reefs in the GoP are projected to be able to keep up with sea-level rise if CO2 emissions are reduced, but not under current emissions trajectories. With an estimated RAP of just 0.3 mm year-1, reefs in the GoC are likely already unable to keep up with contemporary sea-level rise in Panamá (1.4 mm year-1). Whereas the GoP has the potential to support functional reefs in the near-term, our study indicates that their long-term persistence will depend on reduction of greenhouse gases.


Conflict of interest statement

The authors declare no competing interests.

Figures

Figure 1
Figure 1
(A) Map of Pacific Panamá; (B) the average annual range in sea-surface temperature values (average for 2000–2014, in °C); (C) the average annual range in chlorophyll-a values (average for 2000–2014, in mg m−3). In (A), the study sites within each gulf are shown as insets. Red circles represent the sites in the Gulf of Chiriquí and blue circles represent the sites in the Gulf of Panamá. In the Gulf of Chiriquí: Co = Coiba, Ca = Canales de Tierra, U = Uva. In the Gulf of Panamá: P = Pedro González, S = Saboga, Ct = Contadora. Data for panels (B) and (C) were retrieved from the Bio-ORACLE Marine Database,. These maps were generated in R version 4.2.2 (Ref.) using the “ggplot2” (https://ggplot2.tidyverse.org, https://github.com/tidyverse/ggplot2; Ref.) and “ggspatial” (https://paleolimbot.github.io/ggspatial/; Ref.) packages.
Figure 2
Figure 2
Boxplot of median (± interquartile range) Pocillopora calcification rate (g CaCO3 cm−2 year−1) for each gulf across the upwelling and non-upwelling seasons of Pacific Panamá from 2016 to 2018. The upwelling season runs from March through September, and the non-upwelling season runs from October through February.
Figure 3
Figure 3
Boxplot of median (± interquartile range) gross carbonate production (gray boxes), total bioerosion (white boxes), and net carbonate production (yellow boxes) for each gulf across the five surveys from 2016–2018. All of the rates are reported in kg CaCO3 m−2 year−1. The black horizontal line delimits the division between net production and net erosion. Black points represent statistical outliers.
Figure 4
Figure 4
Boxplot of median (± interquartile range) reef-accretion potential (mm year−1) for each gulf during the most recent survey (spring 2018). The horizontal lines represent the projected mean sea-level rise for each of three RCPs, as well as the current rate of sea-level rise for Panamá. The black horizontal line delimits the division between net accretion and net erosion.

References

    1. Kennedy EV, et al. Avoiding coral reef functional collapse requires local and global action. Curr. Biol. 2013;23:912–918. doi: 10.1016/j.cub.2013.04.020. - DOI - PubMed
    1. Beck MW, et al. The global flood protection savings provided by coral reefs. Nat. Commun. 2018;9:2186. doi: 10.1038/s41467-018-04568-z. - DOI - PMC - PubMed
    1. Kuffner IB, Toth LT. A geological perspective on the degradation and conservation of western Atlantic coral reefs. Conserv. Biol. 2016;30:706–715. doi: 10.1111/cobi.12725. - DOI - PubMed
    1. Allemand D, et al. Biomineralisation in reef-building corals: From molecular mechanisms to environmental control. C. R. Palevol. 2004;3:453–467. doi: 10.1016/j.crpv.2004.07.011. - DOI
    1. Glynn, P. W. Bioerosion and coral-reef growth: A dynamic balance. In Life and Death of Coral Reefs (ed Birkeland, C.) 68–95 (Chapman & Hall, 1997).

Publication types