. 2022 Dec 31;8(5):176-196.
doi: 10.32481/djph.2022.12.043. eCollection 2022 Dec.

Chronic Disease Management and the Healthcare Workforce

Affiliations

Chronic Disease Management and the Healthcare Workforce

Tim Gibbs et al. Dela J Public Health. .
No abstract available


Figures

Figure 1a
Figure 1a
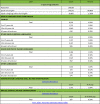
New Castle County Basic Demographics
Figure 1b
Figure 1b
New Castle County Basic Demographics, Cont.
Figure 2
Figure 2
New Castle County Language Stratified by Age Groupings
Figure 3a
Figure 3a
Kent County Basic Demographics
Figure 3b
Figure 3b
Kent County Basic Demographics, Cont.
Figure 4
Figure 4
Kent County Language Stratified by Age Groupings
Figure 5a
Figure 5a
Sussex County Basic Demographics
Figure 5b
Figure 5b
Sussex County Basic Demographics, Cont.
Figure 6
Figure 6
Sussex County Language Stratified by Age Groupings
Figure 7
Figure 7
2020 Proportion of the Total Insured Delawarean Population by Census Tract (per 100 persons) with Alzheimers Disease, Related Disorders, or Senile Dementia
Figure 8
Figure 8
2020 Proportion of the Total Insured Delawarean Population by Census Tract (per 100 persons) with Osteoporosis
Figure 9
Figure 9
2020 Proportion of the Total Insured Delawarean Population by Census Tract (per 100 persons) with Rheumatoid Arthritis or Ostoarthritis
Figure 10
Figure 10
2020 Proportion of the Total Insured Delawarean Population by Census Tract (per 100 persons) with Pelvic Hip Fracture
Figure 11
Figure 11
2020 Proportion of the Total Insured Delawarean Population by Census Tract (per 100 persons) with Breast Cancer
Figure 12
Figure 12
2020 Proportion of the Total Insured Delawarean Population by Census Tract (per 100 persons) with Colorectal Cancer
Figure 13
Figure 13
2020 Proportion of the Total Insured Delawarean Population by Census Tract (per 100 persons) with Prostate Cancer
Figure 14
Figure 14
2020 Proportion of the Total Insured Delawarean Population by Census Tract (per 100 persons) with Acute Myocardial Infarction
Figure 15
Figure 15
2020 Proportion of the Total Insured Delawarean Population by Census Tract (per 100 persons) with Atrial Fibrillation
Figure 16
Figure 16
2020 Proportion of the Total Insured Delawarean Population by Census Tract (per 100 persons) with Heart Failure
Figure 17
Figure 17
2020 Proportion of the Total Insured Delawarean Population by Census Tract (per 100 persons) with Ischemic Heart Disease
Figure 18
Figure 18
2020 Proportion of the Total Insured Delawarean Population by Census Tract (per 100 persons) with Depression
Figure 19
Figure 19
2020 Proportion of the Total Insured Delawarean Population by Census Tract (per 100 persons) with Diabetes
Figure 20
Figure 20
2020 Proportion of the Total Insured Delawarean Population by Census Tract (per 100 persons) with Acquired Hypothyroidism
Figure 21
Figure 21
2020 Proportion of the Total Insured Delawarean Population by Census Tract (per 100 persons) with Anemia
Figure 22
Figure 22
2020 Proportion of the Total Insured Delawarean Population by Census Tract (per 100 persons) with Hypertension
Figure 23
Figure 23
2020 Proportion of the Total Insured Delawarean Population by Census Tract (per 100 persons) with Hyperlipidemia
Figure 24
Figure 24
2020 Proportion of the Total Insured Delawarean Population by Census Tract (per 100 persons) with Stroke / Transient Ischemic Attack
Figure 25
Figure 25
2020 Proportion of the Total Insured Delawarean Population by Census Tract (per 100 persons) with Chronic Kidney Disease
Figure 26
Figure 26
2020 Proportion of the Total Insured Delawarean Population by Census Tract (per 100 persons) with Asthma
Figure 27
Figure 27
2020 Proportion of the Total Insured Delawarean Population by Census Tract (per 100 persons) with Chronic Obstructive Pulmonary Disease
Figure 28
Figure 28
2020 Proportion of the Total Insured Delawarean Population by Census Tract (per 100 persons) with Lung Cancer
Figure 29
Figure 29
2020 Proportion of the Total Insured Delawarean Population by Census Tract (per 100 persons) with Benign Prostatic Hyperplasia
Figure 30
Figure 30
2020 Proportion of the Total Insured Delawarean Population by Census Tract (per 100 persons) with Cataracts
Figure 31
Figure 31
2020 Proportion of the Total Insured Delawarean Population by Census Tract (per 100 persons) with Glaucoma

References

    1. Holman, H. R. (2020, March). The relation of the chronic disease epidemic to the healthcare crisis. ACR Open Rheumatology, 2(3), 167–173. Epub2020Feb19. 10.1002/acr2.11114 - DOI - PMC - PubMed
    1. National Council on Aging. (2020, Mar 9). Chronic vs. acute medical conditions: What’s the difference? Retrieved from: https://www.ncoa.org/article/chronic-versus-acute-disease
    1. Delaware Office of State Planning Coordination. (n.d.). Demographic Information. Retrieved from: http://www.stateplanning.delaware.gov/demography/documents/dpc/DPC-2021v...

LinkOut - more resources