. 2023 Feb;43(2):3331024221141683.
doi: 10.1177/03331024221141683.

OnabotulinumtoxinA effects on trigeminal nociceptors

Affiliations

OnabotulinumtoxinA effects on trigeminal nociceptors

Ashley A Moore et al. Cephalalgia. 2023 Feb.

Abstract

Background: OnabotulinumtoxinA (onabotA) is approved globally for prevention of chronic migraine; however, the classical mechanism of action of onabotA in motor and autonomic neurons cannot fully explain the effectiveness of onabotulinumtoxinA in this sensory neurological disease. We sought to explore the direct effects of onabotulinumtoxinA on mouse trigeminal ganglion sensory neurons using an inflammatory soup-based model of sensitization.

Methods: Primary cultured trigeminal ganglion neurons were pre-treated with inflammatory soup, then treated with onabotulinumtoxinA (2.75 pM). Treated neurons were used to examine transient receptor potential vanilloid subtype 1 and transient receptor potential ankyrin 1 cell-surface expression, calcium influx, and neuropeptide release.

Results: We found that onabotulinumtoxinA cleaved synaptosomal-associated protein-25 kDa in cultured trigeminal ganglion neurons; synaptosomal-associated protein-25 kDa cleavage was enhanced by inflammatory soup pre-treatment, suggesting greater uptake of toxin under sensitized conditions. OnabotulinumtoxinA also prevented inflammatory soup-mediated increases in TRPV1 and TRPA1 cell-surface expression, without significantly altering TRPV1 or TRPA1 protein expression in unsensitized conditions. We observed similar inhibitory effects of onabotulinumtoxinA on TRP-mediated calcium influx and TRPV1- and TRPA1-mediated release of calcitonin gene-related peptide and prostaglandin 2 under sensitized, but not unsensitized control, conditions.

Conclusions: Our data deepen the understanding of the sensory mechanism of action of onabotulinumtoxinA and support the notion that, once endocytosed, the cytosolic light chain of onabotulinumtoxinA cleaves synaptosomal-associated protein-25 kDa to prevent soluble N-ethylmaleimide-sensitive factor attachment protein receptor-mediated processes more generally in motor, autonomic, and sensory neurons.

Keywords: Inflammatory soup; botulinum neurotoxin type A; chronic migraine; transient receptor potential ankyrin 1 (TRPA1); transient receptor potential vanilloid subtype 1 (TRPV1); trigeminal ganglion.


Conflict of interest statement

Declaration of conflicting interests

AAM, CW, SC, GM, EX, and LO have no conflicts of interest to disclose.

Figures

Figure 1.
Figure 1.
OnabotA Leads to SNAP25 Cleavage in Mouse Cultured Primary Trigeminal Ganglion Neurons. TG neurons were pretreated with or without IS for 24 hours, then treated overnight with onabotA (2.75 pM). OnabotA was removed and neurons were grown for a further 48 hours. (a) Representative images of TG neurons showing immunocytochemical staining of cleaved SNAP25197 in red and the neuronal marker PGP9.5 in green 48 hours after initial onabotA treatment. Magnification 40X, scale bar 50 μm. (b) Digital magnification showing SNAP25197-IR+ neurons located primarily in the periphery of the cells. (c) Quantification of the percentage of SNAP25197-IR+ cells out of the total number of neurons 48 hours after initial toxin treatment; one-way ANOVA with Tukey’s test, F(3,55) 15.83, p < 0.0001. n = 6 independent experiments, consisting of pooled TG neurons from 4–10 animals per experiment. (d) Immunoblot and (e) densitometric analysis of bands showing that onabotA induces SNAP25197 cleavage 48 hours after initial toxin treatment; one-way ANOVA with Tukey’s test, F(3,8) = 4.093, p < 0.05. Data represent mean + SEM. *p < 0.05, **p < 0.01, ****p < 0.0001. Background was subtracted out before analysis.
Figure 2.
Figure 2.
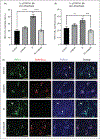
OnabotA Modulates Surface Expression of TRPV1 in Primary Trigeminal Ganglion Neurons Under Inflammatory Conditions. (a, b) Quantitation of the proportion of TRPV1-IR+ TG cells relative to the total number of cells per area. At 24 hours, one-way ANOVA with Tukey’s test, F(3,124) = 21.24, p < 0.0001. At 48 hours, one-way ANOVA with Tukey’s test, F(3,163) = 7.058, p < 0.001. n = 3 independent experiments at 24 hours, consisting of pooled TG neurons from 6–7 animals per experiment. n = 6 independent experiments at 48 hours; consisting of pooed TG neurons from 4–10 animals per experiment. Data represent mean + SEM. **p < 0.01, ***p < 0.001, ****p < 0.0001. (c) Representative images showing TG neurons labeled for surface-expressed TRPV1. TRPV1 (green), SNAP25197 (red), and PGP9.5 (blue). Arrowheads denote SNAP25197-IR+ cells; full arrows denote cells not expressing SNAP25197. Magnification, 60X. Scale bar, 50 μm.
Figure 3.
Figure 3.
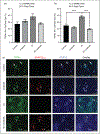
OnabotA Modulates Surface Expression of TRPA1 in Primary Trigeminal Ganglion Neurons Under Inflammatory Conditions. (a, b) Quantitation of the proportion of TRPA1-IR+TG cells relative to the total number of cells per area. At 24 hours, one-way ANOVA with Tukey’s test, F(3,90) = 2.789, p < 0.05. At 48 hours, one-way ANOVA with Tukey’s test, F (3.193) = 17.84, p < 0.0001. n = 3 independent experiments at 24 hours, consisting of pooled TG neurons from 6–7 animals per experiment. n = 6 independent experiments at 48 hours; consisting of pooled TG neurons from 4–10 animals per experiment. Data represent mean SEM. **p < 0.01, ***p < 0.001, ****p < 0.0001. (c) Representative images showing TG neurons labeled for surface-expressed TRPA1. TRPA1 (green), SNAP25197 (red), and PGP9.5 (blue). Arrowheads denote SNAP25197-IR+ cells; full arrows denote cells not expressing SNAP25197. Magnification, 60X. Scale bar, 50 μm.
Figure 4.
Figure 4.
OnabotA Modulates TRPV1- and TRPA1-Mediated Ca2+ Influx in Primary Cultured Trigeminal Ganglion Neurons. (a) Ca2+ influx via TRPV1 channels stimulated by capsaicin (100 nM) in TG sensory neurons that were cultured from Pirt-GCaMP3 mice and treated with onabotA, IS, or IS+onabotA. Control = blue, onabotA = orange, IS = red, IS+onabotA = green. n = 3 independent experiments, 37–39 neurons per experiment from n = 8 animals. Quantification of the (B) mean area under the curve (AUC) and (c) mean maximum fluorescent intensities for capsaicin stimulation. One-way ANOVA with Tukey’s test for AUC: F(3,148) = 3.799, p < 0.05. One-way ANOVA with Tukey’s test for mean maximum fluorescence intensity: F(3,148) = 3.626, p < 0.05 Data are presented as mean ± SEM. *p < 0.05. (d) Ca2+ influx via TRPA1 channels stimulated by AITC (100 μM) in TG sensory neurons that were cultured from Pirt-GCaMP3 mice and treated with onabotA, IS, or IS+onabotA. Control = blue, onabotA = orange, IS = red, IS+onabotA = green. n = 3 independent experiments, 27–29 neurons per experiment from n = 8 animals. Quantification of the (e) mean AUC and (f) mean maximum fluorescent intensities for AITC stimulation. One-way ANOVA with Tukey’s test for AUC: F(3,119) = 4.564, p < 0.01. One-way ANOVA with Tukey’s test for mean maximum fluorescence intensity: F(3,112) = 4.014, p < 0.01. Data are presented as mean ± SEM. P-values <0.05 were considered significant. **p < 0.01.
Figure 5.
Figure 5.
OnabotA Modulates TRPV1- and TRPA1-Mediated Neuropeptide Release in Cultured Primary Trigeminal Ganglion Neurons Under Inflammatory Conditions. TG neurons were treated with onabotA, IS, or IS+onabotA. Forty-eight hours later, neurons were stimulated with the TRPV1 agonist capsaicin (1 μM; 30 minutes) or the TRPA1 agonist JT010 (10 μM; 30 minutes) and neuropeptide release was analyzed via ELISA. (a, b). Quantification of CGRP release stimulated by capsaicin (left; one-way ANOVA with Tukey’s test, F(3,31) = 3.808, p < 0.05) or JT010 (right; one-way ANOVA with Tukey’s test, F(3,12) = 8.846, p < 0.01) and (c, d) Quantification of PGE2 release stimulated by capsaicin (left; one-way ANOVA with Tukey’s test, F(2,9) = 9.431, p < 0.01) or JT010 (right; one-way ANOVA with Tukey’s test, F(2,20) = 7.075, p < 0.01). n = 4 independent experiments, consisting of pooled TG neurons from 9–15 animals per experiment. Data represent mean+SEM. *p < 0.05, **p < 0.01.

References

    1. Dong M and Stenmark P. The structure and classification of botulinum toxins. Handb Exp Pharmacol 2021; 263: 11–33. - PubMed
    1. Pirazzini M, Rossetto O, Eleopra R, et al. Botulinum neurotoxins: biology, pharmacology, and toxicology. Pharmacol Rev 2017; 69: 200–235. - PMC - PubMed
    1. James NG, Malik S, Sanstrum BJ, et al. Characterization of clostridium botulinum neurotoxin serotype A (BoNT/A) and fibroblast growth factor receptor interactions using novel receptor dimerization assay. Sci Rep 2021; 11: 7832. - PMC - PubMed
    1. Brin MF. Basic and clinical aspects of BOTOX. Toxicon 2009; 54: 676–682. - PubMed
    1. Burstein R, Blumenfeld AM, Silberstein SD, et al. Mechanism of action of onabotulinumtoxinA in chronic migraine: a narrative review. Headache 2020; 60: 1259–1272. - PMC - PubMed

MeSH terms