. 2023 Feb 8;8(3):e163762.
doi: 10.1172/jci.insight.163762.

Inhibition of antiapoptotic BCL-2 proteins with ABT-263 induces fibroblast apoptosis, reversing persistent pulmonary fibrosis

Affiliations

Inhibition of antiapoptotic BCL-2 proteins with ABT-263 induces fibroblast apoptosis, reversing persistent pulmonary fibrosis

Joseph C Cooley et al. JCI Insight. .

Abstract

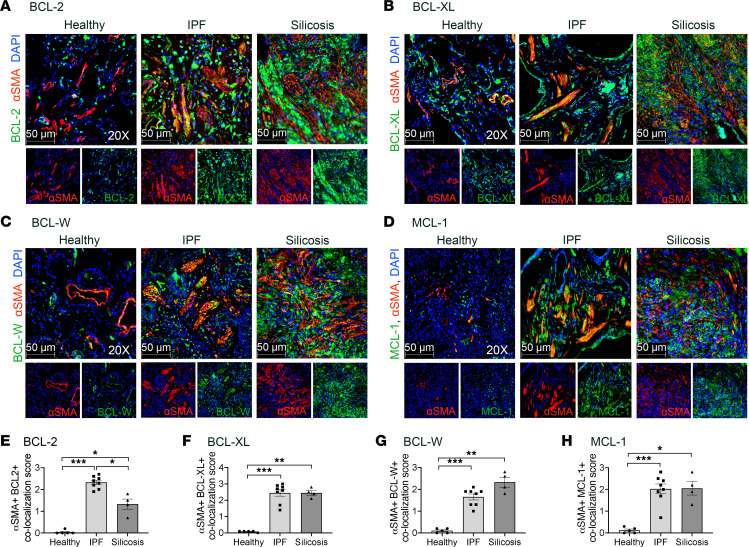
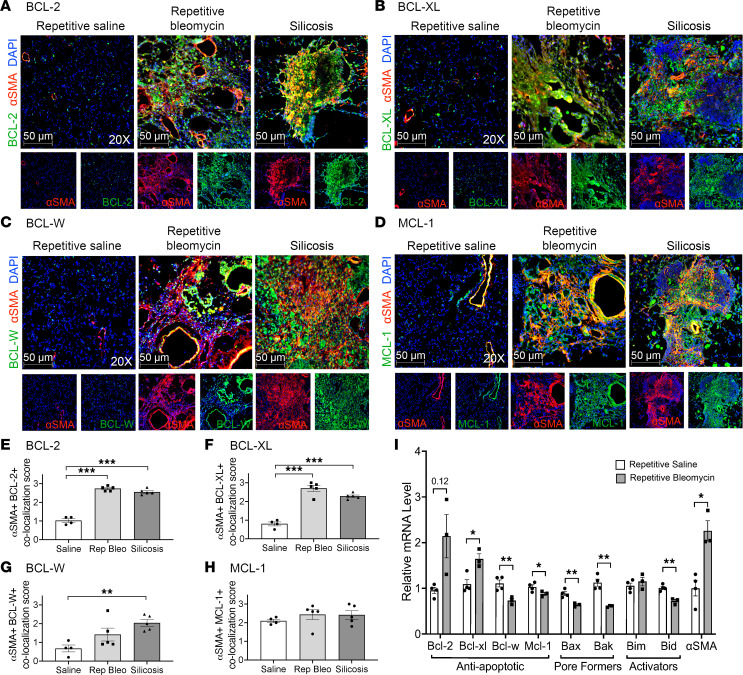
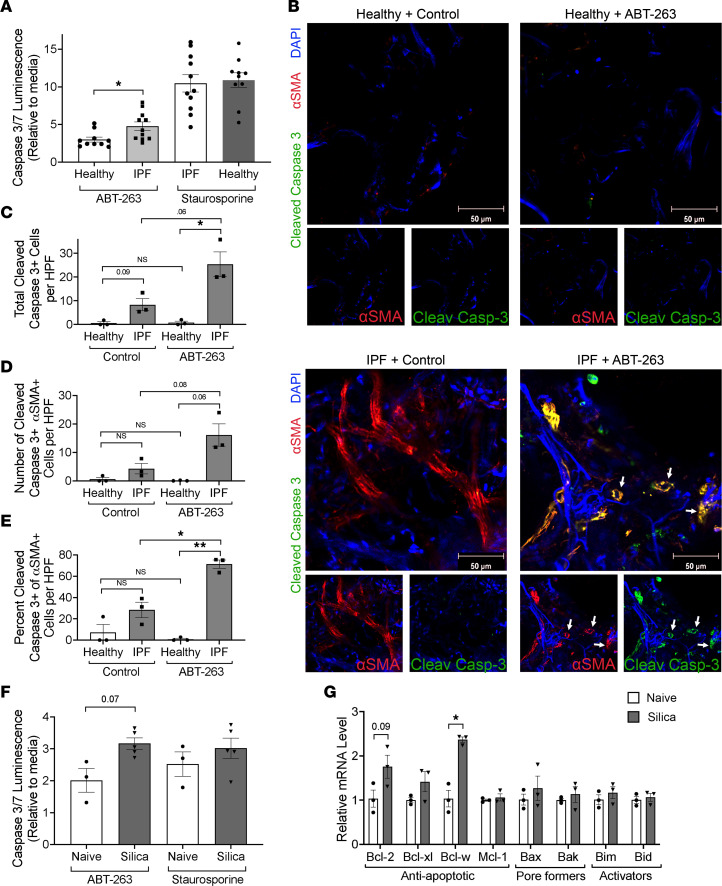
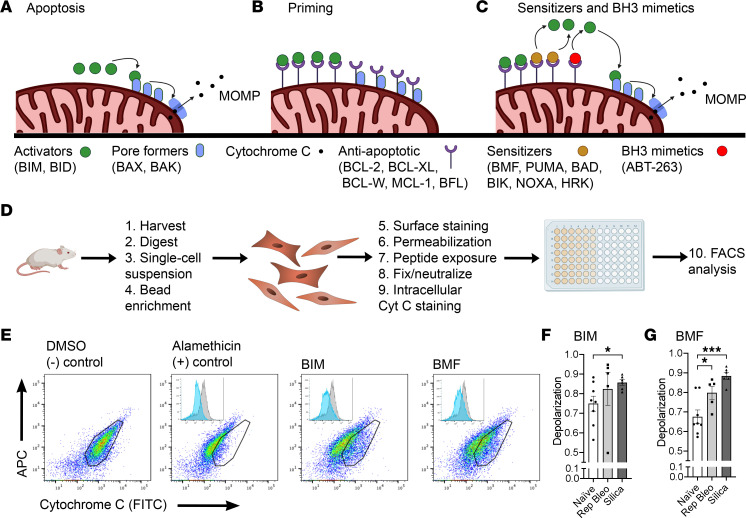
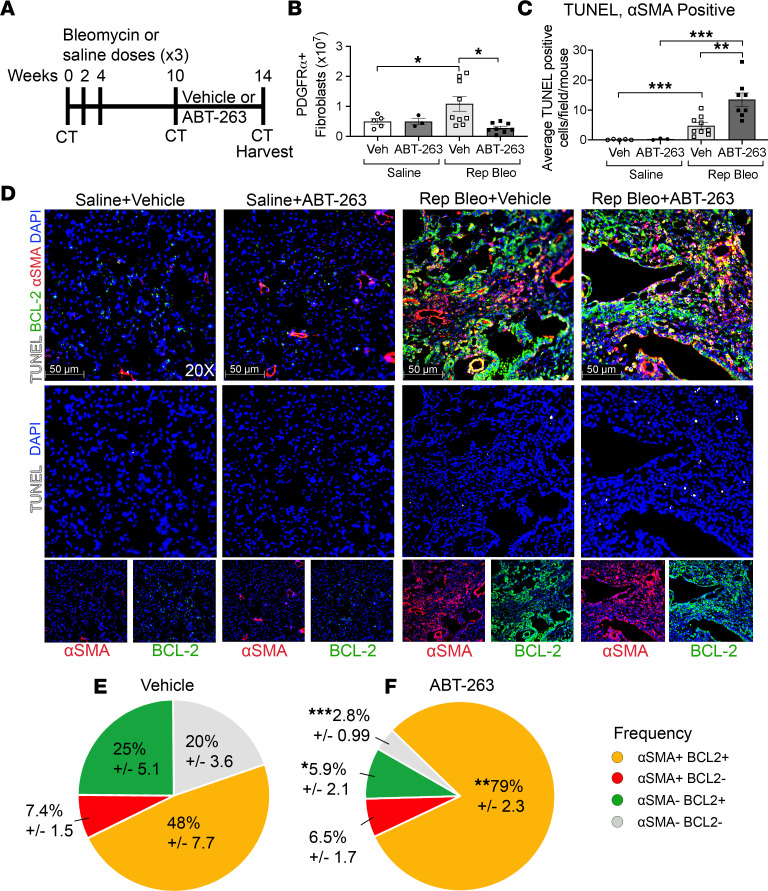
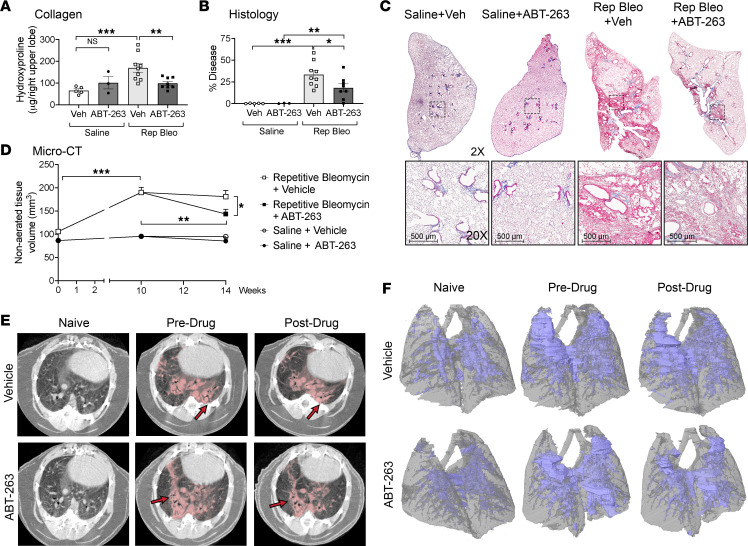
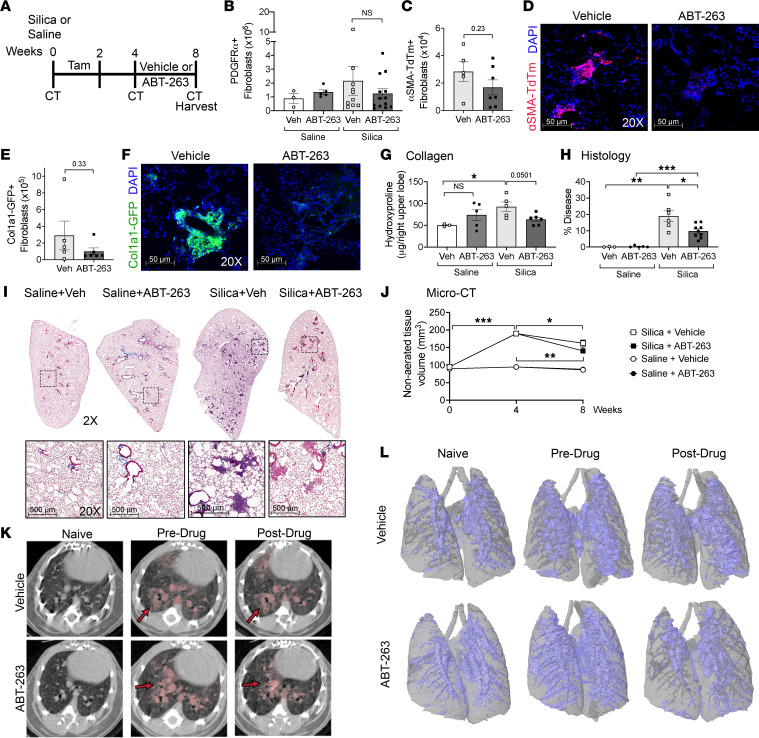
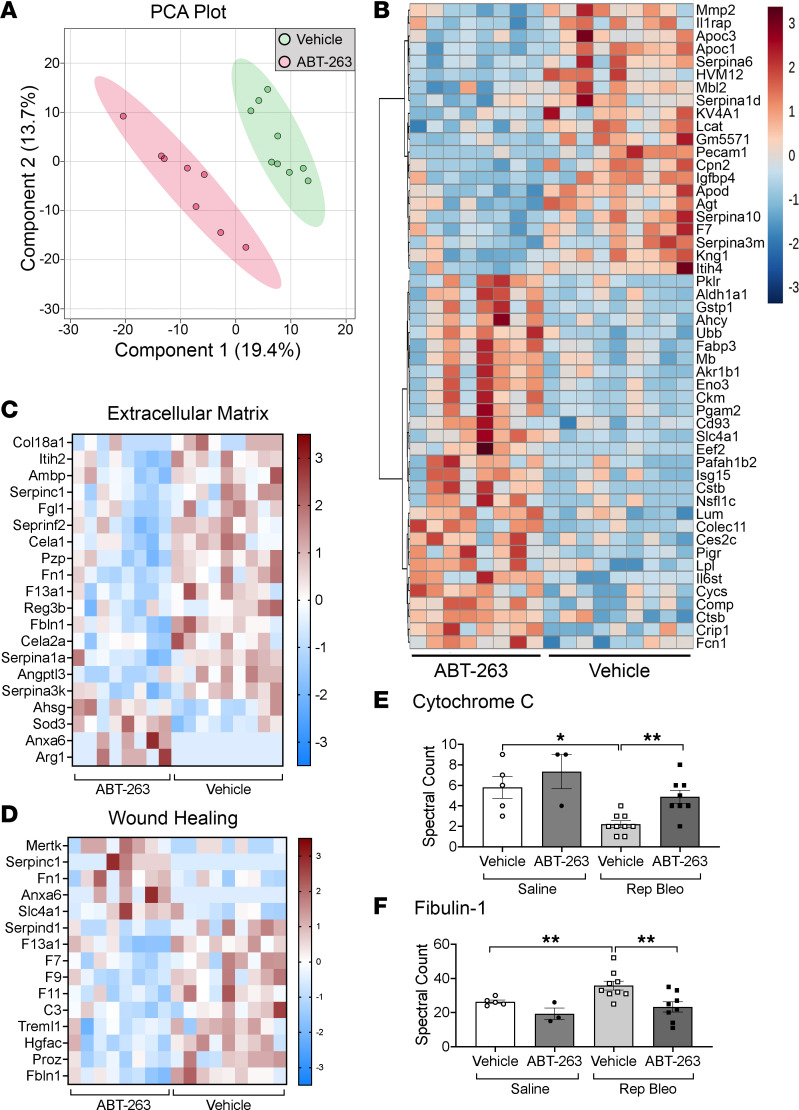
Patients with progressive fibrosing interstitial lung diseases (PF-ILDs) carry a poor prognosis and have limited therapeutic options. A hallmark feature is fibroblast resistance to apoptosis, leading to their persistence, accumulation, and excessive deposition of extracellular matrix. A complex balance of the B cell lymphoma 2 (BCL-2) protein family controlling the intrinsic pathway of apoptosis and fibroblast reliance on antiapoptotic proteins has been hypothesized to contribute to this resistant phenotype. Examination of lung tissue from patients with PF-ILD (idiopathic pulmonary fibrosis and silicosis) and mice with PF-ILD (repetitive bleomycin and silicosis) showed increased expression of antiapoptotic BCL-2 family members in α-smooth muscle actin-positive fibroblasts, suggesting that fibroblasts from fibrotic lungs may exhibit increased susceptibility to inhibition of antiapoptotic BCL-2 family members BCL-2, BCL-XL, and BCL-W with the BH3 mimetic ABT-263. We used 2 murine models of PF-ILD to test the efficacy of ABT-263 in reversing established persistent pulmonary fibrosis. Treatment with ABT-263 induced fibroblast apoptosis, decreased fibroblast numbers, and reduced lung collagen levels, radiographic disease, and histologically evident fibrosis. Our studies provide insight into how fibroblasts gain resistance to apoptosis and become sensitive to the therapeutic inhibition of antiapoptotic proteins. By targeting profibrotic fibroblasts, ABT-263 offers a promising therapeutic option for PF-ILDs.

Keywords: Apoptosis pathways; Cell Biology; Fibrosis; Mouse models; Pulmonology.


Conflict of interest statement

Conflict of interest: The authors have declared that no conflict of interest exists.

Figures

Figure 1
Figure 1. α-SMA+ fibrotic fibroblasts express antiapoptotic BCL-2 family members in IPF and silicosis.
Immunofluorescence imaging of lungs from healthy donors, IPF, and silicosis for anti–α-SMA (red), DAPI (blue), and antiapoptotic BCL-2 family members (green): (A) BCL-2, (B) BCL-XL, (C) BCL-W, (D) MCL-1. (EH) Semiquantitative scoring of colocalization of antiapoptotic BCL-2 family members in α-SMA+ cells: 0 (0%), 1 (1%–33%), 2 (34%–66%), 3 (67%–100%). n = 4–8 individuals per group. Ten images per slide were scored. Graphed as scatterplot with bar, mean ± SEM. *P < 0.05, **P < 0.01, ***P < 0.001, Brown-Forsythe and Welch’s ANOVA with Dunnett’s correction for multiple comparisons. Total magnification with objective 200×.
Figure 2
Figure 2. In 2 preclinical models of PF-ILD, α-SMA+ fibrotic fibroblasts express antiapoptotic BCL-2 family members.
Immunofluorescence imaging of murine lungs from repetitive saline, repetitive bleomycin (28-week), and silicosis (24-week) mice for anti-α-SMA (red), DAPI (blue), and antiapoptotic BCL-2 family members (green): (A) BCL-2, (B) BCL-XL, (C) BCL-W, (D) MCL-1. (EH) Semiquantitative scoring of colocalization of antiapoptotic BCL-2 family members in α-SMA+ cells: 0 (0%), 1 (1%–33%), 2 (34%–66%), 3 (67%–100%). n = 4–5 mice per group. A total of 10 images per slide were scored. (I) Quantitative PCR (qPCR) of BCL-2 family members and α-SMA in ex vivo–sorted primary lung fibroblasts from mice (28-week repetitive saline or 28-week repetitive bleomycin). n = 3–4 mice per group. Graphed as scatterplot with bar, mean ± SEM. *P < 0.05, **P < 0.01, ***P < 0.001, Brown-Forsythe and Welch’s ANOVA with Dunnett’s correction for multiple comparisons or 2-tailed t test with Welch’s correction. Total magnification with objective 200×.
Figure 3
Figure 3. In vitro and ex vivo inhibition of antiapoptotic BCL-2 family members causes fibroblast apoptosis and to a greater degree in fibrotic fibroblasts.
(A) Primary lung fibroblasts from healthy and IPF donors were treated with ABT-263, and apoptosis was measured by caspase-3/7 activity. n = 3 individuals, 3–4 experimental replicates per individual. (B) PCLS from fresh healthy and IPF lungs were treated with ABT-263 and stained for anti–cleaved caspase-3 (green), α-SMA (red), and DAPI (blue) and counted for (C) total cleaved caspase-3–positive cells, (D) total α-SMA cleaved caspase-3 double-positive cells, and (E) the percentage of α-SMA+ cells that were also cleaved caspase-3 positive. n = 3 individuals, 5 images per sample were counted. White arrows indicate α-SMA/cleaved caspase-3 double-positive cells. (F) Primary lung fibroblasts from naive and 8-week silica mice were exposed to ABT-263, and apoptosis was measured by caspase-3/7 activity. n = 3–5. (G) qPCR results from in vitro–cultured fibroblasts from naive and 8-week silica mice. n = 3 per group. Graphed as scatterplot with bar, mean ± SEM. *P < 0.05, **P < 0.01, Brown-Forsythe and Welch’s ANOVA with Dunnett’s correction for multiple comparisons or 2-tailed t test with Welch’s correction.
Figure 4
Figure 4. Ex vivo fibrotic fibroblasts are more primed than those from naive mice.
(A) Schematics demonstrating BCL-2 family member interactions controlling the intrinsic pathway of apoptosis. (A) Apoptosis through activator binding of pore formers and (B) primed phenotype (C) binding of sensitizers or BH3 mimetics displacing activators to drive apoptosis. (D) Schematic demonstrating the steps of BH3 profiling. (E) Representative flow cytometry plots of BH3 profiling and cytochrome c signal loss. BH3 profiling with (F) BIM (100 μM) and (G) BMF (100 μM). n = 5–8 mice per group. Graphed as scatterplot with bar, mean ± SEM. *P < 0.05, ***P < 0.001, 2-tailed t test with Welch’s correction.
Figure 5
Figure 5. ABT-263 induces BCL-2+α-SMA+ fibrotic fibroblast apoptosis in progressive pulmonary fibrosis after repetitive bleomycin.
(A) Schematic of repetitive dosing, ABT-263 treatment, CT, and harvesting schedule. (B) Quantification of LinPDGFRα+ fibroblast population. (C) Quantification of TUNEL+α-SMA+ cells per HPF and (D) representative images after immunofluorescence staining of lungs for BCL-2 (green), α-SMA (red), DAPI (blue), and TUNEL (white) in repetitive saline and repetitive bleomycin mice treated with vehicle or ABT-263. Pie charts demonstrating frequency of TUNEL+: α-SMA+BCL-2+, α-SMA+BCL-2, α-SMABCL-2+, and α-SMABCL-2 cells in repetitive bleomycin mice treated with (E) vehicle or (F) ABT-263. Asterisks represent significant differences in frequency between vehicle and ABT-263–treated fibrotic mice. Graphed as scatterplot with bar, mean ± SEM, or time-course line graph with mean ± SEM. *P < 0.05, **P < 0.01, ***P < 0.001, 2-tailed t test with Welch’s correction. Total magnification with objective 200×.
Figure 6
Figure 6. ABT-263 reverses fibrosis during therapeutic intervention in persistent, progressive fibrosis.
(A) Hydroxyproline content of lungs, (B) semiquantitative histology scoring, and (C) representative trichrome images after vehicle or ABT-263 treatment. (D) Nonaerated lung volume as measured by micro-CT, with representative (E) axial images (red arrows indicate disease) and (F) 3D reconstructions (nonaerated lung in blue, aerated lung in gray). n = 3–9 mice per group. Graphed as scatterplot with bar, mean ± SEM, or time-course line graph with mean ± SEM. *P < 0.05, **P < 0.01, ***P < 0.001, 2-tailed t test with Welch’s correction. Total original magnification 2× (upper panels) and 20× (lower panels).
Figure 7
Figure 7. ABT-263 reduces fibrotic fibroblasts in silicotic nodules and reverses fibrosis in silicosis.
(A) Schematic of silica treatment, tamoxifen dosing, ABT-263 treatment, and harvesting schedule. Quantitation of (B) PDGFRα+ (C) α-SMA TdTm+, and (E) Col1a1-GFP+ fibroblasts. (D and F) Representative immunofluorescence images of frozen sections (n = 2 per group): α-SMA TdTm+ (red), Col1a1-GFP+ (green), and DAPI (blue). (G) Hydroxyproline content of lungs, (H) semiquantitative histology scoring, and (I) representative trichrome images after vehicle or ABT-263 treatment. (J) Nonaerated lung volume as measured by micro-CT, with representative (K) axial images (red arrows indicate disease) and (L) 3D reconstructions (nonaerated lung in blue, aerated lung in gray). n = 3–13 mice per group. Graphed as scatterplot with bar, mean ± SEM, or time-course line graph with mean ± SEM. *P < 0.05, **P < 0.01, ***P < 0.001, 2-tailed t test with Welch’s correction. Total magnification with objective 200×, 2× (upper panels), 20× (lower panels).
Figure 8
Figure 8. Serum proteomic analysis reveals potential biomarkers of ABT-263 antifibrotic activity.
(A) PCA of global proteomic patterns between vehicle- and ABT-263–treated fibrotic mice. (B) Heatmap of normalized signal shows translational differences between vehicle and ABT-263 treatment. Heatmap of differentially abundant proteins in the enrichment pathways and associated proteins for (C) ECM and (D) wound healing. Spectral counts of (E) cytochrome c and (F) fibulin-1 by mass spectrometry analysis. n = 8–9/group. Graphed as scatterplot with bar, mean ± SEM. *P < 0.05, **P < 0.01, 2-tailed t test with Welch’s correction.

References

    1. Brown KK, et al. The natural history of progressive fibrosing interstitial lung diseases. Eur Respir J. 2020;55(6):2000085. doi: 10.1183/13993003.00085-2020. - DOI - PMC - PubMed
    1. Noble PW, et al. Pirfenidone for idiopathic pulmonary fibrosis: analysis of pooled data from three multinational phase 3 trials. Eur Respir J. 2016;47(1):243–253. doi: 10.1183/13993003.00026-2015. - DOI - PMC - PubMed
    1. Flaherty KR, et al. Nintedanib in progressive fibrosing interstitial lung diseases. N Engl J Med. 2019;381(18):1718–1727. doi: 10.1056/NEJMoa1908681. - DOI - PubMed
    1. Horowitz JC, Thannickal VJ. Mechanisms for the resolution of organ fibrosis. Physiology (Bethesda) 2019;34(1):43–55. doi: 10.1152/physiol.00033.2018. - DOI - PMC - PubMed
    1. Cha SI, et al. Compartmentalized expression of c-FLIP in lung tissues of patients with idiopathic pulmonary fibrosis. Am J Respir Cell Mol Biol. 2010;42(2):140–148. doi: 10.1165/rcmb.2008-0419OC. - DOI - PMC - PubMed

Publication types

MeSH terms

Substances