. 2023 Feb 8;8(3):e165369.
doi: 10.1172/jci.insight.165369.

Notch-mediated hepatocyte MCP-1 secretion causes liver fibrosis

Affiliations

Notch-mediated hepatocyte MCP-1 secretion causes liver fibrosis

Jinku Kang et al. JCI Insight. .

Abstract

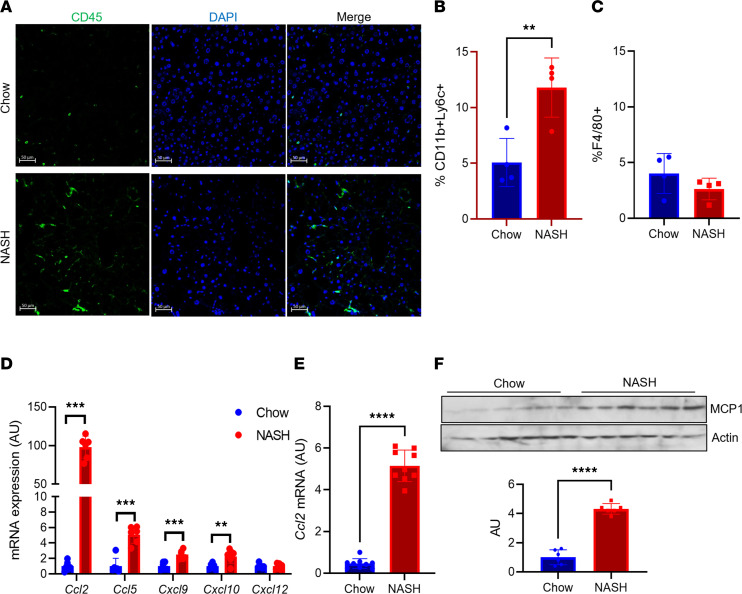
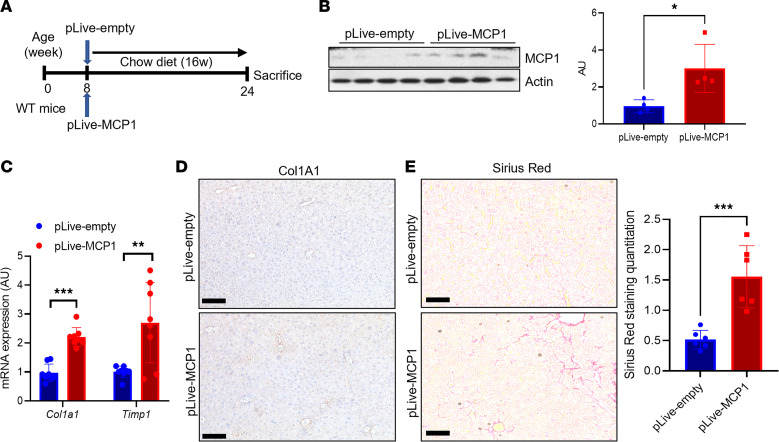
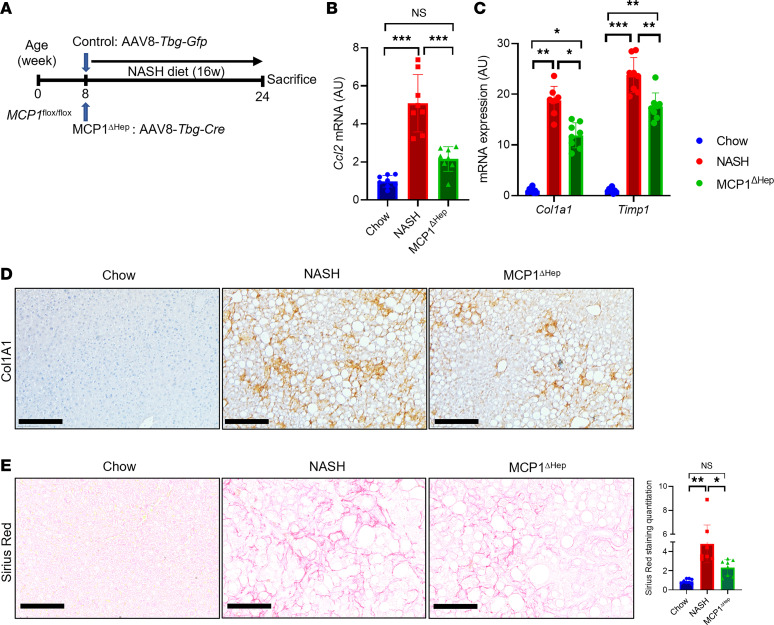
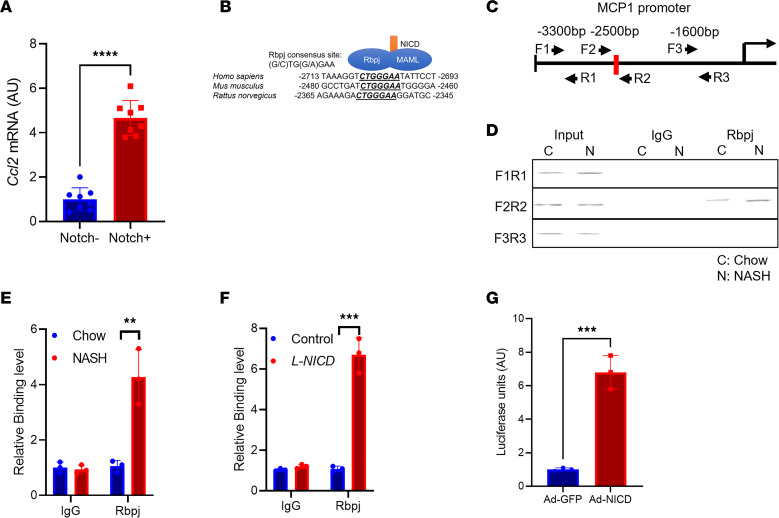
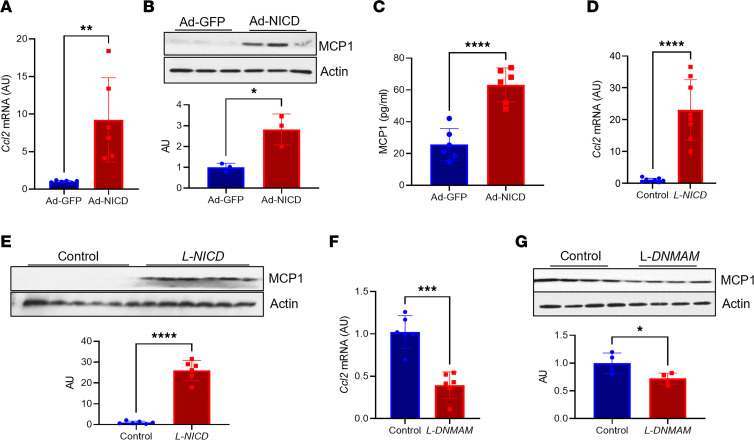
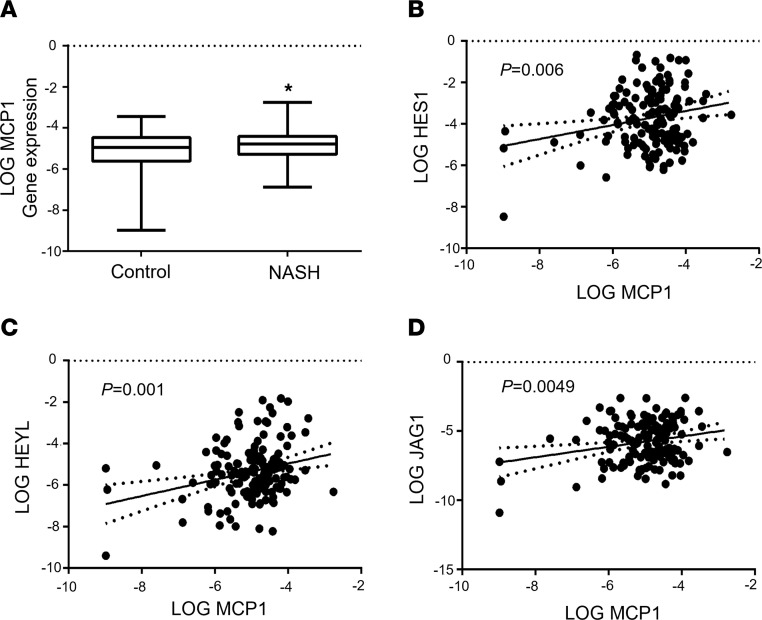
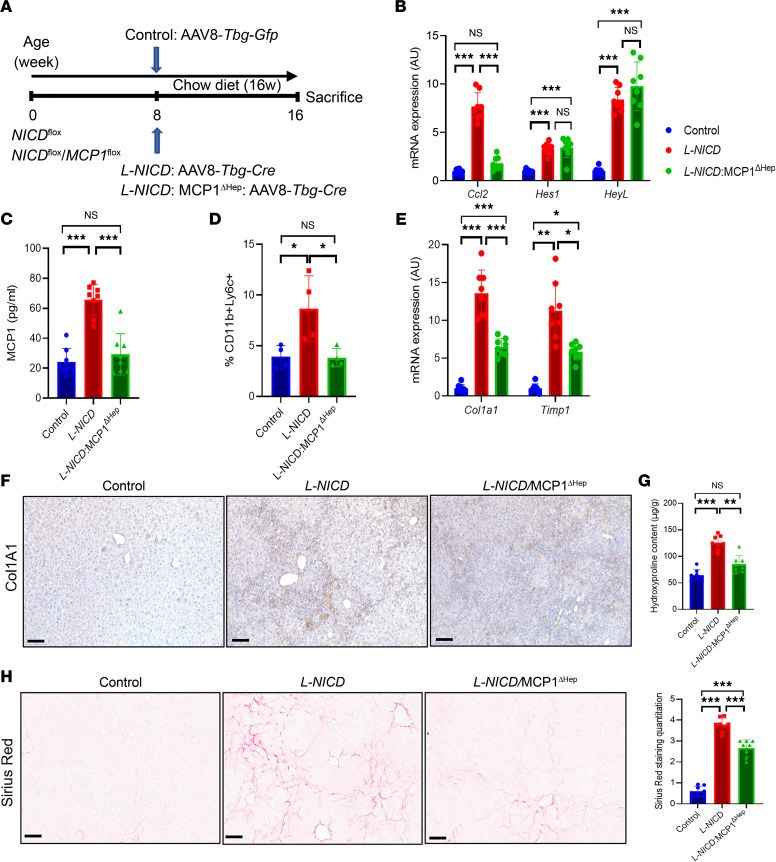
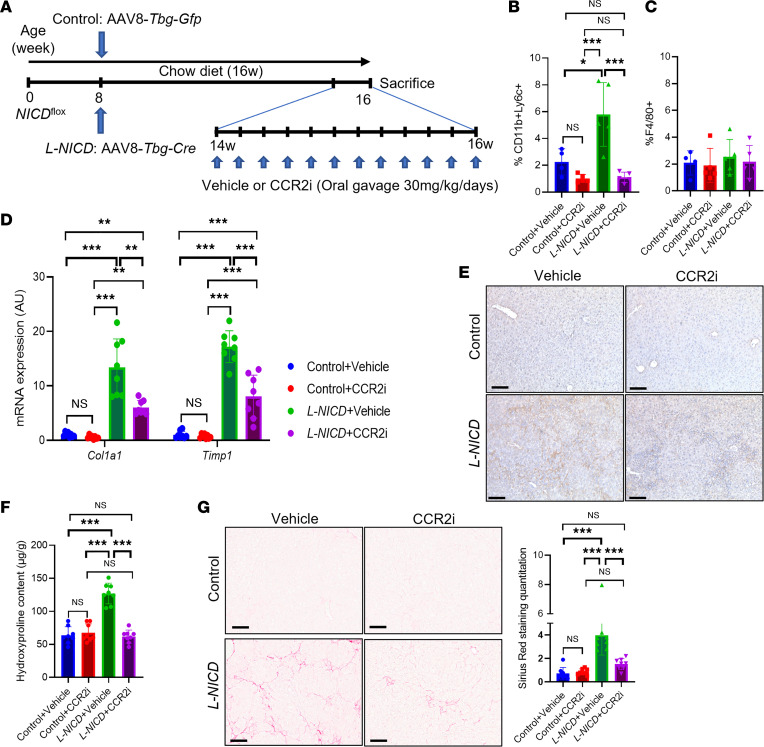
Patients with nonalcoholic steatohepatitis (NASH) have increased expression of liver monocyte chemoattractant protein-1 (MCP-1), but its cellular source and contribution to various aspects of NASH pathophysiology remain debated. We demonstrated increased liver CCL2 (which encodes MCP-1) expression in patients with NASH, and commensurately, a 100-fold increase in hepatocyte Ccl2 expression in a mouse model of NASH, accompanied by increased liver monocyte-derived macrophage (MoMF) infiltrate and liver fibrosis. To test repercussions of increased hepatocyte-derived MCP-1, we generated hepatocyte-specific Ccl2-knockout mice, which showed reduced liver MoMF infiltrate as well as decreased liver fibrosis. Forced hepatocyte MCP-1 expression provoked the opposite phenotype in chow-fed wild-type mice. Consistent with increased hepatocyte Notch signaling in NASH, we observed a close correlation between markers of Notch activation and CCL2 expression in patients with NASH. We found that an evolutionarily conserved Notch/recombination signal binding protein for immunoglobulin kappa J region binding site in the Ccl2 promoter mediated transactivation of the Ccl2 promoter in NASH diet-fed mice. Increased liver MoMF infiltrate and liver fibrosis seen in opposite gain-of-function mice was ameliorated with concomitant hepatocyte Ccl2 knockout or CCR2 inhibitor treatment. Hepatocyte Notch activation prompts MCP-1-dependent increase in liver MoMF infiltration and fibrosis.

Keywords: Chemokines; Fibrosis; Gastroenterology; Metabolism.


Conflict of interest statement

Conflict of interest: The authors have declared that no conflict of interest exists.

Figures

Figure 1
Figure 1. Liver MCP-1 expression is increased in NASH diet–fed mice.
(A) Representative images of CD45+ cells in livers from chow- and NASH diet–fed wild-type (WT) male C57BL/6J mice. (B) FACS analysis of CD11b+Ly6C+ and (C) CD11b+F4/80+ cells from nonparenchymal cells (NPCs) isolated from chow- and NASH diet–fed WT male mice (n = 4 mice/group). (D) Gene expression of key chemokines in hepatocytes isolated from chow- and NASH diet–fed WT male mice (n = 6 mice/group). (E) Ccl2 gene expression in whole liver from chow- and NASH diet–fed WT male mice (n = 9 mice/group). (F) MCP-1 protein and quantitation in whole liver from chow- and NASH diet–fed WT male mice (n = 6 mice/group). MCP-1 and actin blots are derived from the same samples run contemporaneously in parallel gels. Scale bars: 50 μm. All data are shown with group means ± SEM; **, P < 0.01, ***, P < 0.001, ****, P < 0.0001 by 2-tailed t test.
Figure 2
Figure 2. Hepatocyte-derived MCP-1 is necessary and sufficient to induce liver fibrosis.
(A) Experimental schematic for hepatocyte-specific MCP-1 gain of function by hydrodynamic injection of control (pLive-empty) or MCP-1 (pLive-MCP1) vectors in WT male mice (n = 8 mice/group). (B) Liver MCP-1 protein and quantitation from hepatocyte-specific MCP-1 gain of function by hydrodynamic injection of control (pLive-empty) or MCP-1 (pLive-MCP1) vectors in WT male mice (n = 4 mice/group). MCP-1 and actin blots are derived from the same samples run contemporaneously in parallel gels. (C) Gene expression for markers of hepatic stellate cell (HSC) activity from hepatocyte-specific MCP-1 gain of function by hydrodynamic injection of control (pLive-empty) or MCP-1 (pLive-MCP1) vectors in WT male mice (n = 8 mice/group). (D) Representative IHC image of Col1a1 protein expression from hepatocyte-specific MCP-1 gain of function by hydrodynamic injection of control (pLive-empty) or MCP-1 (pLive-MCP1) vectors in WT male mice. (E) Sirius red staining and quantitation from hepatocyte-specific MCP-1 gain of function by hydrodynamic injection of control (pLive-empty) or MCP-1 (pLive-MCP1) vectors in WT male mice (n = 6 mice/group). Scale bars: 50 μm. All data are shown with group means ± SEM; *, P < 0.05, **, P < 0.01, ***, P < 0.001 by 2-tailed t test.
Figure 3
Figure 3. MCP-1 loss of function reduces liver fibrosis with NASH diet for 16 weeks.
(A) Experimental schematic for hepatocyte-specific MCP-1-knockout mice. Male 8-week-old MCP-1fl/fl mice were transduced with AAV8-Tbg-Gfp (Control) or AAV8-Tbg-Cre to generate MCP-1ΔHep male mice, then fed with NASH diet for 16 weeks (n = 8 mice/group). (B) Gene expression for liver Ccl2 from chow- or NASH diet–fed control mice or MCP-1ΔHep male mice (n = 8 mice/group). (C) Markers of HSC activity from chow- or NASH diet–fed control mice or MCP-1ΔHep male mice (n = 8 mice/group). (D) Representative IHC image of Col1a1 protein expression from chow- or NASH diet–fed control mice or MCP-1ΔHep male mice. (E) Liver Sirius red staining and quantitation in control and MCP-1ΔHep male mice (n = 8 mice/group). Scale bars: 50 μm. All data are shown with group means ± SEM; *, P < 0.05, **, P < 0.01, ***, P < 0.001 by 1-way ANOVA followed by Tukey’s multiple comparisons test.
Figure 4
Figure 4. Hepatocyte Notch activity regulates MCP-1.
(A) Ccl2 expression in Notch-inactive and -active hepatocytes isolated from NASH diet–fed transgenic Notch reporter male mice (n = 8 mice/group). (B) Comparative sequence alignment of MCP-1 promoter, with evolutionarily conserved Rbpj binding site indicated. (C) Experimental schematic for chromatin immunoprecipitation (ChIP) experiment, showing primer pairs that include (F2/R2) or bind outside (F1/R1 and F3/R3) the Rbpj binding site in the MCP-1 promoter. (D and E) Rbpj occupancy at the MCP-1 promoter in livers from chow- and NASH diet–fed WT mice (n =3 mice/group). (F) Rbpj occupancy at the MCP-1 promoter in livers from Cre- control and hepatocyte-specific Notch gain-of-function (L-NICD) male mice (n = 3 mice/group). (G) MCP-1 promoter-luciferase activity from Ad-GFP and Ad-NICD transduction of mouse primary hepatocytes (n = 3 biologic replicates/group). All data are shown with group means ± SEM; **, P < 0.01, ***, P < 0.001, ****, P < 0.0001 by 2-tailed t test.
Figure 5
Figure 5. Notch gain or loss of function reduces hepatocyte MCP-1 levels.
(A) Ccl2 gene expression in WT primary hepatocytes transduced with adenovirus encoding GFP or NICD (n = 6 biologic replicates/group). (B) MCP-1 protein in WT primary hepatocytes transduced with adenovirus encoding GFP or NICD (n = 3 biologic replicates/group). MCP-1 and actin blots are derived from samples run on the same gel, with filter paper cut and probed separately. (C) Circulating MCP-1 in WT primary hepatocytes transduced with adenovirus encoding GFP or NICD (n = 6 biologic replicates/group). (D) Liver Ccl2 gene expression in Cre- and L-NICD male mice (n = 8 mice/group). (E) MCP-1 protein levels in Cre- and L-NICD male mice (n = 6 mice/group). MCP-1 and actin blots are derived from samples run on the same gel, with filter paper cut and probed separately. (F) Ccl2 gene expression in livers from NASH diet–fed Cre- and hepatocyte-specific Notch loss-of-function (L-DNMAM) male mice (n = 6 mice/group). (G) MCP-1 protein levels in livers from NASH diet-fed Cre- and hepatocyte-specific Notch loss-of-function (L-DNMAM) male mice (n = 4 mice/group). MCP-1 and actin blots are derived from the same samples run contemporaneously in parallel gels. All data are shown with group means ± SEM; *, P < 0.05, **, P < 0.01, ***, P < 0.001, ****, P < 0.0001 by 2-tailed t test.
Figure 6
Figure 6. Liver CCL2 expression tracks with NOTCH activity in patients.
(A) Liver CCL2 expression and correlation with canonical NOTCH targets (B) HES1 and (C) HEYL, or upstream regulator (D) JAG1, as assessed by qPCR from liver biopsy in patients with (n = 63) versus without NASH (n = 82). Expression of all genes was log-transformed to ensure the assumption of normal distribution. All data are shown with group means ± SEM; *, P < 0.05 by 1-way ANOVA followed by Tukey’s multiple comparisons test.
Figure 7
Figure 7. Notch-induced MCP-1 drives profibrotic macrophage infiltration and liver fibrosis.
(A) Chow-fed NICDfl/fl and NICDfl/fl MCP-1fl/fl were transduced with AAV8-Tbg-Gfp or AAV8-Tbg-Cre to generate control, L-NICD, and L-NICD MCP-1ΔHep male mice (n = 8 mice/group). (B) Liver Ccl2 and Notch target gene expression and (C) serum MCP-1 levels in control, L-NICD, and L-NICD MCP-1ΔHep male mice (n = 8 mice/group). (D) FACS analysis of nonparenchymal cells (NPCs) isolated from livers of control, L-NICD, and L-NICD MCP-1ΔHep male mice (n = 4 mice/group). (E) Gene expression for markers of HSC activity from livers of control, L-NICD, and L-NICD MCP-1ΔHep male mice (n = 8 mice/group). (F) Representative IHC image of Col1a1 protein expression from livers of control, L-NICD, and L-NICD MCP-1ΔHep male mice. (G) Hydroxyproline content from livers of control, L-NICD, and L-NICD MCP-1ΔHep male mice (n = 8 mice/group). (H) Liver Sirius red staining and quantitation in control, L-NICD, and L-NICD MCP-1ΔHep male mice (n = 8 mice/group). Scale bar: 50 μm. All data are shown with group means ± SEM; *, P < 0.05, **, P < 0.01, ***, P < 0.001 by 1-way ANOVA followed by Tukey’s multiple comparisons test.
Figure 8
Figure 8. CCR2i treatment protects from Notch-induced liver fibrosis.
(A) Chow-fed NICDfl/fl male mice were transduced with AAV8-Tbg-Gfp or AAV8-Tbg-Cre to generate control and L-NICD mice, then treated with vehicle or CCR2i (30 mg/kg/d) by daily oral gavage for 2 weeks (n = 8 mice/group). (B) FACS analysis of CD11b+Ly6C+ and (C) F4/80+ nonparenchymal cells (NPCs) isolated from livers of control and L-NICD male mice treated with CCR2i or vehicle (n = 4–5 mice/group). (D) Gene expression for markers of HSC activity in control and L-NICD male mice treated with CCR2i or vehicle (n = 8 mice/group). (E) Representative IHC image of Col1a1 protein expression in control and L-NICD male mice treated with CCR2i or vehicle. (F) Hydroxyproline content in control and L-NICD male mice treated with CCR2i or vehicle (n = 8 mice/group). (G) Liver Sirius red staining and quantitation in control and L-NICD male mice treated with CCR2i or vehicle (n = 8 mice/group). Scale bar: 50 μm. All data are shown with group means ± SEM; *, P < 0.05; **, P < 0.01; ***, P < 0.001 by 1-way ANOVA followed by Tukey’s multiple comparisons test.

References

    1. Eslam M, et al. A new definition for metabolic dysfunction-associated fatty liver disease: an international expert consensus statement. J Hepatol. 2020;73(1):202–209. doi: 10.1016/j.jhep.2020.03.039. - DOI - PubMed
    1. Michelotti GA, et al. NAFLD, NASH and liver cancer. Nat Rev Gastroenterol Hepatol. 2013;10(11):656–665. doi: 10.1038/nrgastro.2013.183. - DOI - PubMed
    1. Rockey DC, et al. Fibrosis--a common pathway to organ injury and failure. N Engl J Med. 2015;373(1):96. doi: 10.1056/NEJMc1415448. - DOI - PubMed
    1. Dulai PS, et al. Increased risk of mortality by fibrosis stage in nonalcoholic fatty liver disease: systematic review and meta-analysis. Hepatology. 2017;65(5):1557–1565. doi: 10.1002/hep.29085. - DOI - PMC - PubMed
    1. Loomba R, Adams LA. The 20% rule of NASH progression: the natural history of advanced fibrosis and cirrhosis caused by NASH. Hepatology. 2019;70(6):1885–1888. doi: 10.1002/hep.30946. - DOI - PMC - PubMed

Publication types