Review
. 2023 Mar 1;129(3):552-580.
doi: 10.1152/jn.00454.2022. Epub 2023 Feb 8.

How our understanding of memory replay evolves

Affiliations
Review

How our understanding of memory replay evolves

Zhe Sage Chen et al. J Neurophysiol. .

Abstract

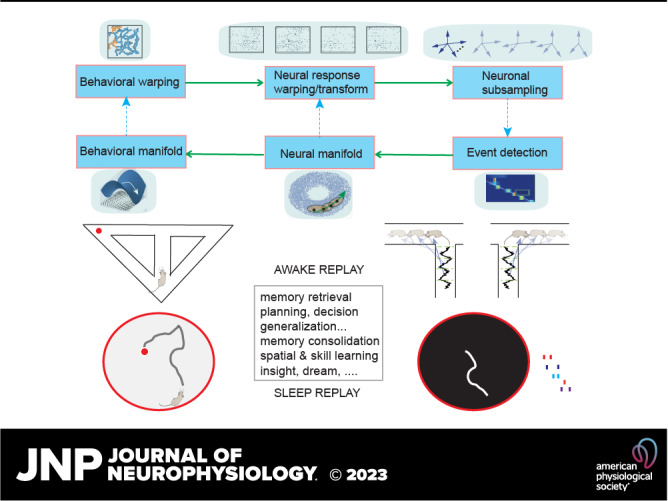
Memory reactivations and replay, widely reported in the hippocampus and cortex across species, have been implicated in memory consolidation, planning, and spatial and skill learning. Technological advances in electrophysiology, calcium imaging, and human neuroimaging techniques have enabled neuroscientists to measure large-scale neural activity with increasing spatiotemporal resolution and have provided opportunities for developing robust analytic methods to identify memory replay. In this article, we first review a large body of historically important and representative memory replay studies from the animal and human literature. We then discuss our current understanding of memory replay functions in learning, planning, and memory consolidation and further discuss the progress in computational modeling that has contributed to these improvements. Next, we review past and present analytic methods for replay analyses and discuss their limitations and challenges. Finally, looking ahead, we discuss some promising analytic methods for detecting nonstereotypical, behaviorally nondecodable structures from large-scale neural recordings. We argue that seamless integration of multisite recordings, real-time replay decoding, and closed-loop manipulation experiments will be essential for delineating the role of memory replay in a wide range of cognitive and motor functions.

Keywords: memory replay; population decoding; representational similarity analysis; sleep replay; temporally delayed linear modeling.


Conflict of interest statement

No conflicts of interest, financial or otherwise, are declared by the authors.

Figures

None
Graphical abstract
Figure 1.
Figure 1.
Memory reactivation and replay in animal studies. A: an example of rat hippocampal replay. The first 2 traces show the raw hippocampal local field potential (LFP) and filtered signal within the ripple band. Ticks show action potentials. Time 0 denotes the onset of putative replay event. Inset shows a 170-ms decoded replay trajectory, and red color denotes high posterior probability. B: illustration of pairwise correlation strengths among hippocampal place cells during run, prerun sleep, and postrun sleep. Edge width is proportional to the Pearson’s correlation. For clarity, only positive correlation > 0.05 is shown [Wilson and McNaughton (15). C: heat map of mean posterior probabilities (left; cyan line indicates temporal sequence), movement (top center), and slow-gamma oscillation (bottom center) for a representative trajectory event. Right: average spiking probability as a function of fast oscillations (20–50 Hz, 10° bin size) for all trajectory events [modified with permission from Pfeiffer and Foster (55); copyright AAAS). D: rat visual cortical (left) and hippocampal (right) neuronal firing sequences during RUN and POST sleep replay event. Cortical firing sequence during RUN and POST sleep. Each row represents a cell, and each tick represents a spike. Cells were assigned numbers 0, 1, etc. and then arranged (01234567) from bottom to top according to the order of their firing peaks (vertical lines). Each colored curve represents the average firing rate of a cell. Triangles and circles, event start and end times, respectively [Ji and Wilson (26)]. E, top: spiking of spatially selective rat medial prefrontal cortex (mPFC) cells (n = 23 cells) during an example trial. The black line denotes the real position of the animal and the gray shaded area an event where trajectory replay has been detected. The dashed box zooms into the trajectory replay event. Bottom: hippocampal (HPC; blue) and mPFC (red) trajectory replay independently. At the goal, the trajectory replay rate in the hippocampus (left) positively correlated with the number of trials required to switch to the new rule, and therefore negatively correlated with rule-switching performance. Conversely, the mPFC trajectory replay rate (right) negatively correlated with number of trials required to switch [modified with permission from Kaefer et al. (43); copyright Elsevier].
Figure 2.
Figure 2.
Memory retrieval and replay in human studies. A, left: 2 examples of human cortical spiking sequences for burst events during 2 separate correct encoding trials. Units were colored according to the ordering in the first sequence (left) to demonstrate rearrangement of units to form the second sequence (right). Right: memory encoding (left) and retrieval (right) spike rasters of the corresponding trial during a paired-associates verbal memory task. Inset text indicates the study pair to be memorized (CROW JEEP), the test probe (JEEP), and the verbalized response (CROW). The sequence replay event had a sequential similarity value of 0.42 (P < 0.002) for this encoding-retrieval sequence pair (all panels are modified with permission from Vaz et al. (45); copyright AAAS). B, left: illustration of human memory replay that generalizes to novel experiences. Top right: illustration of magnetoencephalography (MEG) functional localizer and training a decoding model (consisting of a set of weights over sensors) to recognize each stimulus. Bottom right: illustration of human memory replay follows a previously learned rule but not the visually experienced sequence [all panels are modified with permission from Liu et al. (40); CC-BY license]. C: decoding human memory replay with functional magnetic resonance imaging (fMRI). Top left: participants made age judgments of either faces or houses for a sequence of overlaid face-house images. Task rules required keeping in mind the age and judged category of the current and previous trial, called task states. A classifier was first trained to classify the 16 task states from on-task hippocampal fMRI data and then applied to fMRI data recorded during wakeful rest in the same participants to decode potentially replayed sequences of task states (bottom left). Sequences of decoded task states were related to the sequential structure of the task (center) by counting how many steps separated every 2 consecutive decoded states in the true task structure. Top right: schematic illustration of replay analysis procedure. The trained classifier produced a sequence of classifier labels, which was further transformed into a transition matrix that summarized the frequency of paired task states appearing consecutively. Bottom right: classification accuracy during task performance was significantly higher in hippocampal data than in a permutation test. Average distance to the hyperplane for classified states during rest was lowest in the NOISE, followed by PRE and POST conditions [all panels are modified with permission from Schuck and Niv (42); copyright AAAS].
Figure 3.
Figure 3.
Decoding analysis for large-scale electrophysiological and calcium imaging data. A: illustration of Bayesian decoding analysis of hippocampal replay and shuffling analysis. Position was decoded from the temporally binned (20 ms) ensemble activity using the spatial tuning curves obtained during RUN, producing an estimated probability distribution function (PDF) over position at each time bin. The replay sequence was determined as a temporal shift of the peak in the PDFs. A Radon transform was applied to detect linear replay trajectories. The line with the highest score was selected as the putative replay trajectory, and its score was reported as the “replay score” for the event. The statistical significance of a putative replay was assessed by repeating the scoring procedure on 3 shuffled versions of the same data. The true replay score (red line) was compared with each of these distributions, and the largest of the 3 resulting Monte-Carlo P values is conservatively reported as the significance level for the event [Davidson et al. (29)]. B: illustration of a hidden Markov model (HMM) for unsupervised decoding analysis. Neural observations {yt} are fed to the HMM to infer a latent state sequence {St}, from which the state transition matrix can be derived. The spatial topology can be constructed from the state transition matrix, and the state sequence is correlated with the animal’s position to construct a one-to-one “state-position” correspondence map. The HMM is then applied to decode a new sequence from neural observations of a putative replay event. The neural observations may appear in many forms, such as the sorted spikes, unsorted spike multiunit activity (MUA), or ultrahigh frequency (>300 Hz) amplitude derived from field potentials and calcium fluorescence activity. C: illustration of end-to-end decoding based on deep learning such as a convolutional neural network (CNN) [modified with permission from Frey et al. (173); CC-BY license]. The CNN input is fed into image frames. Each image frame can appear as a time-frequency power map computed from the broadband field potential or as a calcium imaging frame.
Figure 4.
Figure 4.
Multivariate analysis for memory replay based on intracranial electroencephalography (EEG) and magnetoencephalography (MEG) recordings. A: schematic overview of memory reinstatement analysis based on human intracranial EEG recordings. For each trial, retrieval and encoding patterns were correlated via a sliding 400-ms window encompassing relative power changes from 2 to 100 Hz. Each instance of correlating a “frequency × time” encoding pattern with a retrieval pattern gave rise to a single correlation bin in a trial-specific reinstatement map [reproduced with permission from Staresina et al. (86); CC-BY license]. B and C: sequential replay analysis pipeline based on temporally delayed linear modeling (TDLM). During training, multivariate decoding models were constructed for each task stimulus with MEG sensor data. During testing, peak accuracy decoders were applied to neural data from the rest scan to derive a decoded [time × state] reactivation matrix. Finally, a 2-step lagged regression approach was applied to quantify the evidence of sequential replay [reproduced with permission from Nour et al. (188); CC-BY license]. GLM, general linear model.
Figure 5.
Figure 5.
Challenges and misconceptions in hippocampal replay. A: flowchart of behavioral-neural transformation and relationship. At the stage of behavioral warping, new random trajectories (orange) can emerge from stereotyped trajectories (blue). At the neural level, the spike activity of the neuronal population can be subject to compression, stretching, or nonlinear warping. During replay, subsets of N recorded neurons are fired, leading to various versions of subsampling in an N-dimensional neural space. By pooling and stitching multiple detected replay events, a neural manifold can be inferred from a model-based method. In a low-dimensional space, the correspondence between neural trajectories in the neural manifold and behavioral trajectories in the behavioral manifold can be established. B: sorted mean (±SD) reactivation speed of sharp-wave ripples (SWRs) and shuffled counterparts for an example session. An equal number of original and randomized events are displayed. Inset: lognormal distribution (dashed line) fits the distribution of mean reactivation speeds for the original events [reproduced with permission from Stella et al. 2019 (41); copyright Elsevier]. C: illustration of constant and variable speed (top) and time warping (middle) in memory replay. Bottom: 2 examples of rat hippocampal replay events, where the trajectories are better fit by piecewise linear lines (M. A. Wilson, unpublished data).
Figure 6.
Figure 6.
Online replay analysis and closed-loop experiments. A: online event detection analysis. Top: unsorted hippocampal ensemble spikes and replay burst detection based on the hippocampal multiunit activity (MUA) and a predetermined threshold (horizontal dashed line). The marked replay onset (vertical lines) was identified after 3 consecutive time bins that crossed the threshold. Middle: starting from the candidate event onset, spatial position was reconstructed from unsorted ensemble spike activity at each time bin (20 ms). The ongoing decoded “spatial trajectory” was assessed based on the weighted distance correlation using online shuffling statistics. Bottom: estimated P value for the online-evaluated replay (black). An accumulative score (red) was computed as the assessment was continuously updated. Replay was claimed to be detected when the accumulative score reached a threshold, followed by a rest of the accumulative score [Hu et al. (164)]. B: hippocampal firing responses during and after the assembly detection periods. A laser pulse was triggered to disrupt the hippocampal firing pattern unless the decoding algorithm could identify with high confidence that the control environment was detected. Top: illustration of a sharp-wave ripple (SWR) within the time windows before and after the event detection. Raster plots show the expected firing of control and target environment-encoding cells in the respective conditions. Bottom: mean z-scored firing rates before and after the assembly detection time (100 ms) in control and target-decoded putative events [reproduced with permission from Gridchyn et al. (222); copyright Elsevier]. C, left: TRD and TRI denote 2 sets of direct and indirect M1 neurons monitored during the initial learning, respectively. The magnitude of spike-spike coherence (SSC) for TRD-TRD and TRD-TRI pairs showed distinct changes during sleep before and after skill acquisition, reflecting a change of functional connectivity induced by the microstructure of sleep reactivation. Right: learning curves from two brain-machine interface (BMI) sessions in the same rat with and without optogenetic inhibition (denoted by OPTOUP and OPTOOFF sessions, respectively) during sleep sessions [reproduced with permission from Gulati et al. (223); copyright Springer Nature].
Figure 7.
Figure 7.
Emerging methods for analysis of large-scale neural spatiotemporal patterns. A: detecting reactivation of memory traces in motor cortex during sleep. Left: template target trajectories in two 1-dimensional coordinates. KF, Kalman filter. Center: one putative replay event occurring during overnight sleep following the motor task completion. 1st row: relative power in low gamma (40–125 Hz) power band from the medial precentral gyrus (PCG) array. 2nd row: multiunit activity (MUA) spike raster. 3rd row: Kalman filter output demonstrating replay of 2-dimensional (2-D) trajectory associated with the target task. 4th row: the instantaneous correlation between the Kalman filter output and successful target trial template. Blue and red lines indicate X and Y positions, respectively, and dashed horizontal lines indicate the “match” threshold. Right: cross-correlation between the Kalman filter template matching signal and the number of channels observed to have ripple activity in a ±5-s window around each putative replay event. Mean cross-correlation for the X dimension (red) and Y dimension (blue) ±95% confidence interval (CI) is shown for each replay speed. For each putative replay event, the time of the peak in the sum of the cross-correlograms for both the X and Y dimensions is shown as gray circles. The sleep replay occurred at a speed of 1- to 4-fold faster than the actual task speed. The median time to the peak is 2.2 s [all panels are modified with permission from Rubin et al. 2022 (49); CC-BY license]. B, left: analysis procedure of representation-to-theta-phase-clustering in sliding representational similarity analysis (RSA). For each cue, 1 neural representation vector (NRVi) was extracted during cue presentation. For each trial, the changing similarity was calculated between NRVi and all neural vectors (NV1−n) during the retrieval period. Right: exemplary trials depicting representation-to-theta-phase-clustering. The circle at top left depicts the preferred theta phases from 8 different trials (1 for each cue representation). This circle is unfolded at top right [all panels are modified with permission from Kunz et al. (91); CC-BY-NC license]. RS, representational similarity; sRS, sliding representational similarity. C: illustration of traveling analysis of 2-D spatiotemporal patterns. Each 2-D neural pattern is preprocessed at a specific frequency band and visualized as an image frame. Principal component analysis (PCA) and singular value decomposition (SVD) can be used to extract the dominant modes from the image frames. Arrows denote vector fields. Temporal activation traces associated with PCA or SVD modes are further identified. During replay analysis, the similarity between these dominant traces and the detected reactivation trace is calculated [all panels are modified with permission from Townsend and Gong (241); CC-BY license]. a.u., arbitrary units. D: illustration of the spline parameterization for unsupervised decoding (SPUD) method. 1st panel: the spline is parameterized by assigning coordinates along its length. The coordinates represent the values of an internal (latent) state. 2nd panel: moment-by-moment decoding of the internal state is done by reading out the parameterization value at the point on the spline closest to the data point. 3rd panel: parameterization of the spline by coordinate α. 4th panel: coloring of neural states via the unsupervised latent variable estimate (i.e., α) [all panels are modified with permission from Chaudhuri et al. (251); copyright Springer Nature].

Similar articles

Cited by

References

    1. Ryle G. The Concept of Mind. Chicago, IL: University of Chicago Press, 1949.
    1. Ólafsdóttir HF, Bush D, Barry C. The role of hippocampal replay in memory and planning. Curr Biol 28: R37–R50, 2018. doi:10.1016/j.cub.2017.10.073. - DOI - PMC - PubMed
    1. Berényi A, Somogyvári Z, Nagy AJ, Roux L, Long JD, Fujisawa S, Stark E, Leonardo A, Harris TD, Buzsáki G. Large-scale, high-density (up to 512 channels) recording of local circuits in behaving animals. J Neurophysiol 111: 1132–1149, 2014. doi:10.1152/jn.00785.2013. - DOI - PMC - PubMed
    1. Chung JE, Joo HR, Fan JL, Liu DF, Barnett AH, Chen S, Geaghan-Breiner C, Karlsson MP, Karlsson M, Lee KY, Liang H, Magland JF, Pebbles JA, Tooker AC, Greengard LF, Tolosa VM, Frank LM. High-density, long-lasting, and multi-region electrophysiological recordings using polymer electrode arrays. Neuron, 101: 21–31.e5, 2019. doi:10.1016/j.neuron.2018.11.002. - DOI - PMC - PubMed
    1. Juavinett AL, Bekheet G, Churchland AK. Chronically implanted Neuropixels probes enable high-yield recordings in freely moving mice. eLife 8: e47188, 2019. doi:10.7554/eLife.47188. - DOI - PMC - PubMed

Publication types

LinkOut - more resources