. 2023 Mar 1;129(3):662-671.
doi: 10.1152/jn.00005.2023. Epub 2023 Feb 8.

Neuroinflammation with increased glymphatic flow in a murine model of decompression sickness

Affiliations

Neuroinflammation with increased glymphatic flow in a murine model of decompression sickness

Stephen R Thom et al. J Neurophysiol. .

Abstract

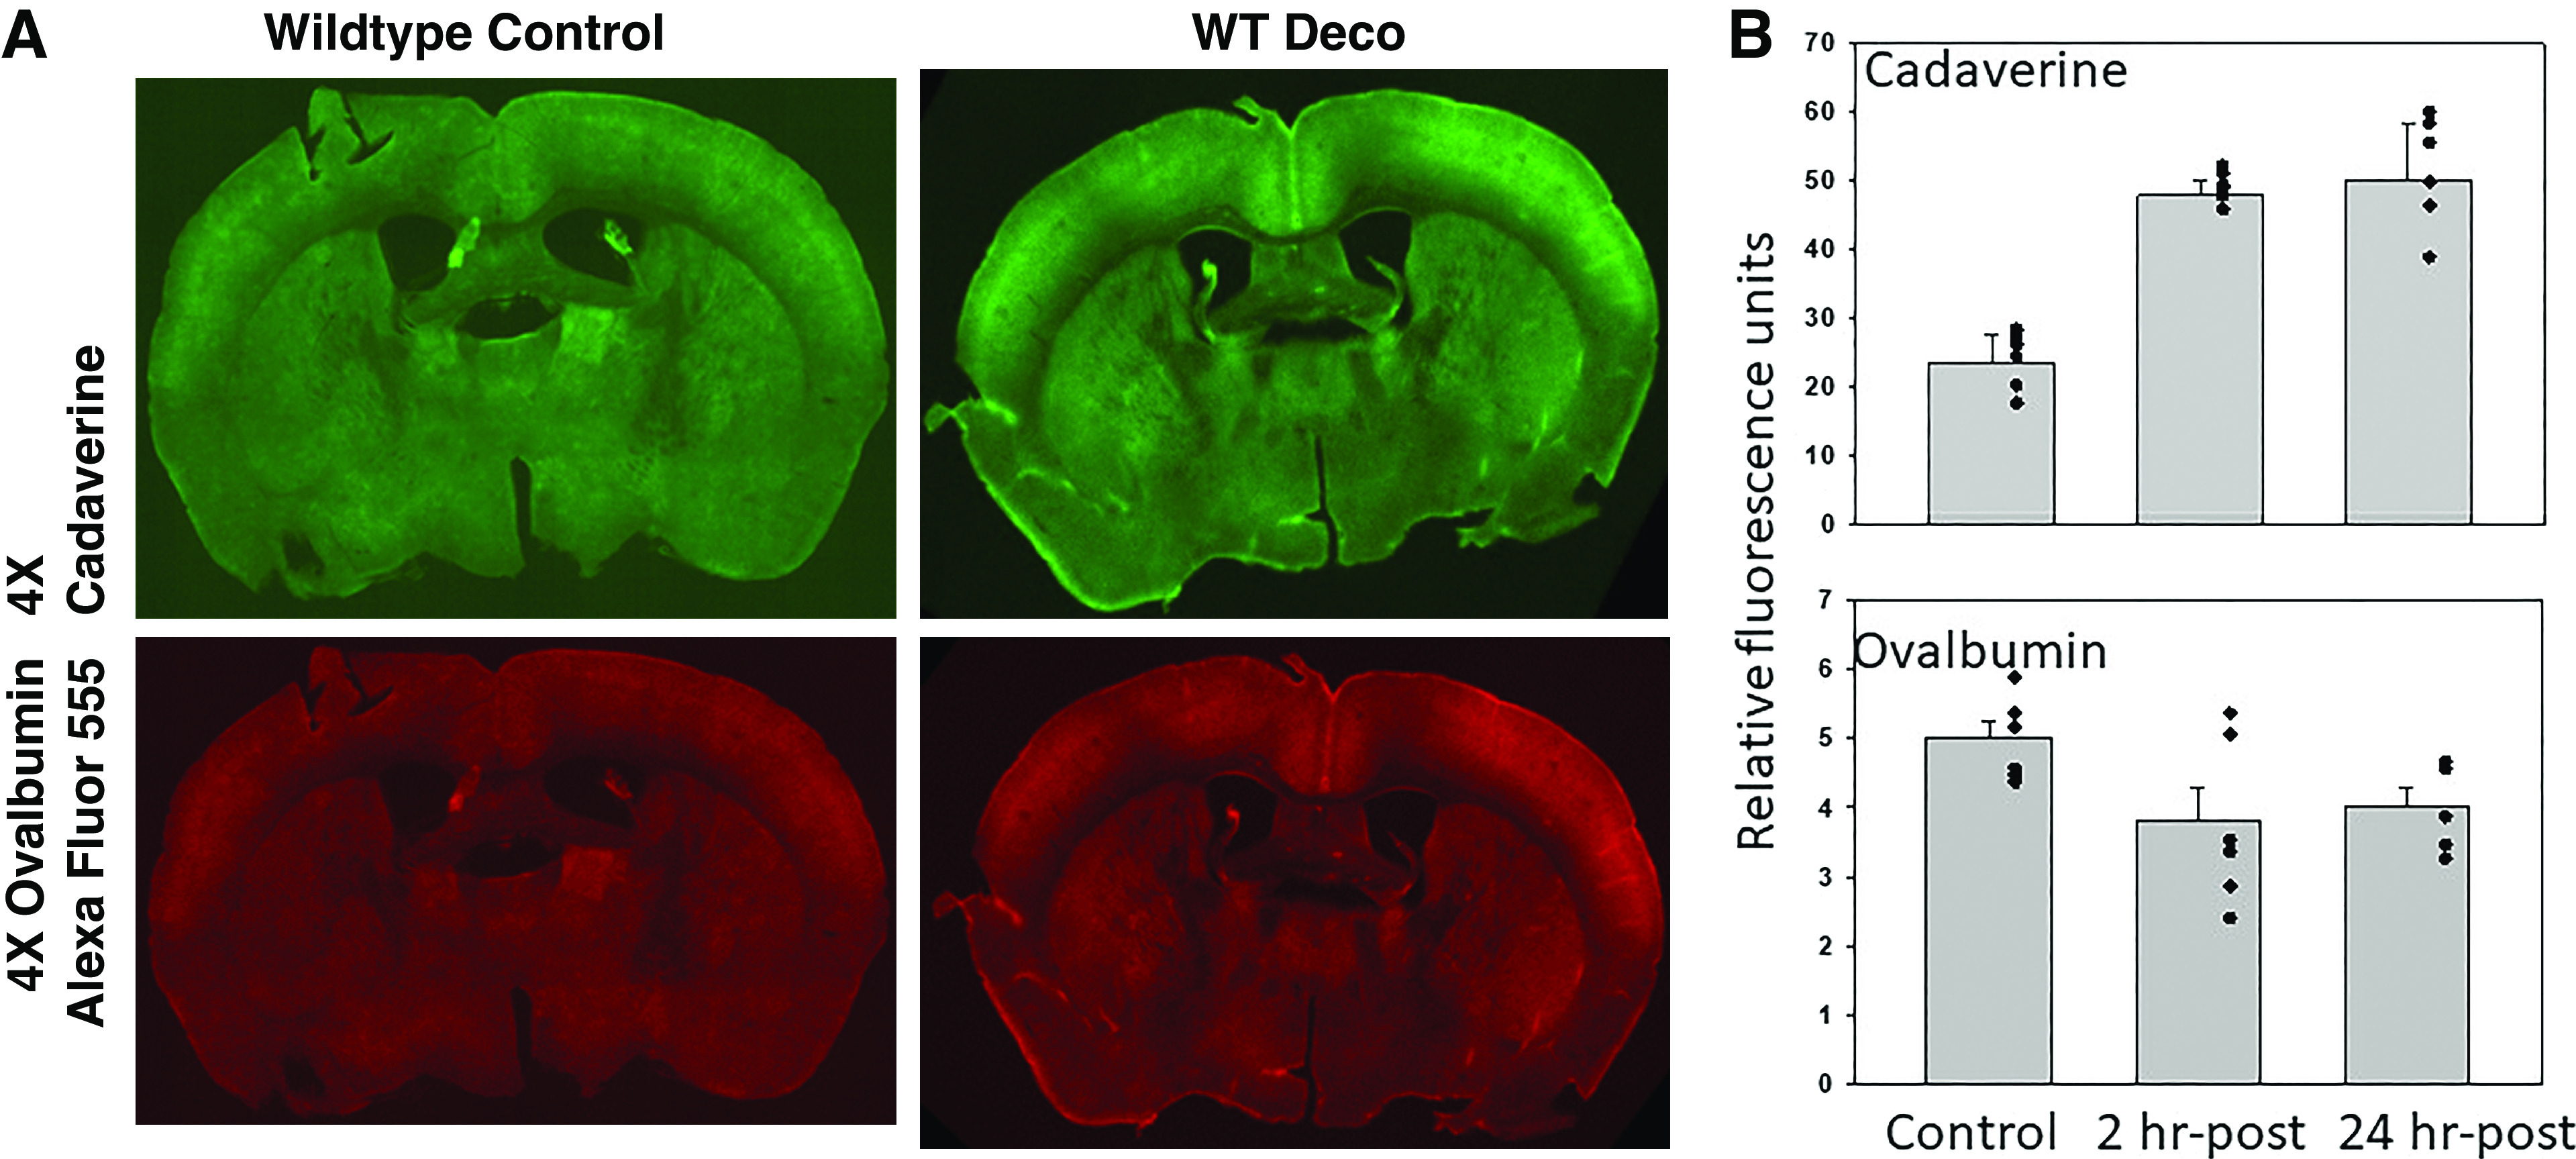
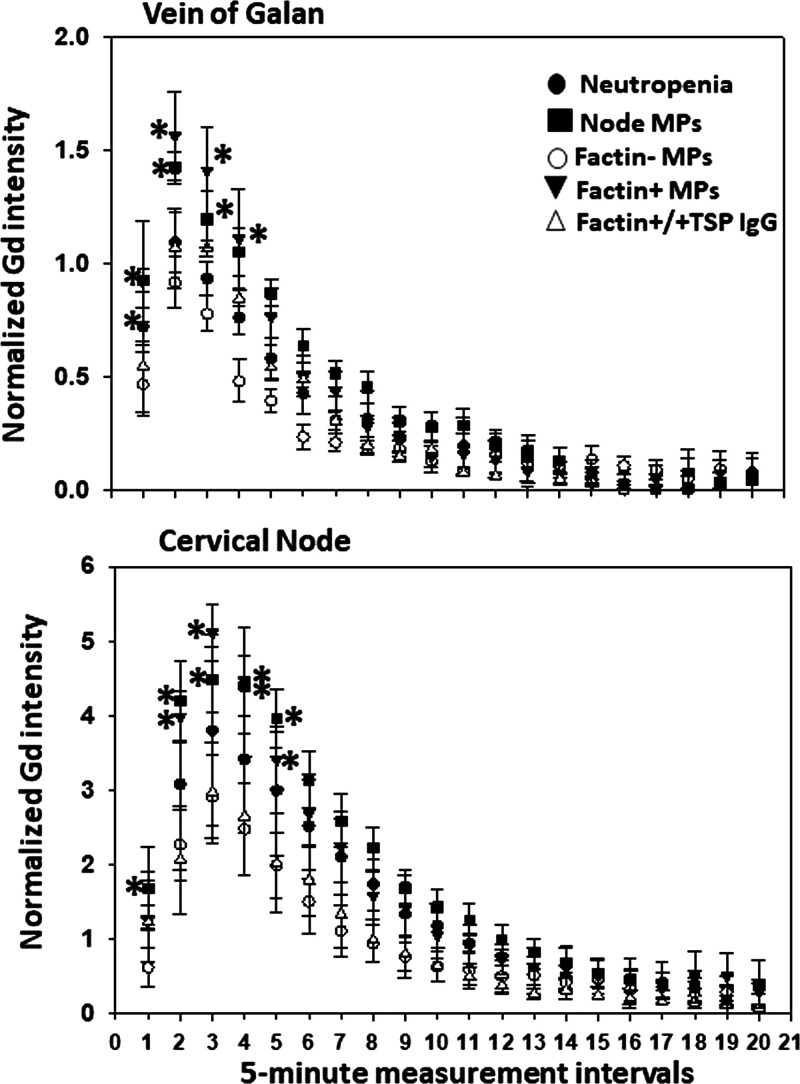
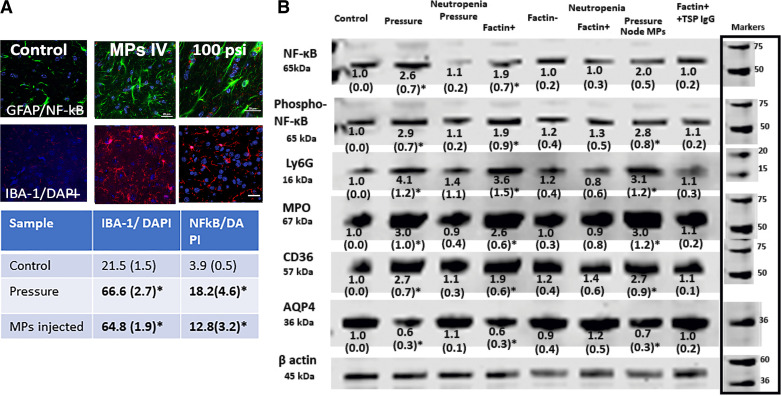
This project investigated glial-based lymphatic (glymphatic) function and its role in a murine model of decompression sickness (DCS). DCS pathophysiology is traditionally viewed as being related to gas bubble formation from insoluble gas on decompression. However, a body of work implicates a role for a subset of inflammatory extracellular vesicles, 0.1 to 1 µm microparticles (MPs) that are elevated in human and rodent models in response to high gas pressure and rise further after decompression. Herein, we describe immunohistochemical and Western blot evidence showing that following high air pressure exposure, there are elevations of astrocyte NF-κB and microglial-ionized calcium-binding adaptor protein-1 (IBA-1) along with fluorescence contrast and MRI findings of an increase in glymphatic flow. Concomitant elevations of central nervous system-derived MPs coexpressing thrombospondin-1 (TSP) drain to deep cervical nodes and then to blood where they cause neutrophil activation. A new set of blood-borne MPs are generated that express filamentous actin at the surface that exacerbate neutrophil activation. Blood-brain barrier integrity is disrupted due to activated neutrophil sequestration that causes further astrocyte and microglial perturbation. When postdecompression node or blood MPs are injected into naïve mice, the same spectrum of abnormalities occur and they are blocked with coadministration of antibody to TSP. We conclude that high pressure/decompression causes neuroinflammation with an increased glymphatic flow. The resulting systemic liberation of TSP-expressing MPs sustains the neuroinflammatory cycle lasting for days.NEW & NOTEWORTHY A murine model of central nervous system (CNS) decompression sickness demonstrates that high gas pressure activates astrocytes and microglia triggering inflammatory microparticle (MP) production. Thrombospondin-expressing MPs are released from the CNS via enhanced glymphatic flow to the systemic circulation where they activate neutrophils. Secondary production of neutrophil-derived MPs causes further cell activation and neutrophil adherence to the brain microvasculature establishing a feed-forward neuroinflammatory cycle.

Keywords: blood brain barrier; microparticles; neutrophil adherence; thrombospondin.


Conflict of interest statement

No conflicts of interest, financial or otherwise, are declared by the authors.

Figures

None
Graphical abstract
Figure 1.
Figure 1.
Glymphatic flow assessment by cisterna magna injections. A shows typical 100-µm coronal brain section fluorescence after injections of ovalbumin conjugated to Alexa Fluor 555 and cadaverine conjugated to Alexa Fluor 488. B shows quantitative evaluation of protein uptake in control mice and mice studied 2- or 24-h postexposure to 790 kPa air pressure for 2 h. Values are means ± SD (for control, 3 male and 3 female mice; for 2-h post-air pressure group, 4 male and 3 female mice; for 24-hour post-air pressure group, 3 male and 3 female mice). Evaluations were performed on 8 brain sections/mouse; individual data points are also shown. WTDeco, wild-type mouse subjected to pressure/decompression.
Figure 2.
Figure 2.
Glymphatic flow assessment by gadolinium (Gd) contrast MRI. A shows a typical image highlighting the signal near the vein of Galan and at deep cervical nodes. Quantified flow was assessed using 1-mm regions of interest at these sites and normalized by including a 60 mM Gd vial beneath the mouse skull within the scanning field. Images of control and decompressed mice are shown in B. Quantifications (C) were plotted on ordinates showing normalized Gd signal (means ± SD, n = 8 mice/group, *P < 0.05, repeated-measures ANOVA) and abscissa showing sequential 5-min 3 D T1-weighted fast low angle shot acquisitions obtained after image calibration and injection of paramagnetic contrast [gadodiamide, Gd, 0.15 mmol (300 µL)/20 g mouse was injected IV at 50 µL/min]. Note that data obtained from mice studied 4 days after decompression demonstrated the same flow increases as those in C done 2 h after decompression (data not shown). DCS, decompression sickness.
Figure 3.
Figure 3.
Glymphatic flow assessment in neutropenic mice and naïve mice injected with isolated MPs. Normalized Gd signals at the vein of Galan and deep cervical nodes for control and 2 h post decompression mice first rendered neutropenic by injections of anti-Ly6G antibodies 4 days prior to study. There were no statistically significant differences between control (Fig. 2) and decompressed mice. Also shown are normalized Gd signals for naïve mice injected with blood-borne F-actin-positive or F-actin-negative MPs isolated from 2 h post decompression mice. *Values for F-actin positive and cervical node MPs isolated from decompressed mice were statistically significantly different by repeated-measures ANOVA (n = 4/group). Also shown are normalized Gd signals for naïve mice injected with postdecompression mouse F-actin-positive MPs first incubated with antibody to TSP-1. Anti-TSP-incubated MPs caused no statistically significant glymphatic flow elevation. Gd, gadolinium; MP, microparticle; TSP, thrombospondin-1.
Figure 4.
Figure 4.
Neuroinflammation in postpressure mouse brains. A shows typical immunohistochemical images with 20-μm scale bars in lower right of each image. The table below the figure shows means ± SD (n = 6 mice, with 4–6 brain slices quantified per mouse) number of cells in brain slices that demonstrated IBA-1 concurrent with DAPI nuclear staining and triple staining with GFAP, p65 subunit of NF-κB, and DAPI in control mice, 2 h postdecompression mice and mice intravenously injected with 60,000 F-actin-positive MPs from mice euthanized 2 h postdecompression. B shows a representative brain homogenate Western blot where numbers below each band indicate means ± SD (n = 4–9 mouse brains per lane) band densities relative to β-actin of control samples from replicate studies. Blots for each protein are contiguous, no cuts/insertions were made. Molecular weight markers for blots are shown on the right margin. Numbers with an asterisk indicate values statistically significant from control (P < 0.05 ANOVA). Blots were probed for the p65 subunit of NF-κB, serine 536 phosphorylated p65 NF-κB (labeled phospho-NF-κB), Ly6G, MPO, CD36, and AQP4. Lanes reflect control mice, those euthanized 2 h postdecompression, neutropenic mice euthanized 2 h postdecompression (note that control neutropenic mice exhibited no statistically significant differences from normal controls but data not shown), naïve mice injected with 60,000 F-actin-positive MPs from mice euthanized 2 h postdecompression, naïve mice injected with 60,000 F-actin-negative MPs from mice euthanized 2 h postdecompression, neutropenic mice injected with 60,000 F-actin-positive MPs from mice euthanized 2 h postdecompression, naïve mice injected with 60,000 cervical node MPs from mice euthanized 2 h postdecompression, naïve mice injected with 60,000 F-actin-positive MPs from mice postdecompression that had first been incubated with antibody to TSP-1. MP, microparticle; MPO, myeloperoxidase; TSP, thrombospondin-1.

Similar articles

Cited by

References

    1. Francis TJ, Pearson RR, Robertson AG, Hodgson M, Dutka AJ, Et F. Central nervous system decompression sickness: latency of 1070 human cases. Undersea Biomed Res 15: 403–417, 1988. - PubMed
    1. Bigley NJ, Perymon H, Bowman GC, Hull BE, Stills HF, Henderson RA. Inflammatory cytokines and cell adhesion molecules in a rat model of decompression sickness. J Interferon Cytokine Res 28: 55–63, 2008. doi:10.1089/jir.2007.0084. - DOI - PubMed
    1. Martin JD, Thom SR. Vascular leukocyte sequestration in decompression sickness and prophylactic hyperbaric oxygen therapy in rats. Aviat Space Environ Med 73: 565–569, 2002. - PubMed
    1. Barak OF, Janjic N, Drvis I, Mijacika T, Mudnic I, Coombs GB, Thom SR, Madic D, Dujic Z. Vascular dysfunction following breath-hold diving. Can J Physiol Pharmacol 98: 124–130, 2020. doi:10.1139/cjpp-2019-0341. - DOI - PubMed
    1. Brett KD, Nugent NZ, Fraser NK, Bhopale VM, Yang M, Thom SR. Microparticle and interleukin-1β production with human simulated compressed air diving. Sci Rep 9: 13320, 2019. doi:10.1038/s41598-019-49924-1. - DOI - PMC - PubMed

Publication types