. 2023 May 1;155(5):e202213170.
doi: 10.1085/jgp.202213170. Epub 2023 Feb 8.

Similar voltage-sensor movement in spHCN channels can cause closing, opening, or inactivation

Affiliations

Similar voltage-sensor movement in spHCN channels can cause closing, opening, or inactivation

Xiaoan Wu et al. J Gen Physiol. .

Abstract

Hyperpolarization-activated cyclic nucleotide-gated (HCN) channels contribute to the rhythmic firing of pacemaker neurons and cardiomyocytes. Mutations in HCN channels are associated with cardiac arrhythmia and epilepsy. HCN channels belong to the superfamily of voltage-gated K+ channels, most of which are activated by depolarization. HCN channels, however, are activated by hyperpolarization. The mechanism behind this reversed gating polarity of HCN channels is not clear. We here show that sea urchin HCN (spHCN) channels with mutations in the C-terminal part of the voltage sensor use the same voltage-sensor movement to either close or open in response to hyperpolarizations depending on the absence or presence of cAMP. Our results support that non-covalent interactions at the C-terminal end of the voltage sensor are critical for HCN gating polarity. These interactions are also critical for the proper closing of the channels because these mutations exhibit large constitutive currents. Since a similar voltage-sensor movement can cause both depolarization- and hyperpolarization-activation in the same channel, this suggests that the coupling between the voltage sensor and the pore is changed to create channels opened by different polarities. We also show an identical voltage-sensor movement in activated and inactivated spHCN channels and suggest a model for spHCN activation and inactivation. Our results suggest the possibility that channels open by opposite voltage dependence, such as HCN and the related EAG channels, use the same voltage-sensor movement but different coupling mechanisms between the voltage sensor and the gate.


Figures

Figure 1.
Figure 1.
HCN structures highlighting S4–S5 interactions in the VSD–PD coupling. (a) HCN1 structure (PDB accession no. 5U6O) with S4 (black) up and gate closed showing the position of QWE residues and interaction between the glutamate (blue) in S4 with the asparagine (orange) in S5. The glutamine residues (pink) interact with each other from four subunits, suggesting a closed gate (dashed oval). (b) HCN1 structure (PDB accession no. 6UQF) with S4 down and gate closed. The interaction between the glutamate (blue) in S4 and the asparagine (orange) in S5 is broken upon downward S4 movement. The glutamine residues (pink) interact with each other from four subunits, suggesting a closed gate (dashed oval). (c) HCN4 structure (PDB accession no. 7NP3) with S4 up and gate open. The interaction between glutamate (blue) and asparagine (orange) is broken. The interactions among glutamines (pink) are broken, suggesting an open gate (dashed oval). CNBD, cyclic nucleotide-binding domain. Only one subunit is shown for clarity except for Q in S6, which is shown from all four subunits.
Figure 2.
Figure 2.
QWE-3G mutant channels open at positive voltages. (a) Sequence alignment of S4 of spHCN, hHCN1, rEag1, and hERG channels. Residue R332 is labeled with an asterisk. (b) spHCN homology model showing the position of QWE residues and potential hydrogen bond interaction between E356 and N370. (c) Current (black) and fluorescence (red) traces from oocytes expressing wt* and QWE-3G* channels in response to the voltage protocol indicated. Cells are held at −10 mV and stepped to voltages between +100 mV and −160 mV in −20 mV followed by a step to +40 mV. (d) Voltage dependence of currents (black) and fluorescence (red) from wt* (dashed lines, n = 3) and QWE-3G* (squares, n = 4) channels. The GV and FV relations were fitted with a single Boltzmann equation. Dashed lines are fits from previous data (Ramentol et al., 2020). (e) Normalized GV (inverted) and FV relations from QWE-3G* (squares, n = 4) channels fitted with a single Boltzmann equation. (f) Current (black) and fluorescence (red) time course from QWE-3G* channels in response to a voltage step to +60 mV from −10 mV. Time constant for the current and fluorescence from QWE-3G* channels is 153.79 ± 16.89 ms (n = 7) and 80.21 ± 3.33 ms (n = 3), respectively. Mean ± SEM.
Figure 3.
Figure 3.
Depolarization-activated QWE-3G channels are blocked by the specific HCN channel blocker ZD7288. Representative current traces from QWE-3G channels in response to the voltage protocol indicated before (left) and after (right) the application of 100 µM ZD7288. The current at +100 mV upon activation was reduced by 81.52 ± 3.26% (n = 3). Mean ± SEM.
Figure 4.
Figure 4.
cAMP reverses the voltage-dependent activation of QWE-3G. (a) Representative current traces from QWE-3G channels before (black) and after (blue) the application of 100 µM cAMP on inside-out patch. Cells are held at −80 mV and stepped to voltages between +100 mV and −160 mV in −20 mV followed by a step to +40 mV. Insets show the tail currents at higher magnifications. In 0 cAMP, the tail currents at +40 mV are larger after steps to positive voltages (e.g., after +100 mV) than after steps to negative voltages (e.g., after −160 mV). Tail currents show channel opening with a sigmoidal time course after steps to negative voltages (e.g., after −160 mV). In 100 μM cAMP, the tail currents at +40 mV are smaller after steps to positive voltages (e.g., after +100 mV) than after steps to negative voltages (e.g., after −160 mV). Tail currents show channel closing after steps to negative voltages (e.g., after −160 mV). (a) Tail currents at +40 mV after −60 mV and +60 mV steps in 0 μM cAMP to better display the time course of the tail currents. (b) Voltage dependence of tail currents from QWE-3G channels before (black) and after (blue) the application of cAMP (n = 3). Time points for tail current measurements are shown with an arrow in a. (c) Steady-state currents from QWE-3G channels before (black) and after (blue) the application of cAMP measured at the end of the voltage steps (n = 3). Dashed lines and arrows show the deviations from a voltage-independent conductance. Mean ± SEM.
Figure 5.
Figure 5.
Increasing cAMP only slightly alters the S4 movement in QWE-3G* channels. Voltage dependence of fluorescence from QWE-3G* channels before (squares, n = 4) and after (circles, n = 3) injection of 5 mM cAMP. Xenopus oocytes were injected with 50 nl of 5 mM cAMP and incubated at 10°C for 15 min to allow for diffusion of cAMP prior to electrophysiological recordings. Assuming a volume of 500 nl for the oocyte, the final concentration would be 500 μM cAMP inside the oocyte after injection and diffusion of cAMP. The amplitude of the fluorescence signal was reduced after the application of cAMP due to photobleaching and/or internalization of labeled channels. The FV relation was fitted with a single Boltzmann equation. Mean ± SEM.
Figure 6.
Figure 6.
Similar S4 movement in activated and inactivated spHCN channels. (a) Current (black) and fluorescence (red) traces from oocytes expressing wt*, R620E*, R620G*, and R620A* channels in response to the indicated voltage protocol. (b) Voltage dependence of currents from wt* (black, n = 3), R620E* (orange, n = 3), R620G* (blue, n = 4), and R620A* (green, n = 4) channels. (c) Voltage dependence of fluorescence from wt* (red, n = 3), R620E* (orange, n = 3), R620G* (blue, n = 4), and R620A* (green, n = 4) channels. The GV and FV relations were fitted with a single Boltzmann equation. Mean ± SEM.
Figure 7.
Figure 7.
R620 mutant channels have decreased currents due to inactivation. (a) Representative current traces from wt*, R620E*, R620G*, R620A*, R620E-F459L*, R620G-F459L*, and R620A-F459L* mutant channels in response to the voltage protocol indicated. (b) Comparison of current amplitude at −120 mV (indicated by arrows) after normalizing the currents to the tail currents at +40 mV from wt* (n = 7), R620E* (n = 3), R620G* (n = 4), R620E-F459L* (n = 3), R620G-F459L* (n = 4), and R620A-F459L* (n = 5) channels, R620A* shows no detectable currents (n = 4). P = 0.037 between wt* and R620E*, P = 0.009 between wt* and R620G*, P = 0.029 between R620E* and R620E-F459L*, and P = 0.014 between R620g* and R620G-F459L*. Asterisks indicate significant differences in the figure using ANOVA test, *P < 0.05 and **P < 0.01.
Figure 8.
Figure 8.
Simulated gating models for wt and mutant spHCN channels. (a) A simplified four-state cartoon of spHCN channels with S4 moving (horizontal transitions) between closed, open, and inactivated states (vertical transitions). In 0 cAMP, downward S4 movement promotes gate opening by removing the inhibitory effect on the gate and subsequently promoting inactivation by interacting with the C-linker. cAMP binding induces a conformational change that moves the C-linker away from S4. Therefore, in 100 cAMP, downward S4 movement promotes gate opening without promoting inactivation. RC, resting closed; AO, activated open; AI, activated inactivated; RI, resting inactivated. (b). Open probability versus voltage for full spHCN model (for the full 15-state model, see Fig. 10) for wt (left) and QWE-3G (right) spHCN channels in 0 and 100 µM cAMP. QWE-3G was modeled by reducing closing transitions to obtain a Popen of 50% at positive voltages. See Table 2 for parameters.
Figure 9.
Figure 9.
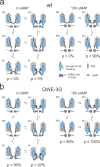
Cartoons of wt and mutant spHCN channels. (a and b) Cartoons of wt (a) and QWE-3G (b) spHCN channels with S4 moving (horizontal transitions) between closed, open, and inactivated states (vertical transitions). Downward S4 movement (RC to AC) promotes first gate opening (AC to AO) and then subsequently inactivation by S4 and C-linker interactions (AO to IO). (a) In the absence of cAMP, the wt spHCN is mainly closed at positive voltages and opens transiently at negative voltages before inactivating. Inactivation is proposed as the gate closing by the interaction between S4 and C-linker. In the presence of cAMP, the wt channels only undergo opening and no inactivation because cAMP binding increases the distance between S4 and the C-linker. (b) In the absence of cAMP, the QWE-3G channels are 50% open at positive voltages due to destabilization of the RC state and open transiently at negative voltages before inactivating (P = 20% at negative voltages). In the presence of cAMP, S4 movement at negative voltages further promotes opening (P from 50 to 100%) in QWE-3G channels because of the absence of inactivation in the cAMP-bound state. RC, resting closed; AC, activated close; RO, resting open; AO, activated open; RI, resting inactivated; AI, activated inactivated. The P value indicates the open probability of mutant channels when S4 is in the up and down states.
Figure 10.
Figure 10.
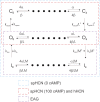
Gating scheme of spHCN channels. 15-state model of an spHCN channel with S4 moving, in horizontal transitions, between closed (C0–C4), open (O0–O4), and inactivated (I0–I4) states, where subscript (0–4) stands for the number of S4s that have moved down to the activated state. Downward S4 movement promotes both gate opening (fast first vertical transition) and inactivation (slower second vertical transition). The first vertical steps are voltage-independent opening–closing conformational changes, with opening rates kopen(n) = kopen Ln and closing rates kclose(n) = kclose/Ln, for n = 0, 1, 2, 3, and 4 (where n stands for the number of subunits that have moved down their S4). Horizontal steps between the open states are set to obey microreversibility. The second vertical steps are voltage-independent inactivation–recovery conformational changes, with inactivation rates kin(n) = kin Mn and recovery from inactivation rates krec(n) = krec/Mn, for n = 0, 1, 2, 3, and 4 (where n stands for the number of subunits that have moved down their S4). Horizontal steps between the inactivated states are set to obey micro-reversibility. See Table 2 for parameters. In the absence of cAMP, spHCN channels undergo both channel opening and channel inactivation upon S4 activation (blue dashed box). In the presence of cAMP, spHCN channels only undergo channel opening (red dashed box). We propose in the Discussion that Kv10.1 (EAG) channels during depolarization-activated opening undergo similar conformational changes as during the recovery of inactivation of spHCN channels, but in that case, the inactivated states would be called closed states and the krec and kin rates would be called kopen and kclose, respectively (purple dashed box).

Similar articles

Cited by

References

    1. Altomare, C., Bucchi A., Camatini E., Baruscotti M., Viscomi C., Moroni A., and DiFrancesco D.. 2001. Integrated allosteric model of voltage gating of HCN channels. J. Gen. Physiol. 117:519–532. 10.1085/jgp.117.6.519 - DOI - PMC - PubMed
    1. Biel, M., Wahl-Schott C., Michalakis S., and Zong X.. 2009. Hyperpolarization-activated cation channels: From genes to function. Physiol. Rev. 89:847–885. 10.1152/physrev.00029.2008 - DOI - PubMed
    1. Brown, H.F., DiFrancesco D., and Noble S.J.. 1979. How does adrenaline accelerate the heart? Nature. 280:235–236. 10.1038/280235a0 - DOI - PubMed
    1. Bruening-Wright, A., and Larsson H.P.. 2007. Slow conformational changes of the voltage sensor during the mode shift in hyperpolarization-activated cyclic-nucleotide-gated channels. J. Neurosci. 27:270–278. 10.1523/JNEUROSCI.3801-06.2007 - DOI - PMC - PubMed
    1. Chen, S., Wang J., and Siegelbaum S.A.. 2001. Properties of hyperpolarization-activated pacemaker current defined by coassembly of HCN1 and HCN2 subunits and basal modulation by cyclic nucleotide. J. Gen. Physiol. 117:491–504. 10.1085/jgp.117.5.491 - DOI - PMC - PubMed

Publication types

MeSH terms

Substances