. 2023 Jun;91(3):311-324.
doi: 10.1007/s00239-022-10087-9. Epub 2023 Feb 8.

Case Studies in the Assessment of Microbial Fitness: Seemingly Subtle Changes Can Have Major Effects on Phenotypic Outcomes

Affiliations

Case Studies in the Assessment of Microbial Fitness: Seemingly Subtle Changes Can Have Major Effects on Phenotypic Outcomes

Sarah B Worthan et al. J Mol Evol. 2023 Jun.

Abstract

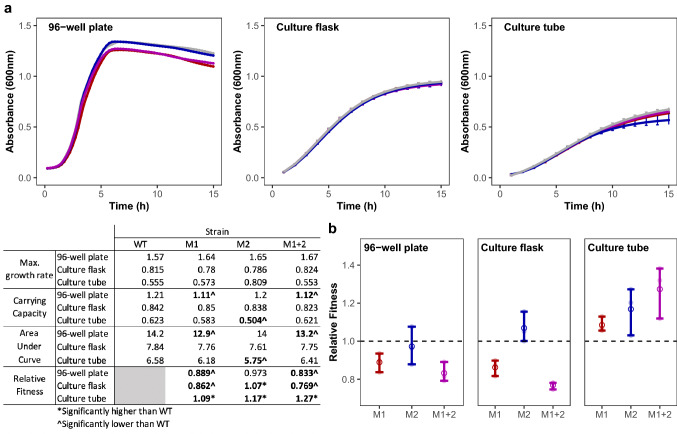
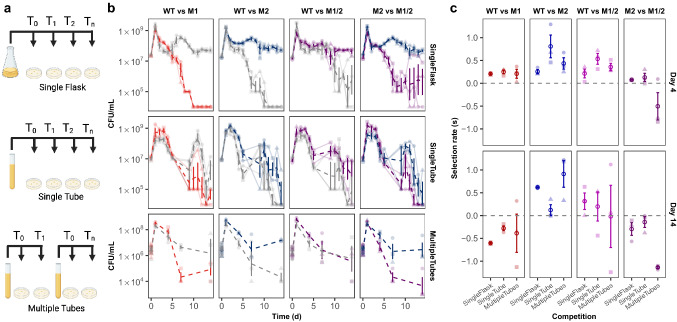
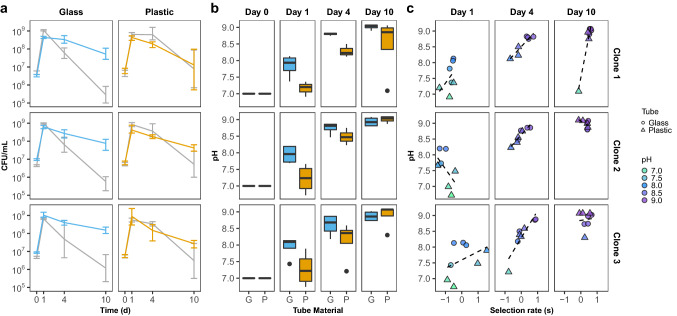
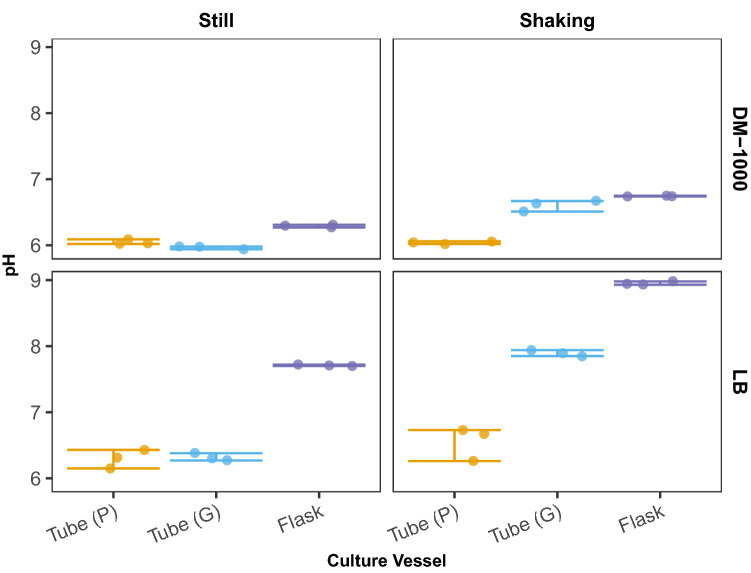
Following the completion of an adaptive evolution experiment, fitness evaluations are routinely conducted to assess the magnitude of adaptation. In doing so, proper consideration should be given when determining the appropriate methods as trade-offs may exist between accuracy and throughput. Here, we present three instances in which small changes in the framework or execution of fitness evaluations significantly impacted the outcomes. The first case illustrates that discrepancies in fitness conclusions can arise depending on the approach to evaluating fitness, the culture vessel used, and the sampling method. The second case reveals that variations in environmental conditions can occur associated with culture vessel material. Specifically, these subtle changes can greatly affect microbial physiology leading to changes in the culture pH and distorting fitness measurements. Finally, the last case reports that heterogeneity in CFU formation time can result in inaccurate fitness conclusions. Based on each case, considerations and recommendations are presented for future adaptive evolution experiments.

Keywords: Competition; Escherichia coli; Experimental Evolution; Growth curves; Starvation; pH.


Conflict of interest statement

The authors have no competing interests to declare that are relevant to the content of this article.

Figures

Fig. 1
Fig. 1
Growth patterns and fitness of engineered mutant strains and their WT ancestor vary according to growth vessel type. a The growth of WT (grey) and three engineered mutant strains, M1 (red), M2 (blue), M1/2 (purple), were evaluated in three types of growth vessels: a 96-well plate, culture tubes, and culture flasks over 15 h. Growth patterns of tested strains differ between growth vessels. b Relative fitness of M1, M2, and M1/2 in pairwise competition assays against WT ancestor after 24 h of growth in a 96-well plate, culture tube, or culture flask demonstrate variations in fitness based on growth vessel. Dashed line represents a 1:1 ratio of mutant strain and WT ancestor. Inlaid table contains maximum growth rate, carrying capacity, and area under the curve (calculated from growth curves in panel a), as well as relative fitness calculations (calculated from data in panel b) of each strain. Data points and error bars represent the mean and 95% confidence interval, respectively. All data are representative of at least three biological replicates (Color figure online)
Fig. 2
Fig. 2
Competition dynamics between three engineered mutants and their WT ancestor differs based on sampling method. a Three sampling methods used for competitions included repeatedly sampling a single competition grown in a flask (Single Flask) or tube (Single Tube) or sampling a competition tube once in which one competition tube is sampled per time point (Multiple Tubes). b Viable plate counts, expressed as CFU/ml, of competitions between engineered mutants M1 (red), M2 (blue), and M1/2 (purple) and their WT ancestor (grey) using the three different sampling methods (single flask, single tube, multiple tubes) over a period of 14 days reveal variations in competition dynamics. Emboldened dashed lines represent the average CFU/ml of the lightly shaded dashed lines of the three replicates (circle, triangle, square) measured over 14 days of continuous growth. c Selection rate (s) for each matchup on day 4 and 14 of the pairwise competitions when performed using three different sampling methods. Lightly shaded data points represent each biological replicate (circle, triangle, square) while the emboldened open circle represents the mean. All error bars represent 95% confidence intervals (Color figure online)
Fig. 3
Fig. 3
Culture vessel material affects competition dynamics, culture pH, and fitness of evaluated clones Three individual evolved clones were co-cultured and competed against their WT ancestor strain in either glass or plastic culture tubes for a period of 10 days. a Growth (as measured by viable plate counts expressed as CFU/ml) of co-cultures containing the WT ancestor (grey) and 3 selected individual evolved clones (Clone 1, Clone 2, Clone 3) grown in either glass (blue) or plastic (orange) culture tubes over 10 days show differences in competition dynamics. Data points represent mean with error bars showing 95% confidence interval. b Box plots with quantile distribution of culture pH measurements on 0, 1, 4, and 10 days of competition when co-cultures were grown in either glass (G, blue) or plastic (P, orange) culture tubes. Co-cultures performed in plastic tubes are more acidic than those in glass tubes on days 1 and 4 of competition (Wilcox test; PDay1 = 0.002; PDay4 = 0.006; PDay10 = 0.68). c Plots comparing the selection rate (s) of evolved clones and their culture pH when grown in glass (circle) or plastic (triangle) culture tubes after 1, 4, and 10 days of competition. Dashed line represents the best fit line. On day 4 of competition, there is a significant positive correlation between selection rate and culture pH. All averages are based on at least three biological replicates (Color figure online)
Fig. 4
Fig. 4
Measurements of media pH when cultured in various conditions. The media pH of WT cultures grown in either LB or DM-1000 broth in tubes made of either plastic (P, orange) or glass (G, cyan), as well as flasks (purple) was measured following 24 h of growth in either still or shaking conditions. In both medias, cultures grown in plastic tubes are acidic in both still and shaking conditions, while cultures grown in glass tubes are more acidic when incubated still than when incubated in shaking conditions. Data points represent three biological replicates and error bars reflect the 95% confidence interval (Color figure online)
Fig. 5
Fig. 5
Heterogeneity of colony development in evolved lines aThe proportion of colonies appearing after 24 h of incubation (late colonies) in various shown monocultures or co-culture competitions against their WT ancestor that either contain Clone 1 (red) or do not contain Clone 1 (blue) after 0,1,4, and 10 days of growth. Competitions which included Clone 1 displayed an increase in the proportion of late colonies. Each data point represents the proportion of colonies appearing on TA media after 24 h of incubation prepared from serially diluted competition tubes. Error bars represent 95% CI. Representative plates after b 24 h and c 48 h of incubation with arrows denoting red colonies (Color figure online)

References

    1. Ayala FJ. Evolution of fitness in experimental populations of drosophila serrata. Science. 1965;150:903–905. doi: 10.1126/science.150.3698.903. - DOI - PubMed
    1. Baba T, Ara T, Hasegawa M, et al. Construction of Escherichia coli K-12 in-frame, single-gene knockout mutants: The Keio collection. Mol Syst Biol. 2006;2(2006):0008. doi: 10.1038/msb4100050. - DOI - PMC - PubMed
    1. Basan M, Hui S, Okano H, et al. Overflow metabolism in Escherichia coli results from efficient proteome allocation. Nature. 2015;528:99–104. doi: 10.1038/nature15765. - DOI - PMC - PubMed
    1. Behringer MG, Choi BI, Miller SF, et al. Escherichia coli cultures maintain stable subpopulation structure during long-term evolution. Proc Natl Acad Sci USA. 2018;115:E4642–E4650. doi: 10.1073/pnas.1708371115. - DOI - PMC - PubMed
    1. Behringer MG, Ho W-C, Meraz JC, et al. Complex ecotype dynamics evolve in response to fluctuating resources. Mbio. 2022;13:e03467–e3521. doi: 10.1128/mbio.03467-21. - DOI - PMC - PubMed

Publication types

MeSH terms

LinkOut - more resources