

Altered glucose-dependent secretion of glucagon and ACTH is associated with insulin resistance, assessed by population analysis
- PMID: 36752854
- PMCID: PMC10083665
- DOI: 10.1530/EC-22-0506
Altered glucose-dependent secretion of glucagon and ACTH is associated with insulin resistance, assessed by population analysis
Abstract
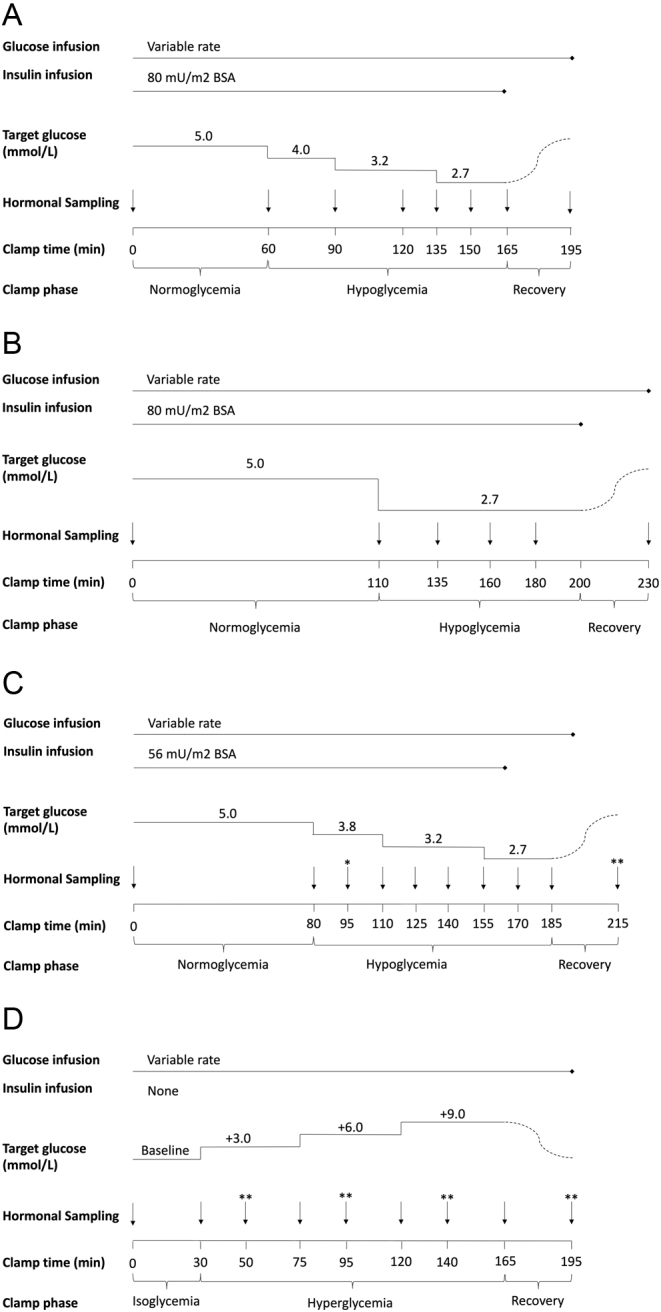
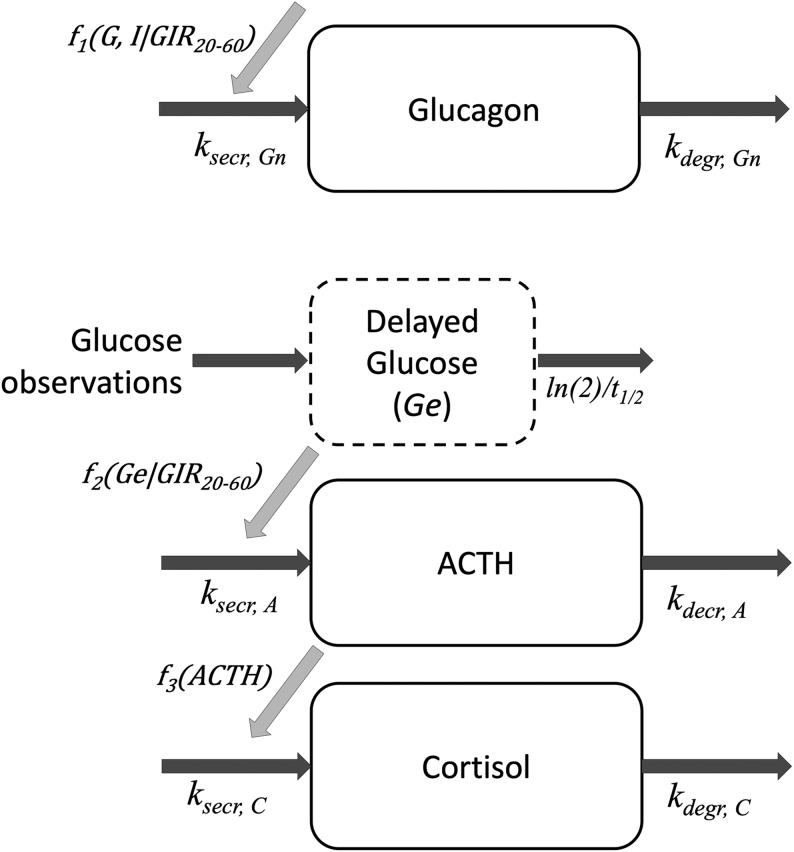
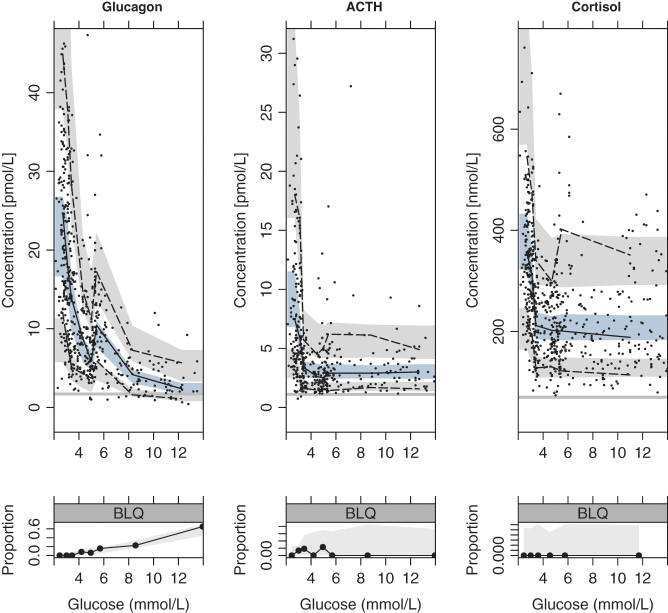
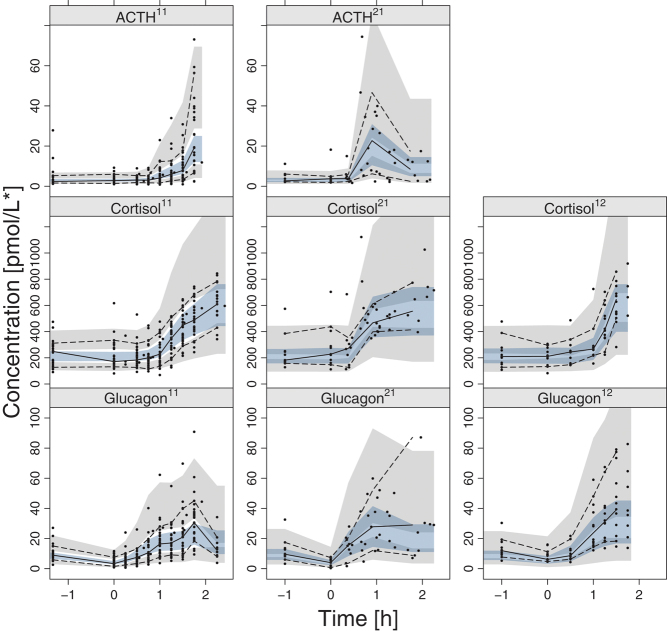
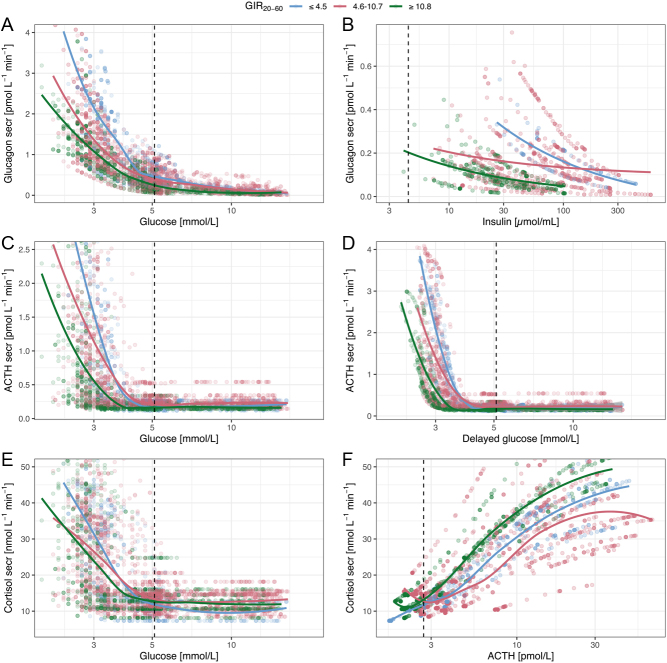
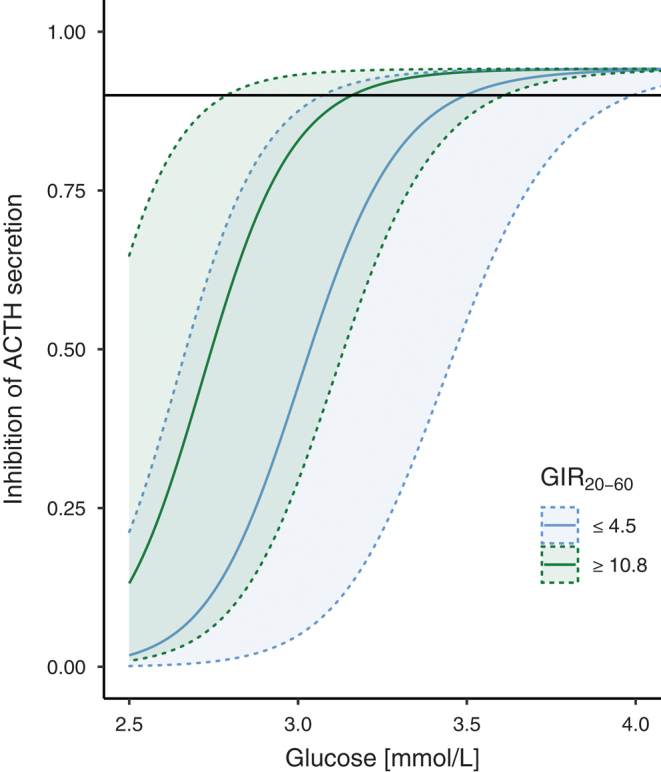
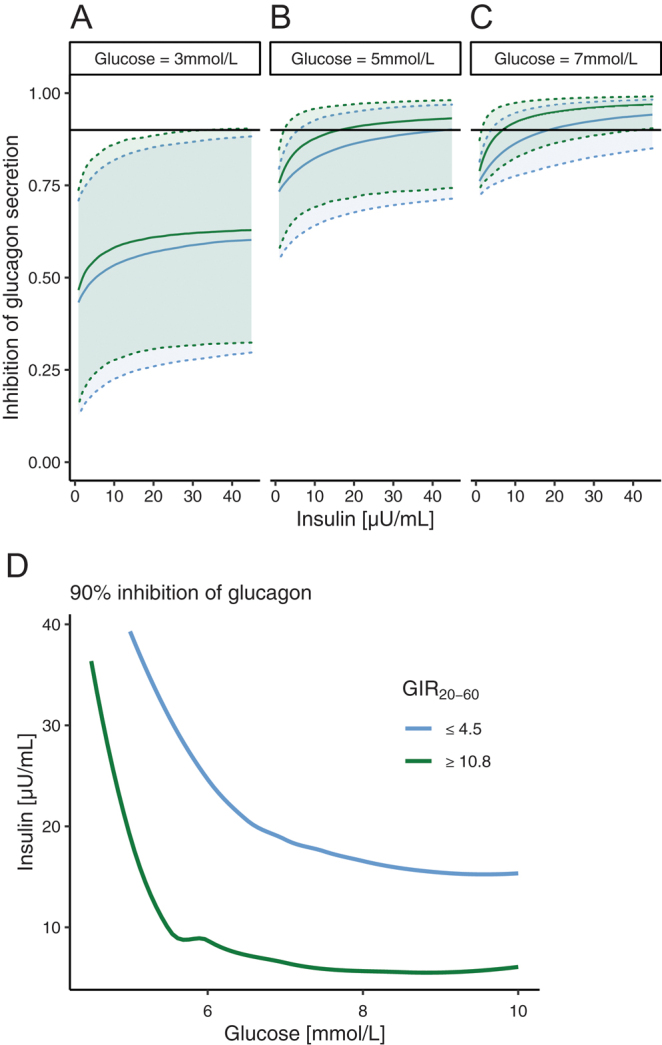
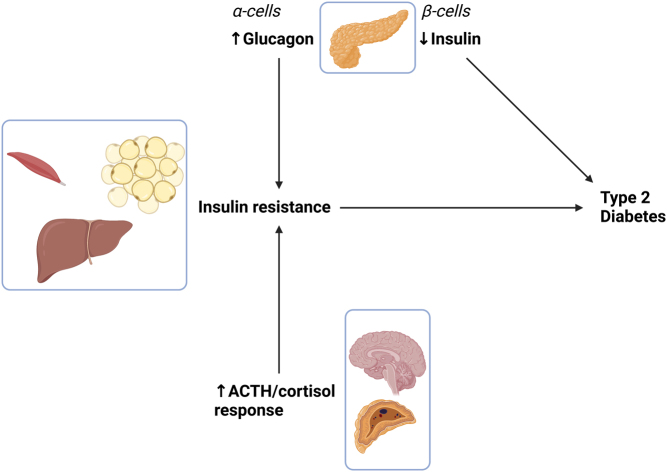
This study aimed to characterize how the dysregulation of counter-regulatory hormones can contribute to insulin resistance and potentially to diabetes. Therefore, we investigated the association between insulin sensitivity and the glucose- and insulin-dependent secretion of glucagon, adrenocorticotropic hormone (ACTH), and cortisol in non-diabetic individuals using a population model analysis. Data, from hyperinsulinemic-hypoglycemic clamps, were pooled for analysis, including 52 individuals with a wide range of insulin resistance (reflected by glucose infusion rate 20-60 min; GIR20-60min). Glucagon secretion was suppressed by glucose and, to a lesser extent, insulin. The GIR20-60min and BMI were identified as predictors of the insulin effect on glucagon. At normoglycemia (5 mmol/L), a 90% suppression of glucagon was achieved at insulin concentrations of 16.3 and 43.4 µU/mL in individuals belonging to the highest and lowest quantiles of insulin sensitivity, respectively. Insulin resistance of glucagon secretion explained the elevated fasting glucagon for individuals with a low GIR20-60min. ACTH secretion was suppressed by glucose and not affected by insulin. The GIR20-60min was superior to other measures as a predictor of glucose-dependent ACTH secretion, with 90% suppression of ACTH secretion by glucose at 3.1 and 3.5 mmol/L for insulin-sensitive and insulin-resistant individuals, respectively. This difference may appear small but shifts the suppression range into normoglycemia for individuals with insulin resistance, thus, leading to earlier and greater ACTH/cortisol response when the glucose falls. Based on modeling of pooled glucose-clamp data, insulin resistance was associated with generally elevated glucagon and a potentiated cortisol-axis response to hypoglycemia, and over time both hormonal pathways may therefore contribute to dysglycemia and possibly type 2 diabetes.
Keywords: metabolism; obesity.
Conflict of interest statement
The authors declare no conflicts of interest in relation to the present work. RAE is a full-time employee of Olink Proteomics AB.
Figures
Similar articles
-
Regulation of the Cortisol Axis, Glucagon, and Growth Hormone by Glucose Is Altered in Prediabetes and Type 2 Diabetes.J Clin Endocrinol Metab. 2024 Jan 18;109(2):e675-e688. doi: 10.1210/clinem/dgad549. J Clin Endocrinol Metab. 2024. PMID: 37708362 Free PMC article.
-
Altered hormonal and autonomic nerve responses to hypo- and hyperglycaemia are found in overweight and insulin-resistant individuals and may contribute to the development of type 2 diabetes.Diabetologia. 2021 Mar;64(3):641-655. doi: 10.1007/s00125-020-05332-z. Epub 2020 Nov 26. Diabetologia. 2021. PMID: 33241460 Free PMC article.
-
Effects of glucagon-like peptide 1 on counterregulatory hormone responses, cognitive functions, and insulin secretion during hyperinsulinemic, stepped hypoglycemic clamp experiments in healthy volunteers.J Clin Endocrinol Metab. 2002 Mar;87(3):1239-46. doi: 10.1210/jcem.87.3.8355. J Clin Endocrinol Metab. 2002. PMID: 11889194 Clinical Trial.
-
Inhibition of glucagon secretion.Adv Pharmacol. 2005;52:151-71. doi: 10.1016/S1054-3589(05)52008-8. Adv Pharmacol. 2005. PMID: 16492545 Review.
-
On the role of the gut in diabetic hyperglucagonaemia.Dan Med J. 2017 Apr;64(4):B5340. Dan Med J. 2017. PMID: 28385175 Review.
Cited by
-
Glucose-dependent inflammatory responses in obese compared to lean individuals.Endocrine. 2023 Sep;81(3):464-476. doi: 10.1007/s12020-023-03433-4. Epub 2023 Jul 3. Endocrine. 2023. PMID: 37400734 Free PMC article.
-
Diabetes Mellitus in Pancreatic Cancer: A Distinct Approach to Older Subjects with New-Onset Diabetes Mellitus.Cancers (Basel). 2023 Jul 19;15(14):3669. doi: 10.3390/cancers15143669. Cancers (Basel). 2023. PMID: 37509329 Free PMC article. Review.
-
Regulation of the Cortisol Axis, Glucagon, and Growth Hormone by Glucose Is Altered in Prediabetes and Type 2 Diabetes.J Clin Endocrinol Metab. 2024 Jan 18;109(2):e675-e688. doi: 10.1210/clinem/dgad549. J Clin Endocrinol Metab. 2024. PMID: 37708362 Free PMC article.
References
-
- Svensson AM, Eliasson B, Linder E, Almskog I, Eeg-Olofsson K, Miftaraj M, Guðbjörnsdóttir S, Franzén S, Hermansson-Carter V. The Swedish national diabetes register (NDR) - nationwide results 1996–2020. Swedish National Diabetes Register 2021. 16473344. (10.18158/RYNUNVPIU) - DOI
LinkOut - more resources
Full Text Sources
