. 2023 Feb 10;9(6):eade9238.
doi: 10.1126/sciadv.ade9238. Epub 2023 Feb 8.

Single-cell profiling of alveolar rhabdomyosarcoma reveals RAS pathway inhibitors as cell-fate hijackers with therapeutic relevance

Affiliations

Single-cell profiling of alveolar rhabdomyosarcoma reveals RAS pathway inhibitors as cell-fate hijackers with therapeutic relevance

Sara G Danielli et al. Sci Adv. .

Abstract

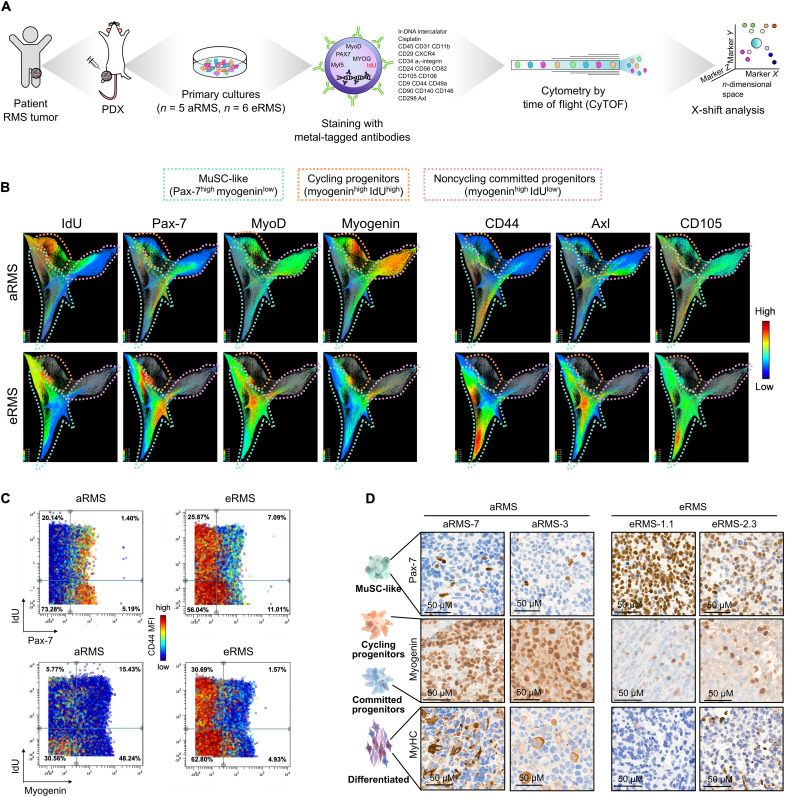
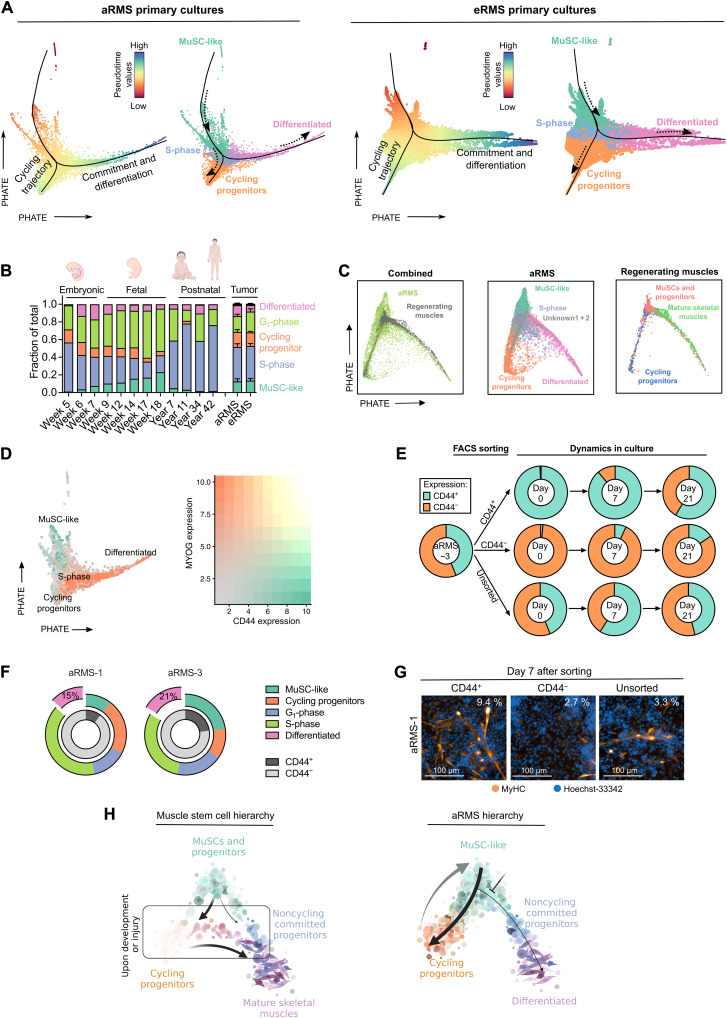
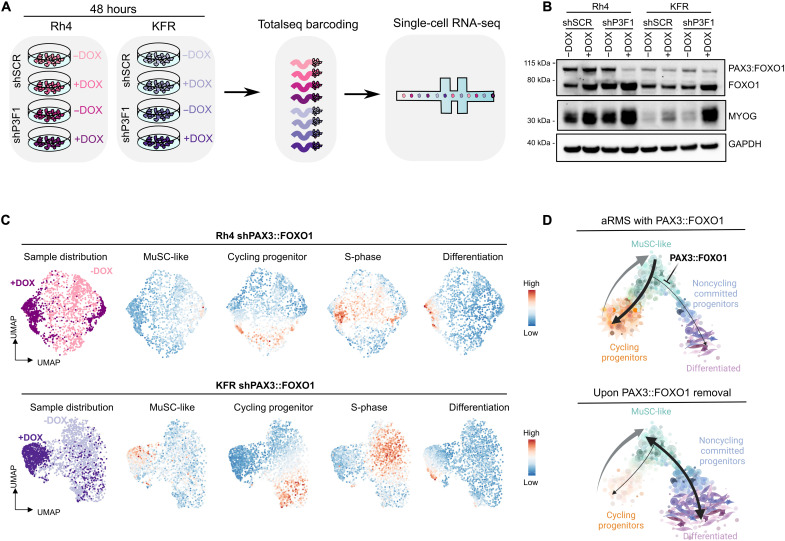
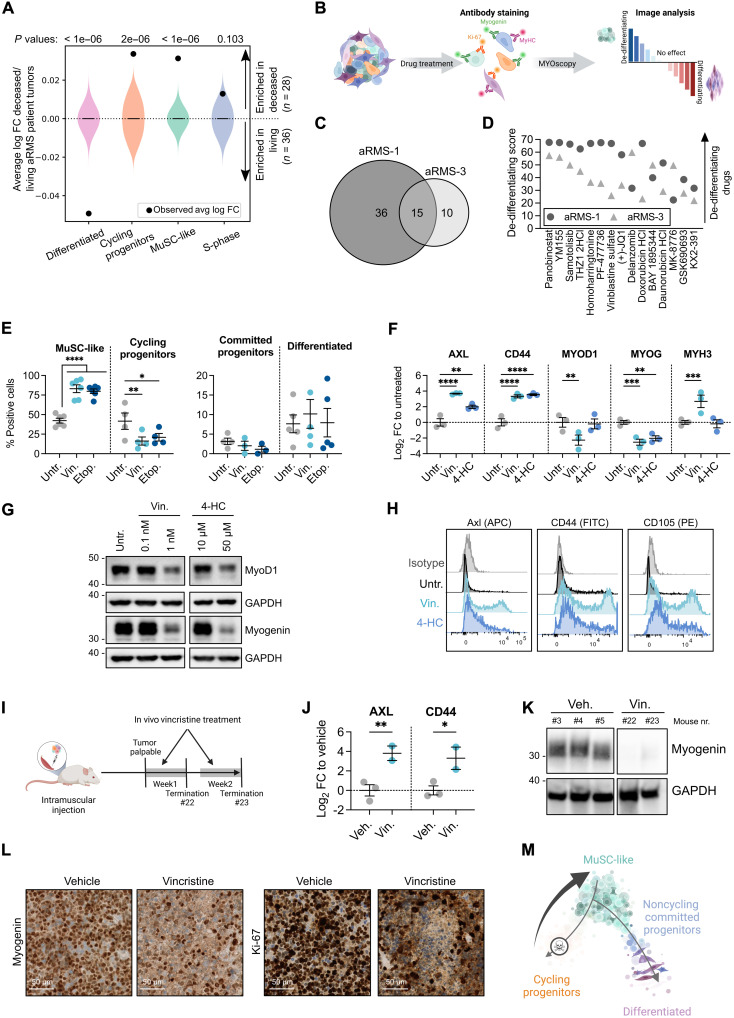
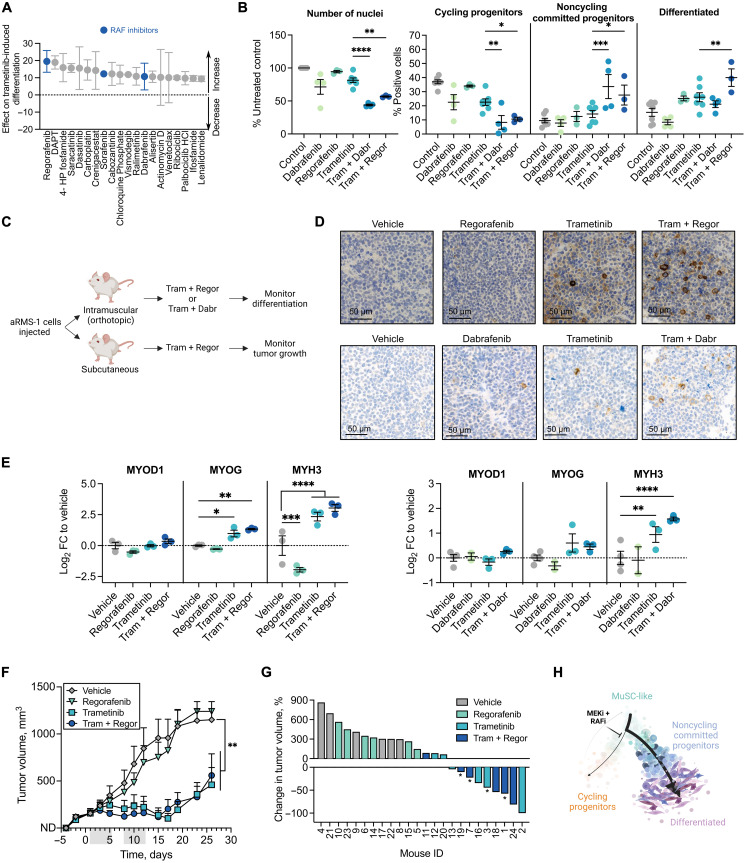
Rhabdomyosarcoma (RMS) is a group of pediatric cancers with features of developing skeletal muscle. The cellular hierarchy and mechanisms leading to developmental arrest remain elusive. Here, we combined single-cell RNA sequencing, mass cytometry, and high-content imaging to resolve intratumoral heterogeneity of patient-derived primary RMS cultures. We show that the aggressive alveolar RMS (aRMS) subtype contains plastic muscle stem-like cells and cycling progenitors that drive tumor growth, and a subpopulation of differentiated cells that lost its proliferative potential and correlates with better outcomes. While chemotherapy eliminates cycling progenitors, it enriches aRMS for muscle stem-like cells. We screened for drugs hijacking aRMS toward clinically favorable subpopulations and identified a combination of RAF and MEK inhibitors that potently induces myogenic differentiation and inhibits tumor growth. Overall, our work provides insights into the developmental states underlying aRMS aggressiveness, chemoresistance, and progression and identifies the RAS pathway as a promising therapeutic target.


Figures

Fig. 1.
Fig. 1.. scRNAseq of RMS identifies heterogeneity recapitulating muscle developmental programs.
(A) Experimental workflow. (B) UMAP plot of 48,859 RMS cells after regressing the number of count RNA, the percentage of mitochondrial genes, and the run batch effect. Cells are color-coded based on the corresponding sample of origin. (C) UMAP plot of 48,859 RMS cells after integration. Populations identified by Louvain clustering are shown. (D) Dot plot showing expression of lineage-specific marker genes across the different Louvain clusters in aRMS and eRMS samples. (E) Model of skeletal myogenesis with the populations identified in RMS. UMAP plots are colored on the basis of the expression of markers delineating a myogenic lineage progression. (F) UMAP plot of RMS cells after integration and color-coded based on the sample of origin. (G) Relative proportion of Louvain clusters. Data are represented as means ± SEM; ordinary two-way analysis of variance (ANOVA) with uncorrected Fisher’s least significant difference (LSD). *P < 0.05; **P < 0.01; ****P ≤ 0.0001. (H and I) Comparison of intratumoral heterogeneity between preclinical models of aRMS. O-PDXs and patient tumor data are derived from (36). UMAP plots of individual models (H) and of the integrated datasets (I) are shown. (J) Relative proportion of Louvain clusters across different aRMS preclinical models and patient tumors. Data are represented as means ± SEM of n = 6 patient tumors, n = 5 O-PDXs, n = 5 primary cultures, and n = 3 cell lines.
Fig. 2.
Fig. 2.. CyTOF defines RMS subpopulations with high resolution.
(A) Mass cytometry workflow. (B) Integrated CyTOF dataset from RMS primary cultures clustered with the X-shift algorithm and visualized using single-cell force-directed layout. (C) Biaxial dot plots of Pax-7 or myogenin by IdU across aRMS and eRMS primary cultures. Plots are colored by CD44 expression. (D) Expression of Pax-7, myogenin, and MyHC markers as determined by immunohistochemistry in PDX tumors.
Fig. 3.
Fig. 3.. RMS primary cultures recapitulate a branched myogenic trajectory.
(A) PHATE dimensionality reduction (t = 30, knn = 20) plots of aRMS (left) or eRMS (right) primary cultures. Black lines represent pseudotime trajectories calculated using Slingshot (starting cluster: MuSC-like); dashed arrows represent the trajectory direction. Cells are colored on the basis of pseudotime values calculated by Slingshot (left) or on the identified Louvain clusters (right). (B) Clustering distribution of the integrated RMS/human developing skeletal muscle (42) dataset across developmental time points or RMS subtype. (C) PHATE dimensionality reduction (t = 30, knn = 20) plot of the integrated aRMS primary culture/mouse regenerating skeletal muscle (32) dataset. aRMS cells are color-coded on the basis of Louvain clusters; muscle cells are colored on the basis of the clusters identified in the original publication. (D) PHATE dimensionality reduction (t = 30, knn = 20) plot of aRMS primary cultures colored on the basis of CD44 (green) or MYOG (orange) expression (left plot). The two markers are mutually exclusive (right plot). (E) Flow cytometry analysis of sorted CD44+ and CD44 subpopulations in aRMS-3 cells. Unsorted reference is also shown. Data are represented as means of n ≥ 2 biological replicates. (F) Relative proportion of Louvain clusters across aRMS-1 and aRMS-3 cells before sorting. The percentage of differentiated cells in the CD44 subpopulation is shown. (G) Immunofluorescence analysis of MyHC expression 7 days after sorting of CD44+ and CD44 subpopulations in aRMS-1 cells. The percentage of MyHC+ cells is indicated on the top right of each panel. (H) Proposed model of aRMS hierarchical structure compared to developing or regenerating MuSCs.
Fig. 4.
Fig. 4.. PAX3::FOXO1 down-regulation leads to MuSC-like and differentiated subpopulations.
(A) Schematic workflow. (B) Representative WB of Rh4 and KFR cells cultured with (+DOX) or without (−DOX) DOX for 48 hours. (C) UMAP plot of 1978 Rh4 and 2589 KFR cells following KD of PAX3::FOXO1. Lines with shP3F1 were cultured with DOX for 48 hours (+DOX) to induce protein down-regulation and profiled by scRNAseq. Control lines that were not exposed to DOX are also shown (−DOX). UMAP plots are colored by DOX exposure (left) or the overall expression (color scale) of the identified signatures (right). (D) Proposed model of PAX3::FOXO1 heterogeneity across aRMS cell lines. Upon PAX3::FOXO1 removal, the differentiation block is released and the oncogenic loop is disrupted. The cycling progenitor subpopulation disappears, and the remaining cells display MuSC-like or differentiated features.
Fig. 5.
Fig. 5.. Chemotherapy induces a transition toward MuSC-like states in aRMS.
(A) Association between cluster-associated signatures and aRMS patient outcome. Violin plots show log fold change distributions between deceased and living patients assuming no association (107 simulation replicates). Black dots represent the calculated associations. (B) Experimental workflow. (C) Number of dedifferentiating drug hits at 1 μM. (D) Shared dedifferentiating drugs at 1 μM ranked on the basis of the average dedifferentiating score. A score of zero represents the baseline score of untreated controls. (E) Immunofluorescence quantification of aRMS-1 cells exposed to 10 nM vincristine or 1 μM etoposide for 72 hours; ordinary two-way ANOVA with uncorrected Fisher’s LSD. (F) qRT-PCR data generated with aRMS-1 cells exposed to 10 nM vincristine sulfate or 50 μM 4-HC for 48 hours; ordinary two-way ANOVA with uncorrected Fisher’s LSD. (G) WB images of aRMS-1 cells exposed to vincristine or 4-HC for 48 hours. GAPDH was used as loading control; samples were loaded on the same gel. (H) Representative FACS plots of aRMS-1 cells treated with 1 nM vincristine or 10 μM 4-HC for 48 hours. (I) Experimental workflow. (J) qRT-PCR data generated with aRMS-1 tumors collected after in vivo treatment with vincristine (10 mg/kg); ordinary two-way ANOVA with uncorrected Fisher’s LSD. (K) WB images of aRMS-1 PDX tumors treated in vivo with vincristine. Samples were loaded on the same gel. (L) Expression of myogenin and Ki-67 as determined by immunohistochemistry in aRMS-1 PDX tumors following in vivo treatment with vincristine or vehicle. (M) Proposed model of treatment selection following chemotherapy in aRMS. *P < 0.05; **P < 0.01; ***P < 0.001; ****P ≤ 0.0001. Data are represented as means ± SEM of the indicated number of biological replicates. Untr., untreated; Vin, vincristine sulfate; 4-HC, 4-hydroperoxycyclophosphamide; Veh, vehicle; FC, fold change.
Fig. 6.
Fig. 6.. Image-based high-content drug screening identifies the MEK inhibitor trametinib as a potent inducer of myogenic differentiation in aRMS primary cultures.
(A) Number of drug hits promoting differentiation in aRMS-1 and aRMS-3 at 1 μM. (B) Shared differentiating drugs at 1 μM ranked on the basis of the average differentiating score across aRMS-1 and aRMS-3 cells. (C) Representative images of aRMS-1 cells following 72 hours of drug treatment at 1 μM. (D) Percentage of differentiated (MyHC+) cells following treatment with 100 nM trametinib for 72 hours. Data are represented as means ± SEM of the indicated number of biological replicates. A threshold of 10% was used to separate responders from nonresponders. (E) Representative images of aRMS-1 cells following 72 hours of drug treatment with trametinib in the presence (+GFs) or absence (−GFs) of the growth factors bFGF and EGF. (F) WBs of aRMS primary cultures and cell lines exposed to 50 nM trametinib for 96 hours. (G) qRT-PCR data of aRMS-1 and aRMS-3 cells exposed to 50 nM trametinib for 96 hours. Data are represented as means ± SEM of n ≥ 2 biological replicates; multiple unpaired t tests. (H) WB analysis of phosphorylated ERK in aRMS-1 cells after exposure to trametinib for 3 hours. (I) Proliferation curve of aRMS-1 cells exposed to trametinib for 4 days (gray bar) and cultivated in drug-free medium for further 5 days, as determined by cell counting; ordinary two-way ANOVA with Dunnett’s correction. (J) Colony-forming ability of aRMS-1 cells exposed to trametinib for 4 days and seeded at the indicated cell densities in duplicates in drug-free medium for 10 days. (K) Representative cell cycle analysis plot of aRMS-1 cells exposed to 25 nM trametinib for 96 hours and stained with propidium iodide. *P < 0.05; **P < 0.01; ***P < 0.001.
Fig. 7.
Fig. 7.. Vertical inhibition of the RAF-MEK-ERK cascade potentiates trametinib-induced differentiation and inhibits aRMS tumor growth.
(A) Top 20 trametinib-potentiating drugs ranked on the basis of their effect on trametinib-induced differentiation. A score of zero represents the baseline score of trametinib alone; drugs with a positive score potentiate trametinib-induced differentiation. n = 2 biological replicates. (B) Quantification of immunofluorescence analysis of aRMS-1 cells exposed to vehicle controls, 10 μM dabrafenib (Dabr), 1 μM regorafenib (Regor), 10 nM trametinib (Tram), or the indicated combinations for 72 hours; ordinary two-way ANOVA with uncorrected Fisher’s LSD. (C) Schematic of in vivo validation experiment. (D) Expression of MyHC as determined by immunohistochemistry in aRMS-1 PDX tumors following in vivo treatment with trametinib (5 mg/kg), regorafenib (15 mg/kg), or their combination (top row) or with trametinib (1 mg/kg), dabrafenib (15 mg/kg), or their combination (bottom row). (E) qRT-PCR analysis of aRMS-1 PDX tumors; ordinary two-way ANOVA with uncorrected Fisher’s LSD. (F) Monitoring of tumor growth in mice that were injected with aRMS-1 cells and treated with vehicle, trametinib (5 mg/kg), regorafenib (15 mg/kg), or their combination for two cycles (gray bars); ordinary two-way ANOVA with Dunnett’s multiple comparison correction. (G) Waterfall plot showing the change in tumor volume in mice treated with vehicle, trametinib (5 mg/kg), regorafenib (15 mg/kg), or their combination, at the end of the treatment period (day 12). Mice marked with “*” had to be euthanized before the treatment end point due to toxicity. (H) Proposed model of trajectory rewiring in aRMS following treatment with the MEK inhibitor (MEKi) trametinib in combination with the RAF inhibitor (RAFi) regorafenib or dabrafenib. *P < 0.05; **P < 0.01; ***P < 0.001; ****P ≤ 0.0001. Data points are represented as means ± SEM of the indicated number of biological replicates.

References

    1. T. H. H. Coorens, S. Behjati, Tracing and targeting the origins of childhood cancer. Annu. Rev. Cancer Biol. 6, 35–47 (2022).
    1. M. Filbin, M. Monje, Developmental origins and emerging therapeutic opportunities for childhood cancer. Nat. Med. 25, 367–376 (2019). - PMC - PubMed
    1. R. L. Siegel, K. D. Miller, A. Jemal, Cancer statistics, 2020. CA Cancer J. Clin. 70, 7–30 (2020). - PubMed
    1. D. Hanahan, Hallmarks of cancer: New dimensions. Cancer Discov. 12, 31–46 (2022). - PubMed
    1. S. Jessa, A. Blanchet-Cohen, B. Krug, M. Vladoiu, M. Coutelier, D. Faury, B. Poreau, N. De Jay, S. Hébert, J. Monlong, W. T. Farmer, L. K. Donovan, Y. Hu, M. K. McConechy, F. M. G. Cavalli, L. G. Mikael, B. Ellezam, M. Richer, A. Allaire, A. G. Weil, J. Atkinson, J.-P. Farmer, R. W. R. Dudley, V. Larouche, L. Crevier, S. Albrecht, M. G. Filbin, H. Sartelet, P.-E. Lutz, C. Nagy, G. Turecki, S. Costantino, P. B. Dirks, K. K. Murai, G. Bourque, J. Ragoussis, L. Garzia, M. D. Taylor, N. Jabado, C. L. Kleinman, Stalled developmental programs at the root of pediatric brain tumors. Nat. Genet. 51, 1702–1713 (2019). - PMC - PubMed

MeSH terms

Substances

LinkOut - more resources