. 2023 Feb 10;9(6):eade5584.
doi: 10.1126/sciadv.ade5584. Epub 2023 Feb 8.

Metabolite asymmetric dimethylarginine (ADMA) functions as a destabilization enhancer of SOX9 mediated by DDAH1 in osteoarthritis

Affiliations

Metabolite asymmetric dimethylarginine (ADMA) functions as a destabilization enhancer of SOX9 mediated by DDAH1 in osteoarthritis

Yizheng Wu et al. Sci Adv. .

Abstract

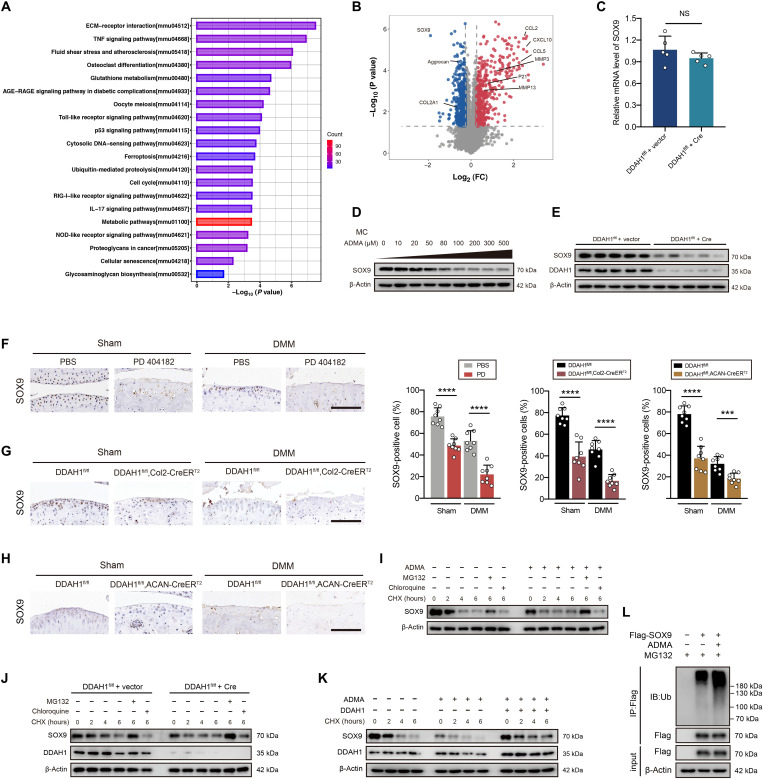
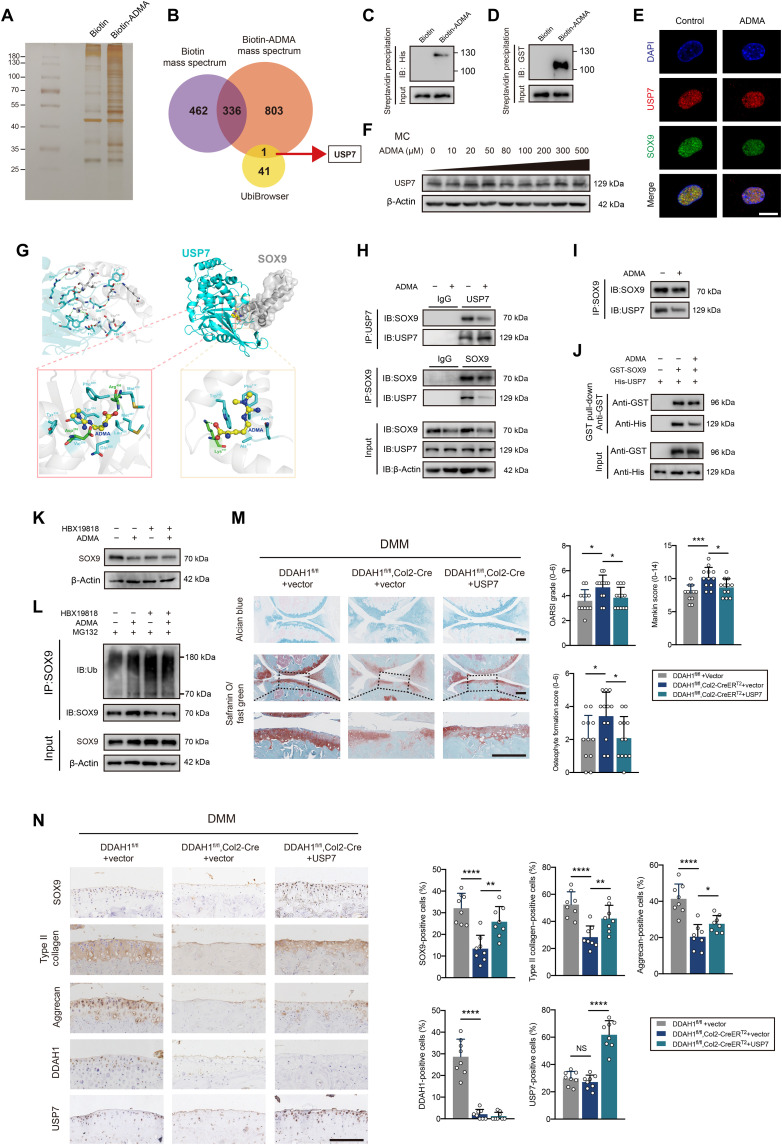
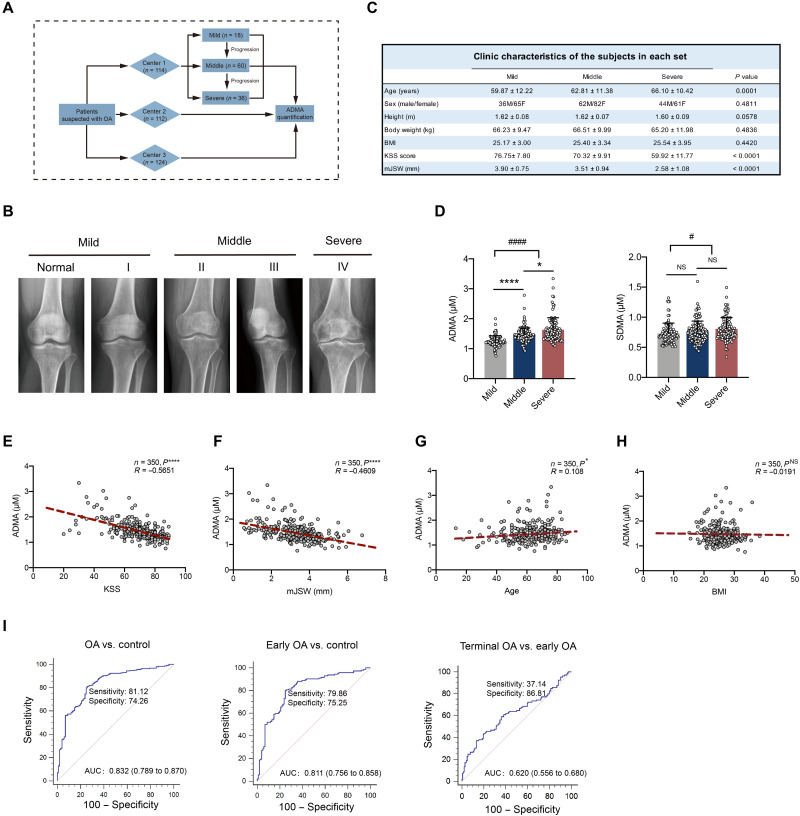
Osteoarthritis (OA) is a degenerative disease with a series of metabolic changes accompanied by many altered enzymes. Here, we report that the down-regulated dimethylarginine dimethylaminohydrolase-1 (DDAH1) is accompanied by increased asymmetric dimethylarginine (ADMA) in degenerated chondrocytes and in OA samples. Global or chondrocyte-conditional knockout of ADMA hydrolase DDAH1 accelerated OA development in mice. ADMA induces the degeneration and senescence of chondrocytes and reduces the extracellular matrix deposition, thereby accelerating OA progression. ADMA simultaneously binds to SOX9 and its deubiquitinating enzyme USP7, blocking the deubiquitination effects of USP7 on SOX9 and therefore leads to SOX9 degradation. The ADMA level in synovial fluids of patients with OA is increased and has predictive value for OA diagnosis with good sensitivity and specificity. Therefore, activating DDAH1 to reduce ADMA level might be a potential therapeutic strategy for OA treatment.


Figures

Fig. 1.
Fig. 1.. Asymmetric dimethylarginine (ADMA) up-regulated by DDAH1 accelerates OA.
(A) Metabolomics between chondrocytes from patients with OA and controls. Cells harvested from cartilages were cultured for 3 days in identical conditions. (B) The ADMA level and its isomer SDMA in chondrocytes from patients with OA and controls evaluated by liquid chromatography–mass spectrometry (LC-MS) analysis and bicinchoninic acid (BCA) protein quantification assay. (C and D) The ADMA level of PD 404182–treated or DDAH1−/− mouse chondrocytes evaluated by LC-MS analysis and BCA protein quantification assay. (E) Micromass culture and quantification of DDAH1−/− or DDAH1+/+ primary chondrocytes. n = 6 per group. Scale bar, 3 mm. (F) 3D agarose culture of DDAH1−/− or DDAH1+/+ primary chondrocytes (alcian blue staining) showing the thickness of the pericellular matrix. n = 6 per group. Scale bar, 20 μm. (G) The safranin O/fast green staining and alcian blue staining of knee joints of DDAH1 global knockout mice that underwent destabilization of the medial meniscus (DMM) surgery or sham. n = 12 per group. Scale bar, 100 μm. (H) Immunoblot detection of type II collagen, aggrecan, and DDAH1 in cartilage of mice indicated above. n = 8 per group. Scale bar, 100 μm; *P < 0.05, **P < 0.01, ***P < 0.001, ****P < 0.0001, (B) to (H), means ± SD, unpaired two-tailed t test; NS, not significant.
Fig. 2.
Fig. 2.. Cartilage-specific knockout of DDAH1 accelerates OA progression.
(A) The mRNA expression level of COL2A1, ACAN, MMP3, MMP13, ADAMTS4, and ADAMTS5 in DDAH1fl/fl mouse chondrocytes infected with Cre or vector adenovirus. (B) Immunoblot detection of aggrecan, COL2A1, and DDAH1 in DDAH1fl/fl mouse chondrocytes. Cre or vector adenovirus was added into chondrocytes 48 hours before harvesting. (C) The safranin O/fast green staining and alcian blue staining of knee joints of DDAH1fl/fl and DDAH1fl/fl, Col2-CreERT2 mice that underwent DMM surgery or sham. DDAH1fl/fl (sham), n = 15, DDAH1fl/fl; Col2-CreERT2 (sham), n = 12; DDAH1fl/fl (DMM), n = 15; DDAH1fl/fl, Col2-CreERT2 (DMM), n = 14. Scale bar, 100 μm. (D) Immunoblot detection of type II collagen, aggrecan, and DDAH1 in cartilage of DDAH1fl/fl and DDAH1fl/fl, Col2-CreERT2 mice that underwent DMM surgery or sham, n = 8 per group. Scale bar, 100 μm. (E) The micro–computerized tomography images of knee joints from DDAH1fl/fl and DDAH1fl/fl, Col2-CreERT2 mice. Yellow arrows indicate the osteophytes. Scale bar, 1 mm. (F) The Bone volume/Tissue volume (BV/TV), Trabecular Thickness (TB.Th), and Trabecular Separation (TB.Sp) of subchondral bone in the indicated groups above were calculated. DDAH1fl/fl, n = 4; DDAH1fl/fl, Col2-CreERT2, n = 5. (G) The hot plate, rotarod, and open field assays of the mice indicated above. Data are representative of three independent experiments (B). *P < 0.05, **P < 0.01, ***P < 0.001, ****P < 0.0001, means ± SD, unpaired two-tailed t test.
Fig. 3.
Fig. 3.. ADMA induces SOX9 degradation through the ubiquitin-proteasome pathway.
(A and B) KEGG analysis and volcano plots (fold change >1.2 or <0.83, P < 0.05) of the differentially expressed proteins between chondrocytes treated with ADMA or control. (C) The relative mRNA expression of SOX9 in DDAH1fl/fl chondrocytes infected with Cre adenovirus or vector. (D and E) Immunoblot detection of SOX9 or DDAH1 in mouse chondrocytes exposed to ADMA or DDAH1-knockout chondrocytes. (F) Immunoblot detection of SOX9 in cartilage of mice that underwent DMM surgery accompanied by PD 404182 articular injection weekly. n = 8 per group. Scale bar, 100 μm. (G and H) Immunoblot of SOX9 in cartilage of DDAH1fl/fl and DDAH1fl/fl, Col2-CreERT2 or DDAH1fl/fl, ACAN-CreERT2 mice that underwent DMM surgery or sham. n = 8 per group. Scale bar, 100 μm. (I and J) Immunoblot of SOX9 or DDAH1 in mouse chondrocytes exposed to ADMA or with DDAH1 knockout. Where indicated, cells were pretreated with either MG132 or chloroquine 30 min before cycloheximide (CHX) treatment at indicated times. (K) Immunoblot of SOX9 and DDAH1 in mouse chondrocytes. Cells were treated with ADMA, DDAH1 lentivirus (or vector), and CHX at the indicated times. (L) Immunoblot detection of ubiquitinated species of Flag in 293T cells via Flag immunoprecipitation. Cells were transfected with Flag-SOX9 and treated with ADMA for 24 hours and MG132 for 6 hours before harvesting. Data are representative of three independent experiments (D, E, and I to L). ***P < 0.001, ****P < 0.0001, means ± SD, unpaired two-tailed t test.
Fig. 4.
Fig. 4.. ADMA blocks the interaction between SOX9 and USP7.
(A) Silver staining of proteins interacting with biotin-ADMA. (B) Venn diagram showing the overlaps between biotin-ADMA specifically conjugated proteins and SOX9-related E3 ubiquitin or de-ubiquitinating enzymes predicted by UbiBrowser. (C and D) Immunoblot of histone and glutathione S-transferase (GST). Biotin-ADMA or biotin was incubated with His-USP7 or GST-SOX9 recombinant protein and precipitated by streptavidin magnetic beads. (E) Confocal microscopy demonstrating the colocalization of USP7, SOX9, and 4′,6-diamidino-2-phenylindole (DAPI). Scale bar, 10 μm. (F) Immunoblot of USP7 in chondrocytes exposed to ADMA. (G) Molecular docking predicting the interaction between ADMA, USP7, and SOX9. (H and I) Co-immunoprecipitation of SOX9 and USP7 in mouse chondrocytes exposed to ADMA in normal state or after adjusting the SOX9 protein. (J) GST pull-down showing the interaction between GST-SOX9 and His-USP7 recombinant protein under ADMA or not. (K) Immunoblot of SOX9 in chondrocytes treated with ADMA and HBX19818. (L) Immunoblot of ubiquitinated SOX9 in chondrocytes treated with ADMA, HBX19818, and MG132. (M) The safranin O/fast green and alcian blue staining of joints from DDAH1fl/fl and DDAH1fl/fl, Col2-CreERT2 mice that underwent DMM surgery accompanied by USP7 AAV or vector injection. n = 12 per group. Scale bar, 100 μm. (N) Immunohistochemistry of SOX9, type II collagen, aggrecan, DDAH1, and USP7 of the indicated group. n = 8 per group. Scale bar, 100 μm. Data are representative of three independent experiments (A, C to F, and H to L). *P < 0.05, **P < 0.01, ***P < 0.001, ****P < 0.0001, means ± SD, unpaired two-tailed t test.
Fig. 5.
Fig. 5.. ADMA in synovial fluids is predictive for OA diagnosis.
(A) Schematic diagram demonstrating multicenter retrospective analysis for ADMA in synovial fluids of patients with OA. (B) Representative knee radiographs of patients in different OA stages. Patients were divided into five stages according to the tibiofemoral Kellgren-Lawrence (KL) score. Mild OA includes normal and stage I, and middle OA includes stages II and III with stage IV defined as severe OA. (C) Clinical data of patients including age, sex, height, body weight, BMI, Knee Society Score (clinical, KSS), and minimal medial joint space width (mJSW). (D) The level of ADMA and its isomer SDMA in synovial fluids of patients with mild, middle, and severe OA [*P < 0.05, ****P < 0.0001, nonparametric test (Kruskal-Wallis test) followed by Dunn’s multiple comparisons test; #P < 0.05, ####P < 0.0001, unpaired two-tailed t test for comparison between mild and middle + severe]. (E to H) Pearson correlation analysis between ADMA level in synovial fluids and KSS, mJSW of patients with OA, age, and BMI (*P < 0.05, ****P < 0.0001, Pearson analysis). (I) Receiver operating characteristic (ROC) curve for ADMA discriminating control and OA, control and early OA, early OA and terminal OA. Control, early OA, and terminal OA represent patients with mild OA, middle OA, and severe OA, respectively, according to the KL grades. AUC, area under the ROC curve.

References

    1. T. Neogi, The epidemiology and impact of pain in osteoarthritis. Osteoarthr. Cartil. 21, 1145–1153 (2013). - PMC - PubMed
    1. M. Kapoor, J. Martel-Pelletier, D. Lajeunesse, J. P. Pelletier, H. Fahmi, Role of proinflammatory cytokines in the pathophysiology of osteoarthritis. Nat. Rev. Rheumatol. 7, 33–42 (2011). - PubMed
    1. C. Corciulo, M. Lendhey, T. Wilder, H. Schoen, A. S. Cornelissen, G. Chang, O. D. Kennedy, B. N. Cronstein, Endogenous adenosine maintains cartilage homeostasis and exogenous adenosine inhibits osteoarthritis progression. Nat. Commun. 8, 15019 (2017). - PMC - PubMed
    1. S. Farnaghi, I. Prasadam, G. Cai, T. Friis, Z. Du, R. Crawford, X. Mao, Y. Xiao, Protective effects of mitochondria-targeted antioxidants and statins on cholesterol-induced osteoarthritis. FASEB J. 31, 356–367 (2017). - PubMed
    1. W. S. Choi, G. Lee, W. H. Song, J. T. Koh, J. Yang, J. S. Kwak, H. E. Kim, S. K. Kim, Y. O. Son, H. Nam, I. Jin, Z. Y. Park, J. Kim, I. Y. Park, J. I. Hong, H. A. Kim, C. H. Chun, J. H. Ryu, J. S. Chun, The CH25H-CYP7B1-RORα axis of cholesterol metabolism regulates osteoarthritis. Nature 566, 254–258 (2019). - PubMed