. 2023 Feb 10;9(6):eade8829.
doi: 10.1126/sciadv.ade8829. Epub 2023 Feb 8.

Spinal cord tissue engineering via covalent interaction between biomaterials and cells

Affiliations

Spinal cord tissue engineering via covalent interaction between biomaterials and cells

Weiyuan Liu et al. Sci Adv. .

Abstract

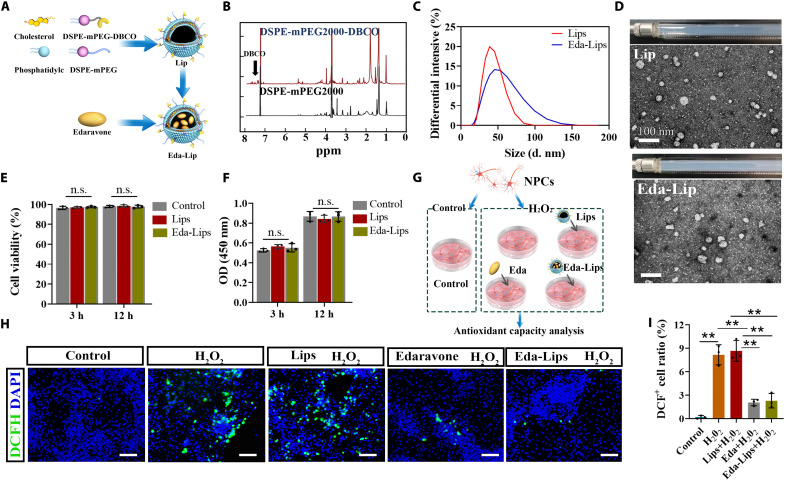
Noncovalent interactions between cells and environmental cues have been recognized as fundamental physiological interactions that regulate cell behavior. However, the effects of the covalent interactions between cells and biomaterials on cell behavior have not been examined. Here, we demonstrate a combined strategy based on covalent conjugation between biomaterials (collagen fibers/lipid nanoparticles) and various cells (exogenous neural progenitor cells/astrocytes/endogenous tissue-resident cells) to promote neural regeneration after spinal cord injury (SCI). We found that metabolic azido-labeled human neural progenitor cells conjugated on dibenzocyclooctyne-modified collagen fibers significantly promoted cell adhesion, spreading, and differentiation compared with noncovalent adhesion. In addition, dibenzocyclooctyne-modified lipid nanoparticles containing edaravone, a well-known ROS scavenger, could target azide-labeled spinal cord tissues or transplanted azide-modified astrocytes to improve the SCI microenvironment. The combined application of these covalent conjugation strategies in a rat SCI model boosted neural regeneration, suggesting that the covalent interactions between cells and biomaterials have great potential for tissue regeneration.


Figures

Fig. 1.
Fig. 1.. Schematic illustration of covalent interactions between cell and biomaterials regulating cell behavior and drug targeting for boosting neural regeneration in SCI.
(A) CC between donor NPCs and scaffolds. (B) Implantation of NCCL and covalent recognition between Eda-Lips and endogenous N3-modified SC cells. (C) Implantation of NCCL and covalent recognition between Eda-Lips and exogenous N3-modified astrocytes.
Fig. 2.
Fig. 2.. Preparation and characterization of DBCO-LACF and N3-modified NPCs.
(A) Schematic illustration of preparation of DBCO-LACF using NHS-Sulfo-DBCO. (B) 1H-NMR spectrum of LACF and DBCO-LACF. (C) UV-vis spectra of DBCO-LACF prepared with different doses of NHS-Sulfo-DBCO. (D) Quantification of DBCO group of DBCO-LACF prepared with different doses of NHS-Sulfo-DBCO based on the absorbance value at 310 nm of UV-vis spectra. (E) Confocal microscopy image of DBCO-LACF incubated with azide-Cy3. (F) SEM image of DBCO-LACF and LACF. Scale bar, 100 μm. (G) Representative stress-strain curves of DBCO-LACF and LACF. (H) Young’s modulus values for LACF and LACF-DBCO (n = 3 independent samples, two-tailed t test). (I) Schematic illustration of N3 modification on NPCs using Ac4ManNAz. (J) Immunofluorescence images of Nestin and Sox2 in NPCs. Scale bar, 100 μm. (K) DBCO-Cy3 staining of NPCs treated with various concentrations of Ac4ManNAz. Scale bar, 50 μm. (L) Quantitative analysis of the Cy3 fluorescence intensity in (J) [n = 5 biologically independent samples, one-way analysis of variance (ANOVA) and Tukey’s test]. (M) Live/dead staining for NPCs treated with various concentrations of Ac4ManNAz. Scale bar, 50 μm. (N) Quantitative analysis of NPC viability in (L) (n = 4 biologically independent samples, one-way ANOVA and Tukey’s test). Error bars, means ± SD. , **P < 0.01. A.U., arbitrary units.
Fig. 3.
Fig. 3.. CC between DBCO-LACF and N3-modified NPCs enhanced NPC retention, differentiation, and oriented axon growth of NPCs.
(A) Schematic of evaluating the adhesion and differentiation of CC between NPCs and collagen. (B) FDA staining of NPCs after attaching for 2 or 6 hours by NC or CC interaction. Scale bar, 100 μm. (C) Quantification of attached cell number in (B) (n = 5 biologically independent samples, two-tailed t test). (D) Live/dead staining for NPCs seeded on collagen by CC or NC. Scale bar, 50 μm. (E) Heat map of RNA-seq data illustrating the expression level of differentiation-related genes of CC and NC group after differentiation for 1, 7, and 14 days. The standardized abundance of transcripts is color-coded according to the scale bar. (F) Results of qPCR analyses of Map2, GFAP, DCX, and TNF expression levels of NPCs in CC and NC group (n = 4 biologically independent samples, two-tailed t test). (G) Immunofluorescence images of Map2+ or GFAP+ cells derived from NPCs in the CC and NC groups. Scale bar, 50 μm. (H) Schematic illustration of covalent cell-scaffold conjugation. (I) FDA staining of NPCs in CC or NC group for 1, 5, and 10 days. Scale bars, 250 and 100 μm. (J) 2D FFT image analysis of oriented axon growth of NPCs. (K) SEM images of NPCs attached on scaffold by CC or NC interaction for 10 days. Scale bar, 10 μm. Error bars, means ± SD. **P < 0.01.
Fig. 4.
Fig. 4.. Preparation and characterization of Eda-Lips.
(A) Schematic illustration of preparation of Eda-Lips. (B) 1H-NMR spectrum of DSPE-mPEG200 and DSPE-mPEG200-DBCO. (C) Size distribution of Eda-Lips and Lips determined by DLS. (D) TEM images of Eda-Lips and Lips. Scale bar, 100 nm. (E) Quantitative analysis of NPC viability (n = 3 biologically independent samples, one-way ANOVA and Tukey’s test). (F) Optical density (OD) values at 450 nm of NPCs treated with Eda-Lips and Lips in CCK-8 analysis (n = 3 biologically independent samples, one-way ANOVA and Tukey’s test). (G) Schematic illustration of antioxidant capacity test. (H) Images of green fluorescent signals of DCF for detecting ROS levels in NPCs with various treatments. Scale bar, 50 μm. (I) DCF+ cell ratio in (H) (n = 3 biologically independent samples, one-way ANOVA and Tukey’s test). Error bars, means ± SD. **P < 0.01. n.s., not significant.
Fig. 5.
Fig. 5.. Eda-Lips targeted N3-modified SC.
(A) Western blotting analysis of N3-modified SC at various time points after Ac4ManNAz was injected into surrounding area of SCI sites. N3-modified glycoproteins were biotinylated by incubating tissue lysates with biotin-PEG4-alkyne. (B and C) DBCO-Cy3 staining images of N3-modified and unmodified SC. N3 modification and SCI were performed simultaneously, and then DBCO-Cy3 was injected into the tail vein at 1, 4, 7, and 10 dpi. Twelve hours after injection, the SC tissues were harvested to be sectioned for analyzing the intensity of Cy3. Scale bar, 500 μm. (D) Confocal images of GFAP (for astrocytes), Iba1 (for microglia), APC (for oligodendrocytes), and NeuN (for neurons) staining. Four days after N3 modification, DBCO-Cy3 was injected into the tail vein, and the SC tissues were sectioned for immunofluorescence staining. Scale bar, 50 μm. (E) Proportion of various cell types in Cy3+ cell (n = 4 biologically independent samples). (F) IVIS images of the DiR signal of major organs to show the biodistribution of DBCO-Lips. Scale bar, 2 cm. (G) Quantitative analysis of DiR radiant efficiency in SC (n = 3 biologically independent samples, two-tailed t test). (H and I) Eda-Lips were injected into tail vein of SCI rats with N3-modified SC and unmodified SC for evaluation of anti-apoptotic effect. (H) Western blotting analyses of proapoptotic protein. (I) The content of lipid peroxidation marker MDA in SC (n = 4 biologically independent samples, one-way ANOVA and Tukey’s test). Error bars, means ± SD. *P < 0.05, **P < 0.01.
Fig. 6.
Fig. 6.. Transplantation of covalently conjugated NPCs on LACF (NCCL) and targeting delivery of Eda-Lips to SC promoted neural regeneration after SCI.
(A) Schematic illustration of entire strategy of cell delivery and targeting modulation to SC. (B) Confocal images of GFP staining (for donor NPCs) at 10 dpi. Scale bar, 500 μm. (C) Quantification of GFP+ cell number per section in (B) (n = 5 biologically independent samples, one-way ANOVA and Tukey’s test). (D and E) Confocal images of Tuj-1 and caspase-3 staining in the lesion core at 10 dpi. Scale bar, 50 μm. (F and G) Proportions of Tuj-1+GFP+/GFP+ and caspase-3+GFP+/GFP+ (n = 5 biologically independent samples, one-way ANOVA and Tukey’s test). (H) Confocal images of GFP staining (for donor NPCs) at 60 dpi. Scale bar, 500 μm. (I) Quantification of GFP+ cell numbers per section in (H) (n = 5 biologically independent samples, one-way ANOVA and Tukey’s test). (J and K) Confocal images of NF and Map2 staining in the lesion core at 60 dpi. Scale bar, 50 μm. (L and M) Proportions of NF+GFP+/ GFP+ and Map2+GFP+/ GFP+ (n = 5 biologically independent samples, one-way ANOVA and Tukey’s test). Error bars, means ± SD. *P < 0.05, **P < 0.01.
Fig. 7.
Fig. 7.. DBCO-Lips targeted N3-modified exogenous astrocyte.
(A) Schematic illustration of N3 modification on astrocytes using Ac4ManNAz. (B) Immunofluorescence images of GFAP and S100β of astrocytes. Scale bar, 50 μm. (C) DBCO-Cy3 staining of astrocytes treated with various concentrations of Ac4ManNAz. Scale bar, 50 μm. (D) Quantitative analysis of the Cy3 fluorescence intensity in (C) (n = 5 biologically independent samples, one-way ANOVA and Tukey’s test). (E and F) DBCO-Cy3 staining images of N3-modified and unmodified implants. N3-modified and unmodified astrocytes labeled by PKH67 were seeded on collagen scaffold. After the implantation of collagen scaffold with astrocytes in SCI sites, DBCO-Cy3 was injected into the tail vein at 1, 4, 7, and 10 dpi. Twelve hours after injection, the SC tissues of SCI rats were harvested to be sectioned to analyze the intensity of Cy3. Scale bar, 50 μm. (G) IVIS images of the DiR signal of major organs to show the biodistribution of DBCO-Lips. Scale bar, 2 cm. (H) Quantitative analysis of DiR radiant efficiency of SC (n = 3 biologically independent samples, two-tailed t test). Error bars, means ± SD. *P < 0.05, **P < 0.01.
Fig. 8.
Fig. 8.. Transplantation of Eda-Lips–targeted spinal cord–like tissues (Et-SCT) boosted neural regeneration after SCI.
(A) Schematic of cell delivery and targeting modulation by exogenous astrocytes. (B) SEM image of collagen conduit. Scale bars, 1 and 100 μm. (C) Confocal images of Et-SCT. NPCs and astrocytes were labeled by Dil (red) and PKH67 (green), respectively. Scale bar, 1 mm. (D) Confocal images of GFP staining (for donor NPCs) at 10 dpi. Scale bar, 1 and 50 μm. (E) Quantification of GFP+ cell number per section in (D) (n = 5 biologically independent samples, two-tailed t test). (F) Image of caspase-3 staining in the lesion core at 10 dpi. Scale bar, 50 μm. (G) Proportions of caspase-3+GFP+/GFP+ (n = 5 biologically independent samples, two-tailed t test). (H) Image of Tuj-1 staining in the lesion core at 10 dpi. Scale bar, 50 μm. (I) Proportions of Tuj-1+GFP+/GFP+ (n = 5 biologically independent samples, two-tailed t test). (J) Confocal images of GFP staining at 60 dpi. Scale bar, 1 mm. (K) Quantification of GFP+ cell numbers per section in (J) (n = 5 biologically independent samples, two-tailed t test). (L) Images of Map2 staining in the lesion core at 60 dpi. Scale bar, 50 μm. (M) Proportions of Map2+GFP+/GFP+ (n = 5 biologically independent samples, two-tailed t test). (N) Images of NF staining in the lesion core at 60 dpi. Scale bar, 50 μm. (O) Proportions of NF+GFP+/GFP+ (n = 5 biologically independent samples, two-tailed t test). Error bars, means ± SD. *P < 0.05, **P < 0.01.

References

    1. Z. Alvarez, A. N. Kolberg-Edelbrock, I. R. Sasselli, J. A. Ortega, R. Qiu, Z. Syrgiannis, P. A. Mirau, F. Chen, S. M. Chin, S. Weigand, E. Kiskinis, S. I. Stupp, Bioactive scaffolds with enhanced supramolecular motion promote recovery from spinal cord injury. Science 374, 848–856 (2021). - PMC - PubMed
    1. X. L. Wang, N. Rivera-Bolanos, B. Jiang, G. A. Ameer, Advanced functional biomaterials for stem cell delivery in regenerative engineering and medicine. Adv. Funct. Mater. 29, 1809009 (2019).
    1. B. N. Kharbikar, P. Mohindra, T. A. Desai, Biomaterials to enhance stem cell transplantation. Cell Stem Cell 29, 692–721 (2022). - PMC - PubMed
    1. A. P. Liu, E. A. Appel, P. D. Ashby, B. M. Baker, E. Franco, L. Gu, K. Haynes, N. S. Joshi, A. M. Kloxin, P. H. J. Kouwer, J. Mittal, L. Morsut, V. Noireaux, S. Parekh, R. Schulman, S. K. Y. Tang, M. T. Valentine, S. L. Vega, W. Weber, N. Stephanopoulos, O. Chaudhuri, The living interface between synthetic biology and biomaterial design. Nat. Mater. 21, 390–397 (2022). - PMC - PubMed
    1. J. Koffler, W. Zhu, X. Qu, O. Platoshyn, J. N. Dulin, J. Brock, L. Graham, P. Lu, J. Sakamoto, M. Marsala, S. Chen, M. H. Tuszynski, Biomimetic 3D-printed scaffolds for spinal cord injury repair. Nat. Med. 25, 263–269 (2019). - PMC - PubMed