. 2023 Feb 8;15(682):eadc9653.
doi: 10.1126/scitranslmed.adc9653. Epub 2023 Feb 8.

Hepatocytes demarcated by EphB2 contribute to the progression of nonalcoholic steatohepatitis

Affiliations

Hepatocytes demarcated by EphB2 contribute to the progression of nonalcoholic steatohepatitis

Yang Xiao et al. Sci Transl Med. .

Abstract

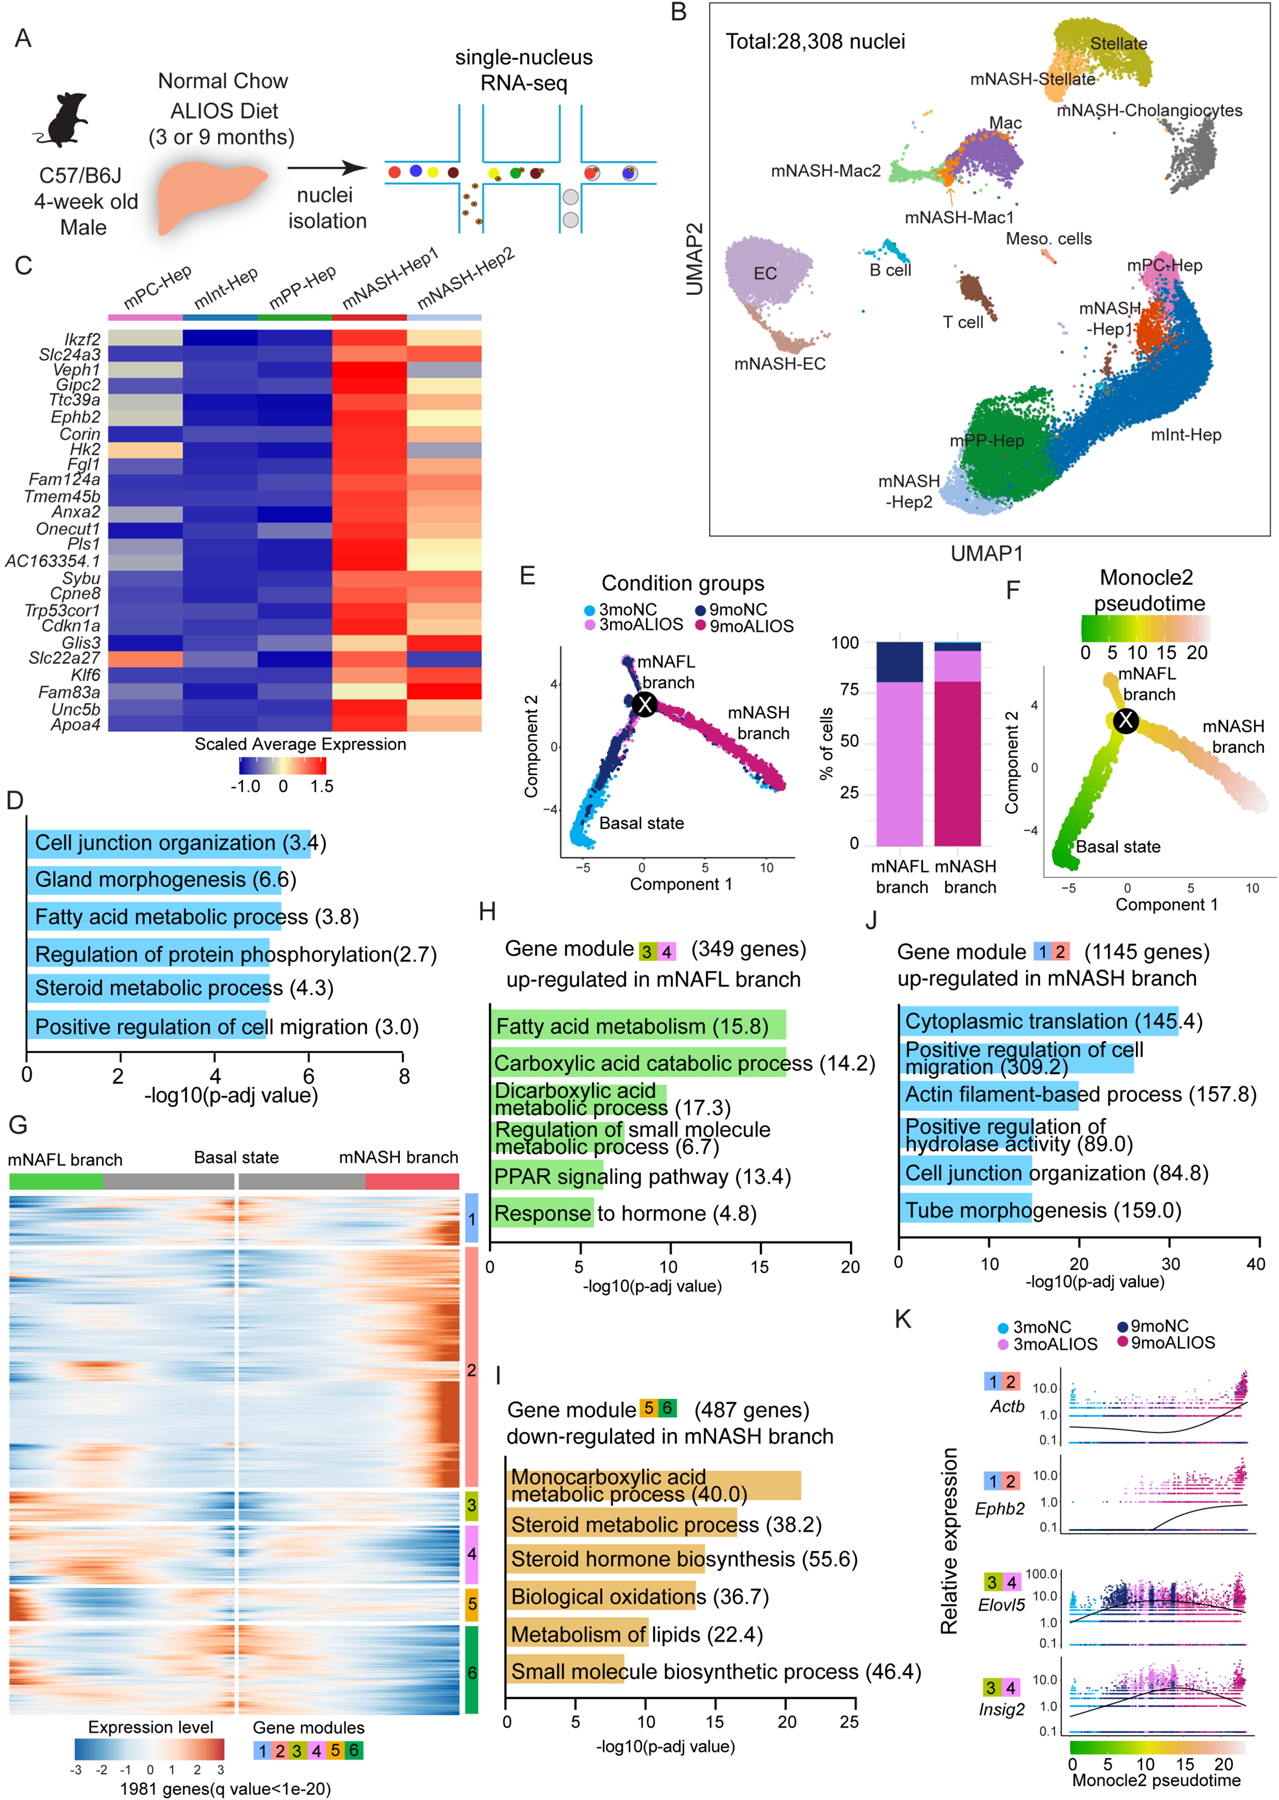
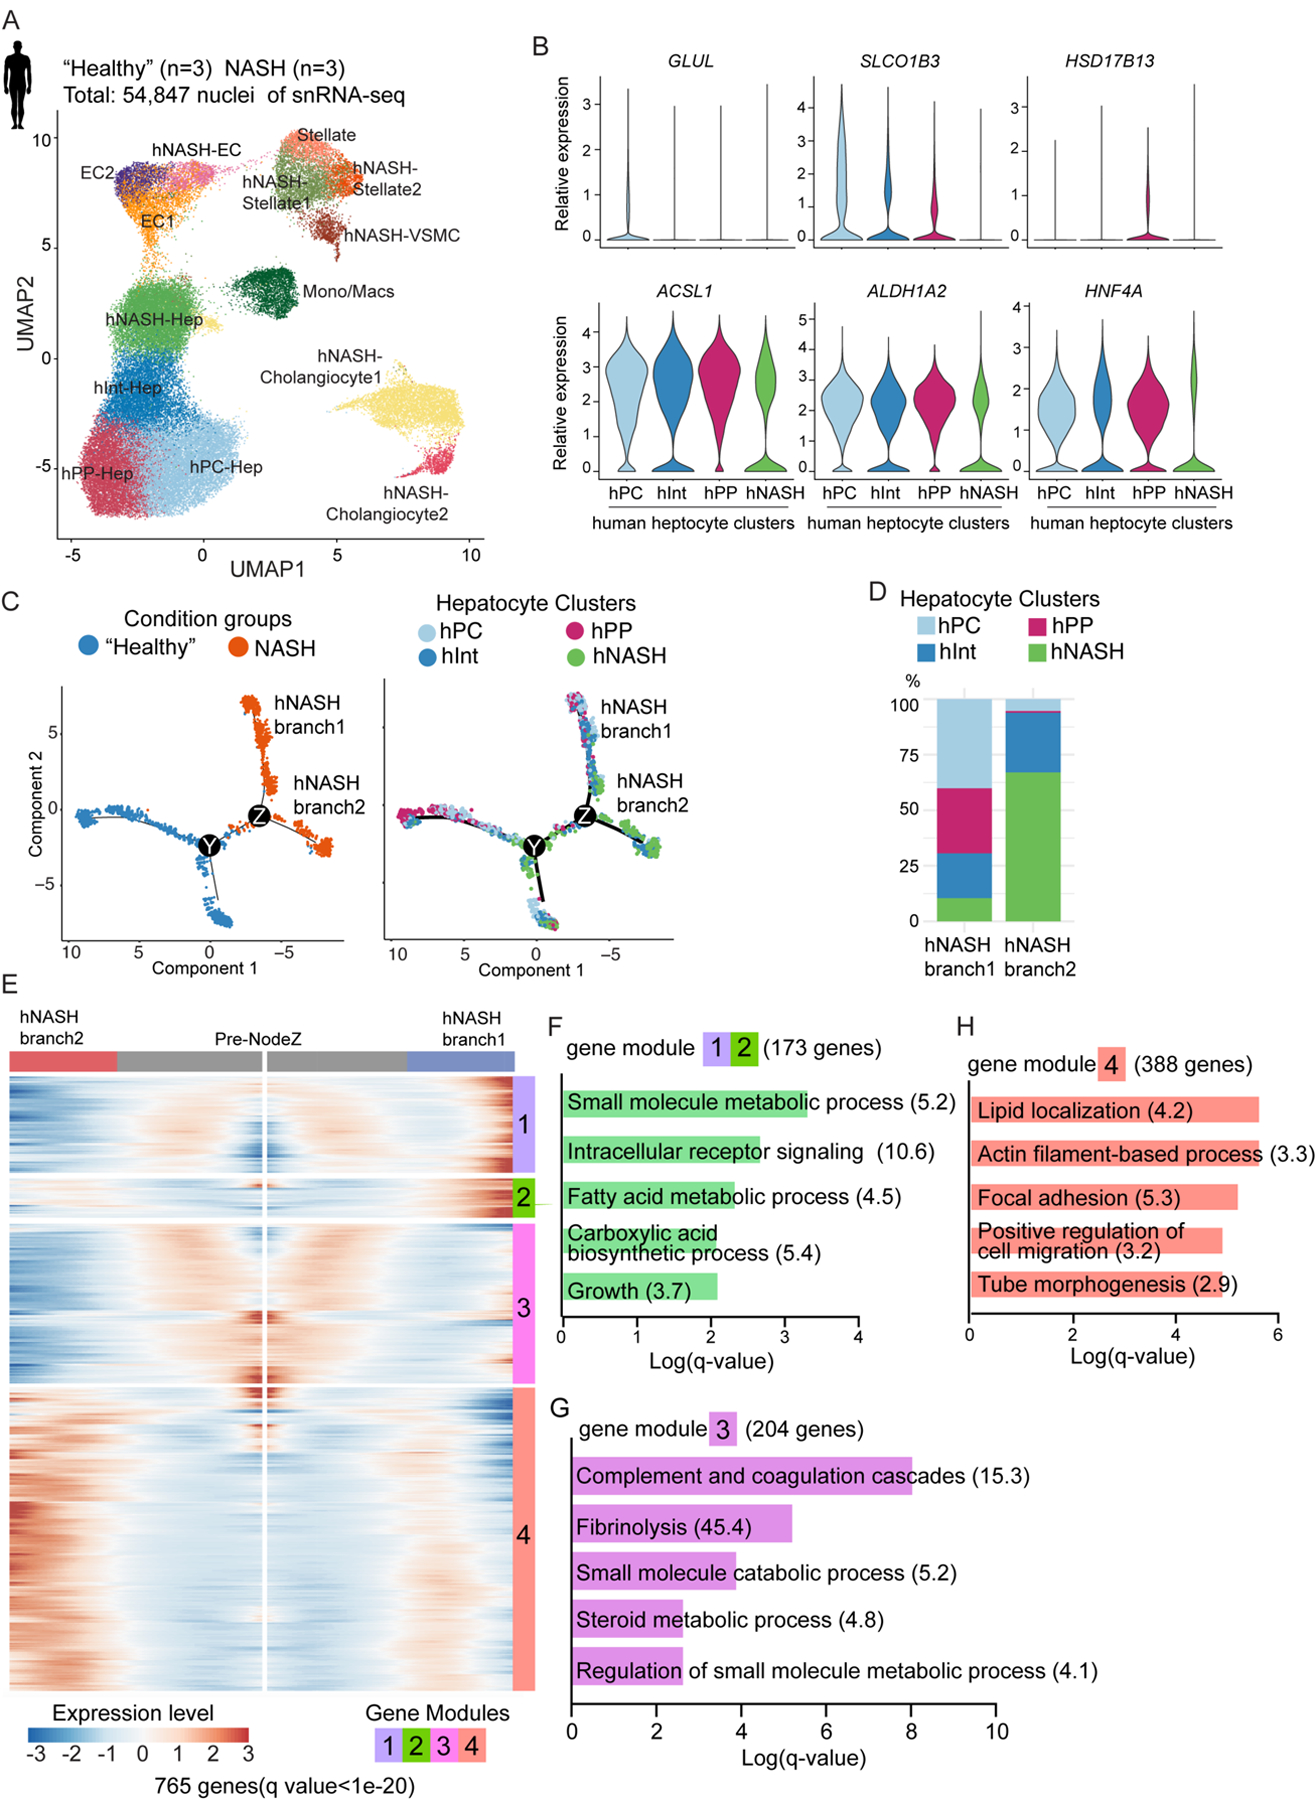
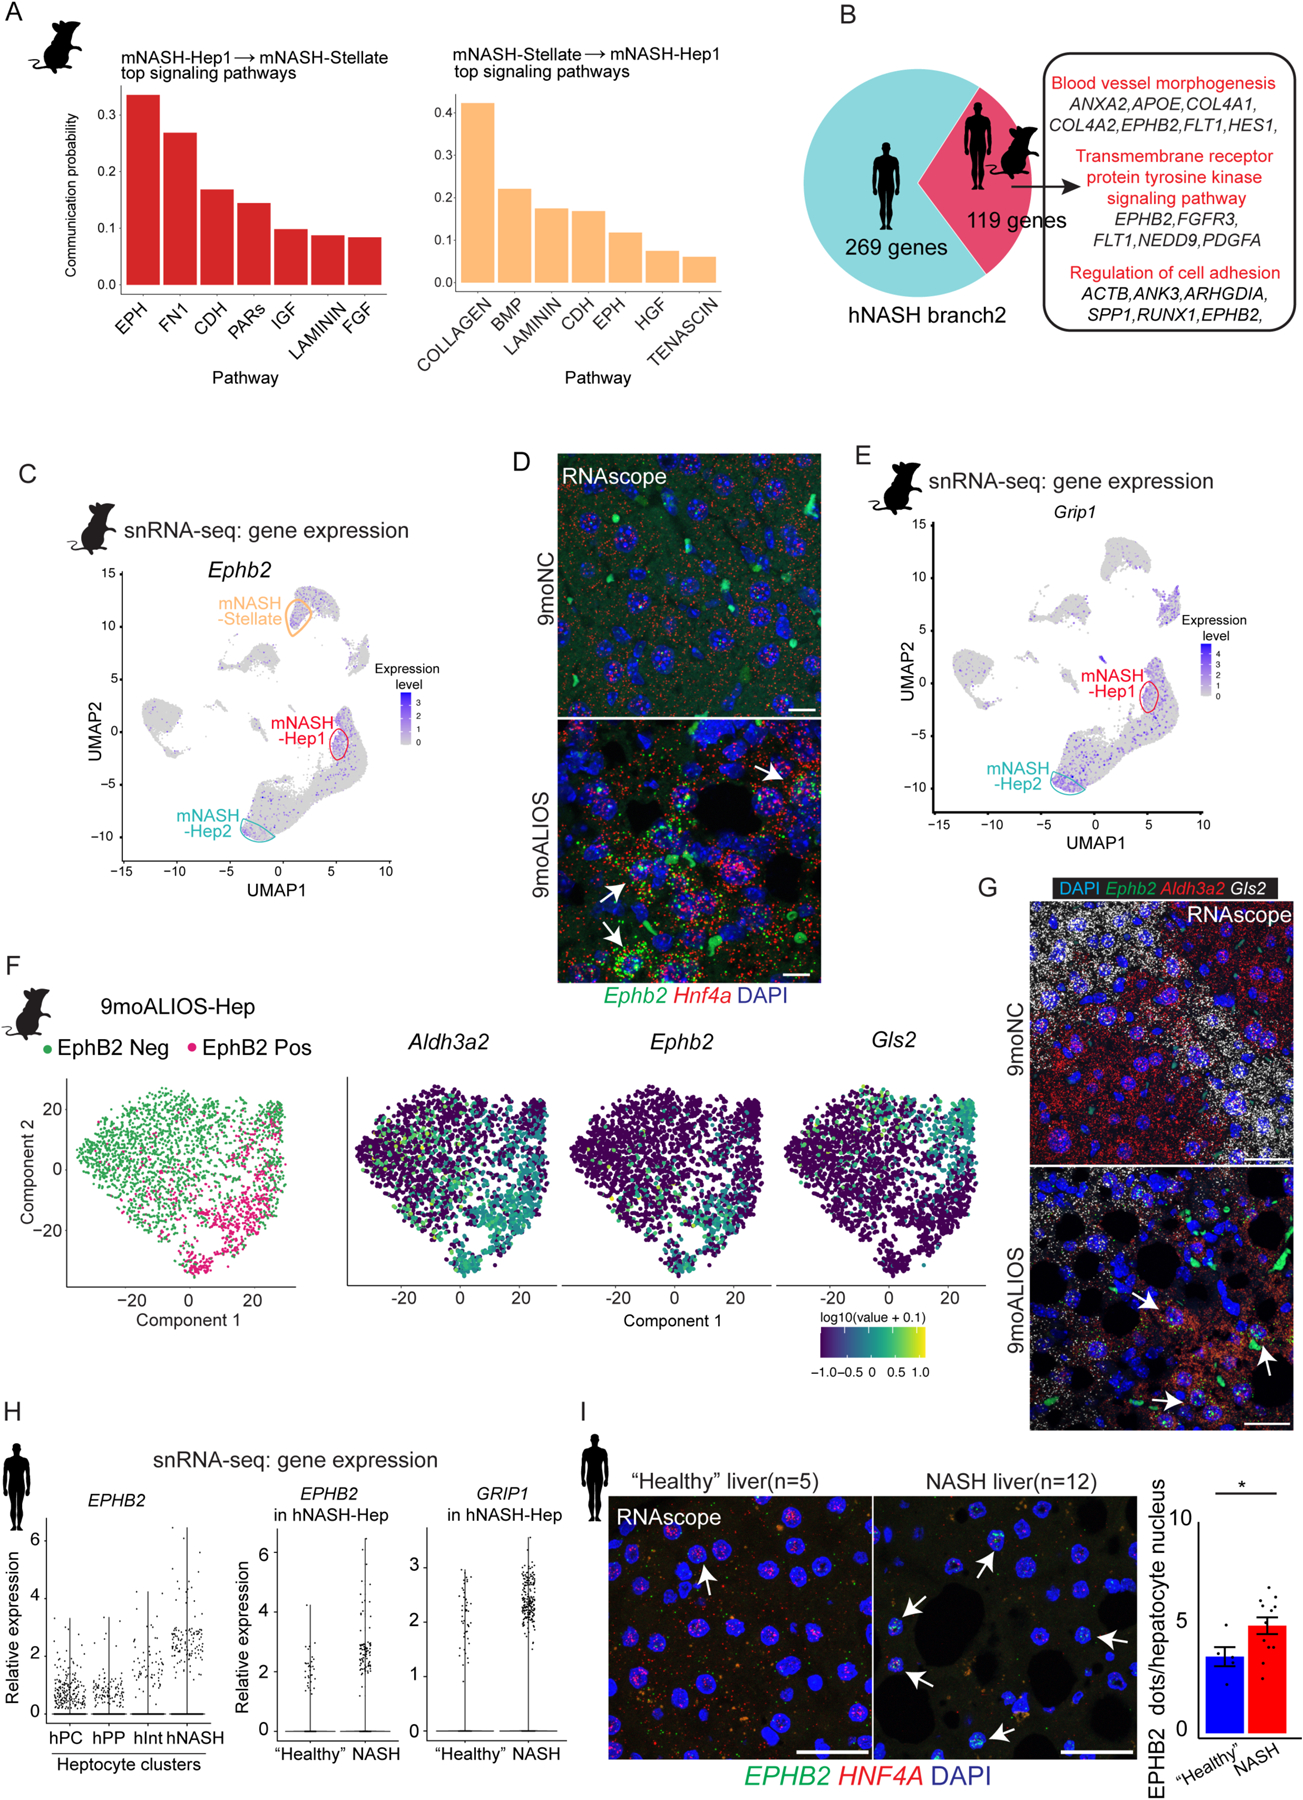
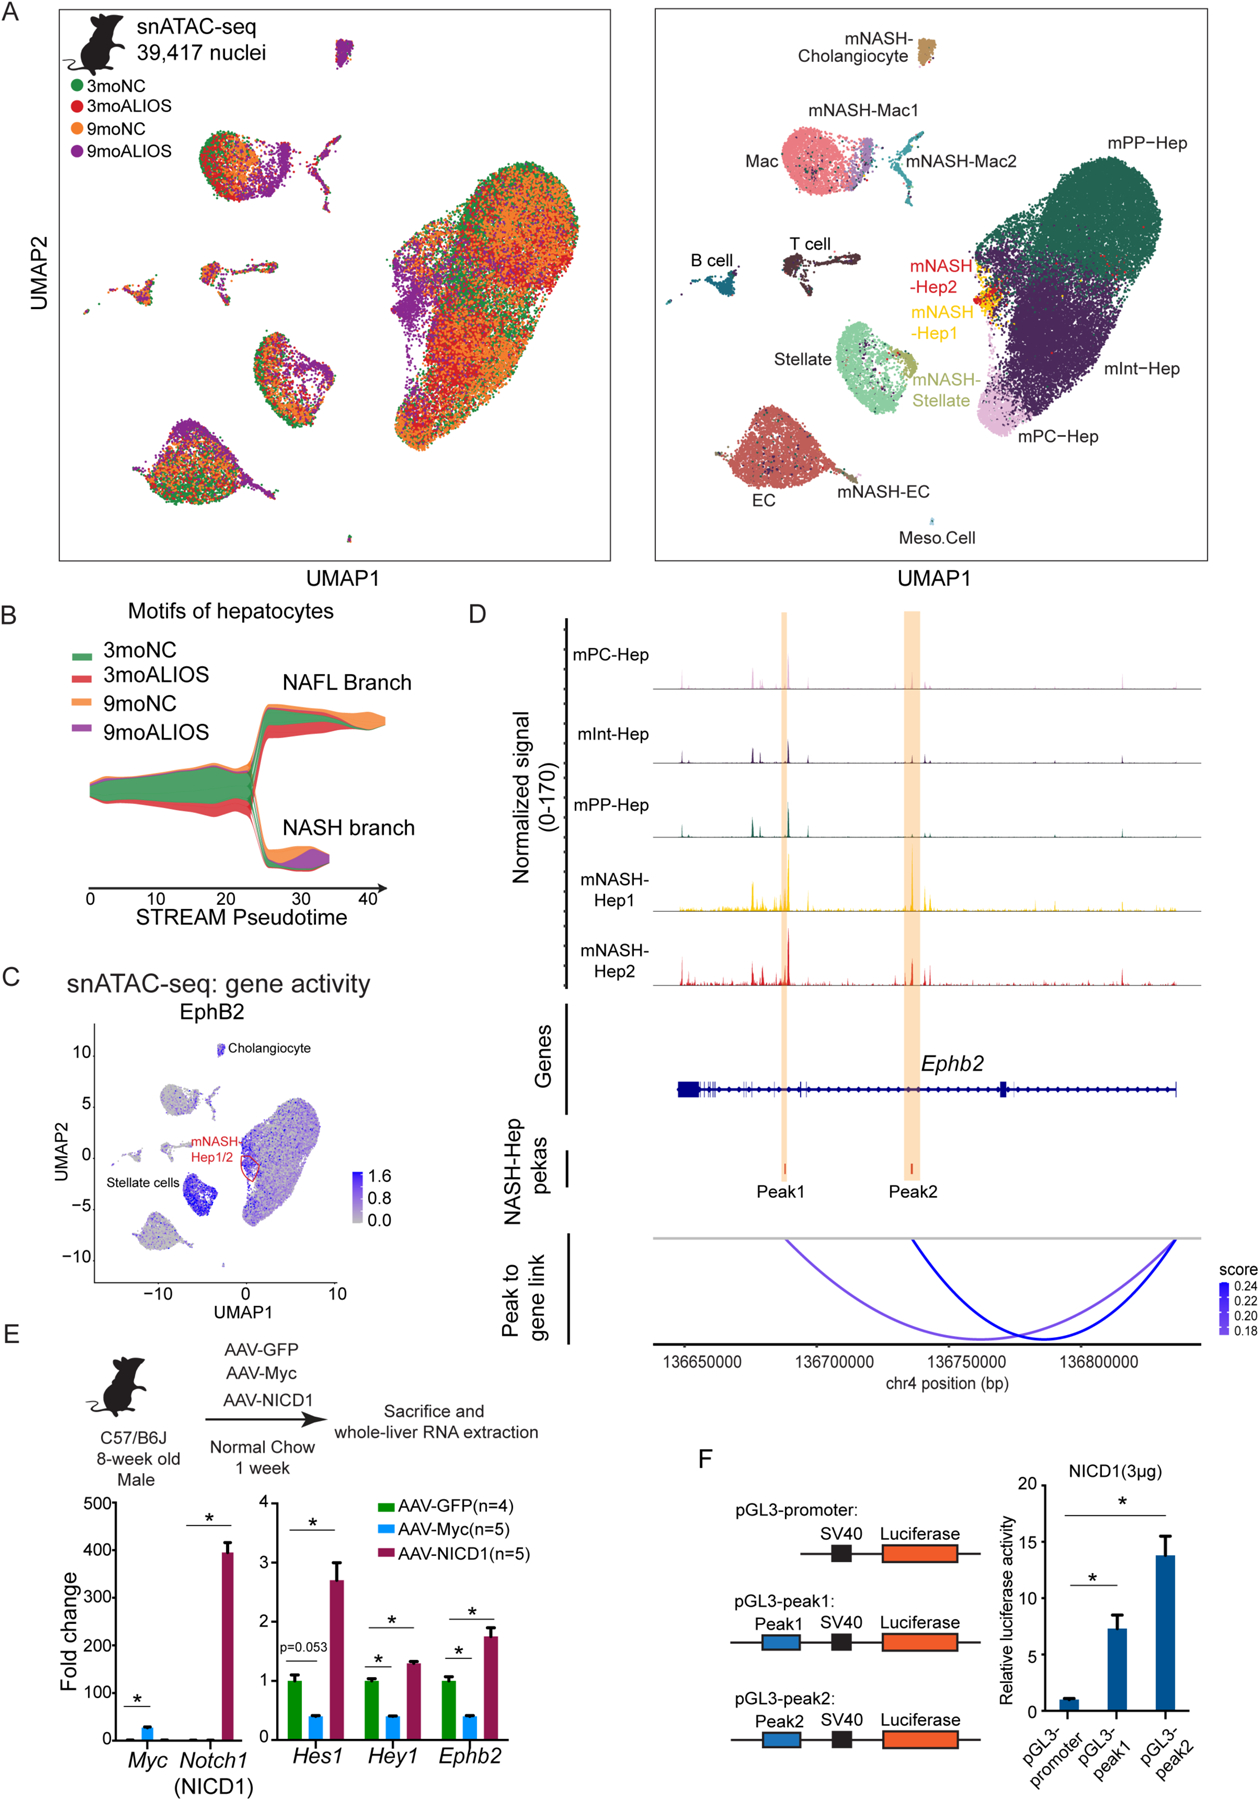
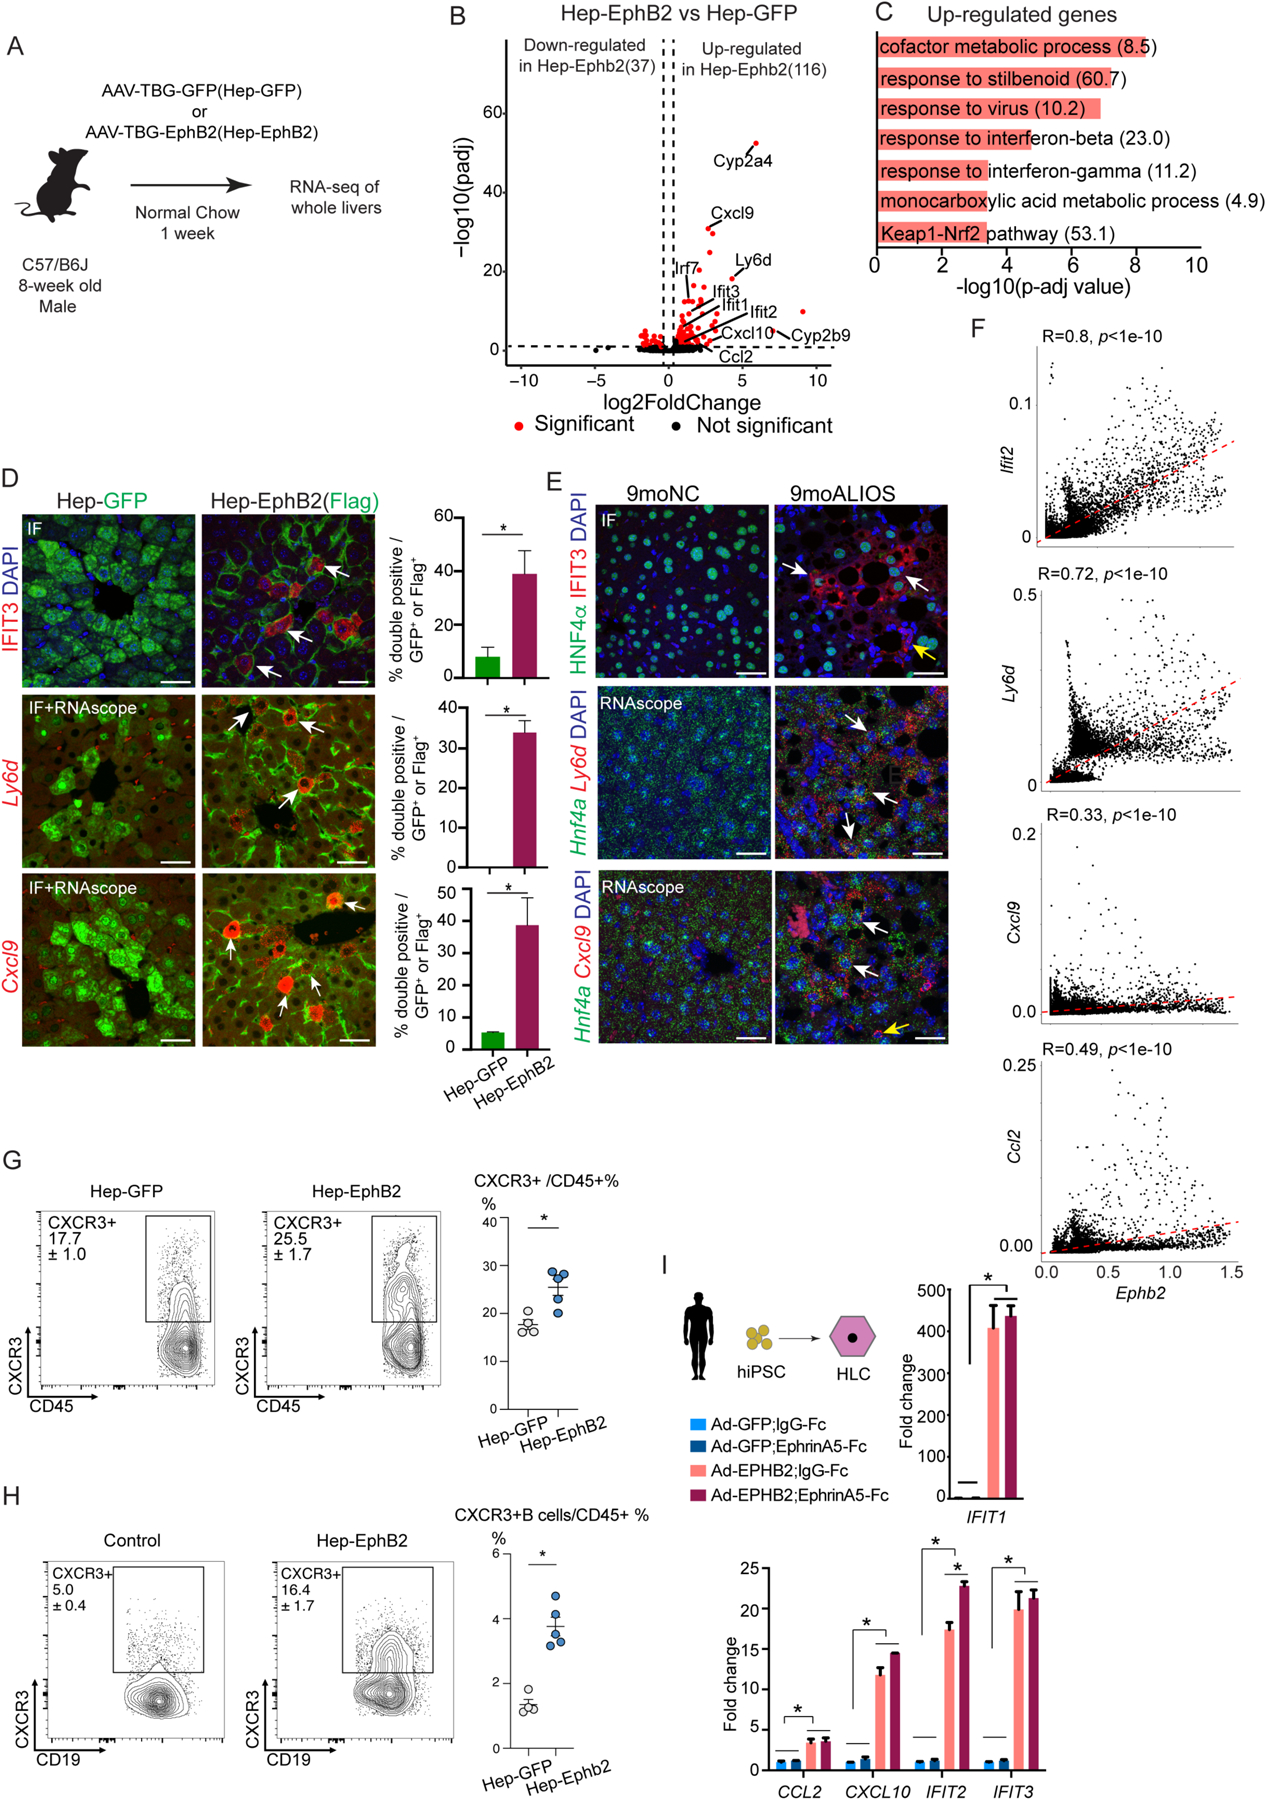
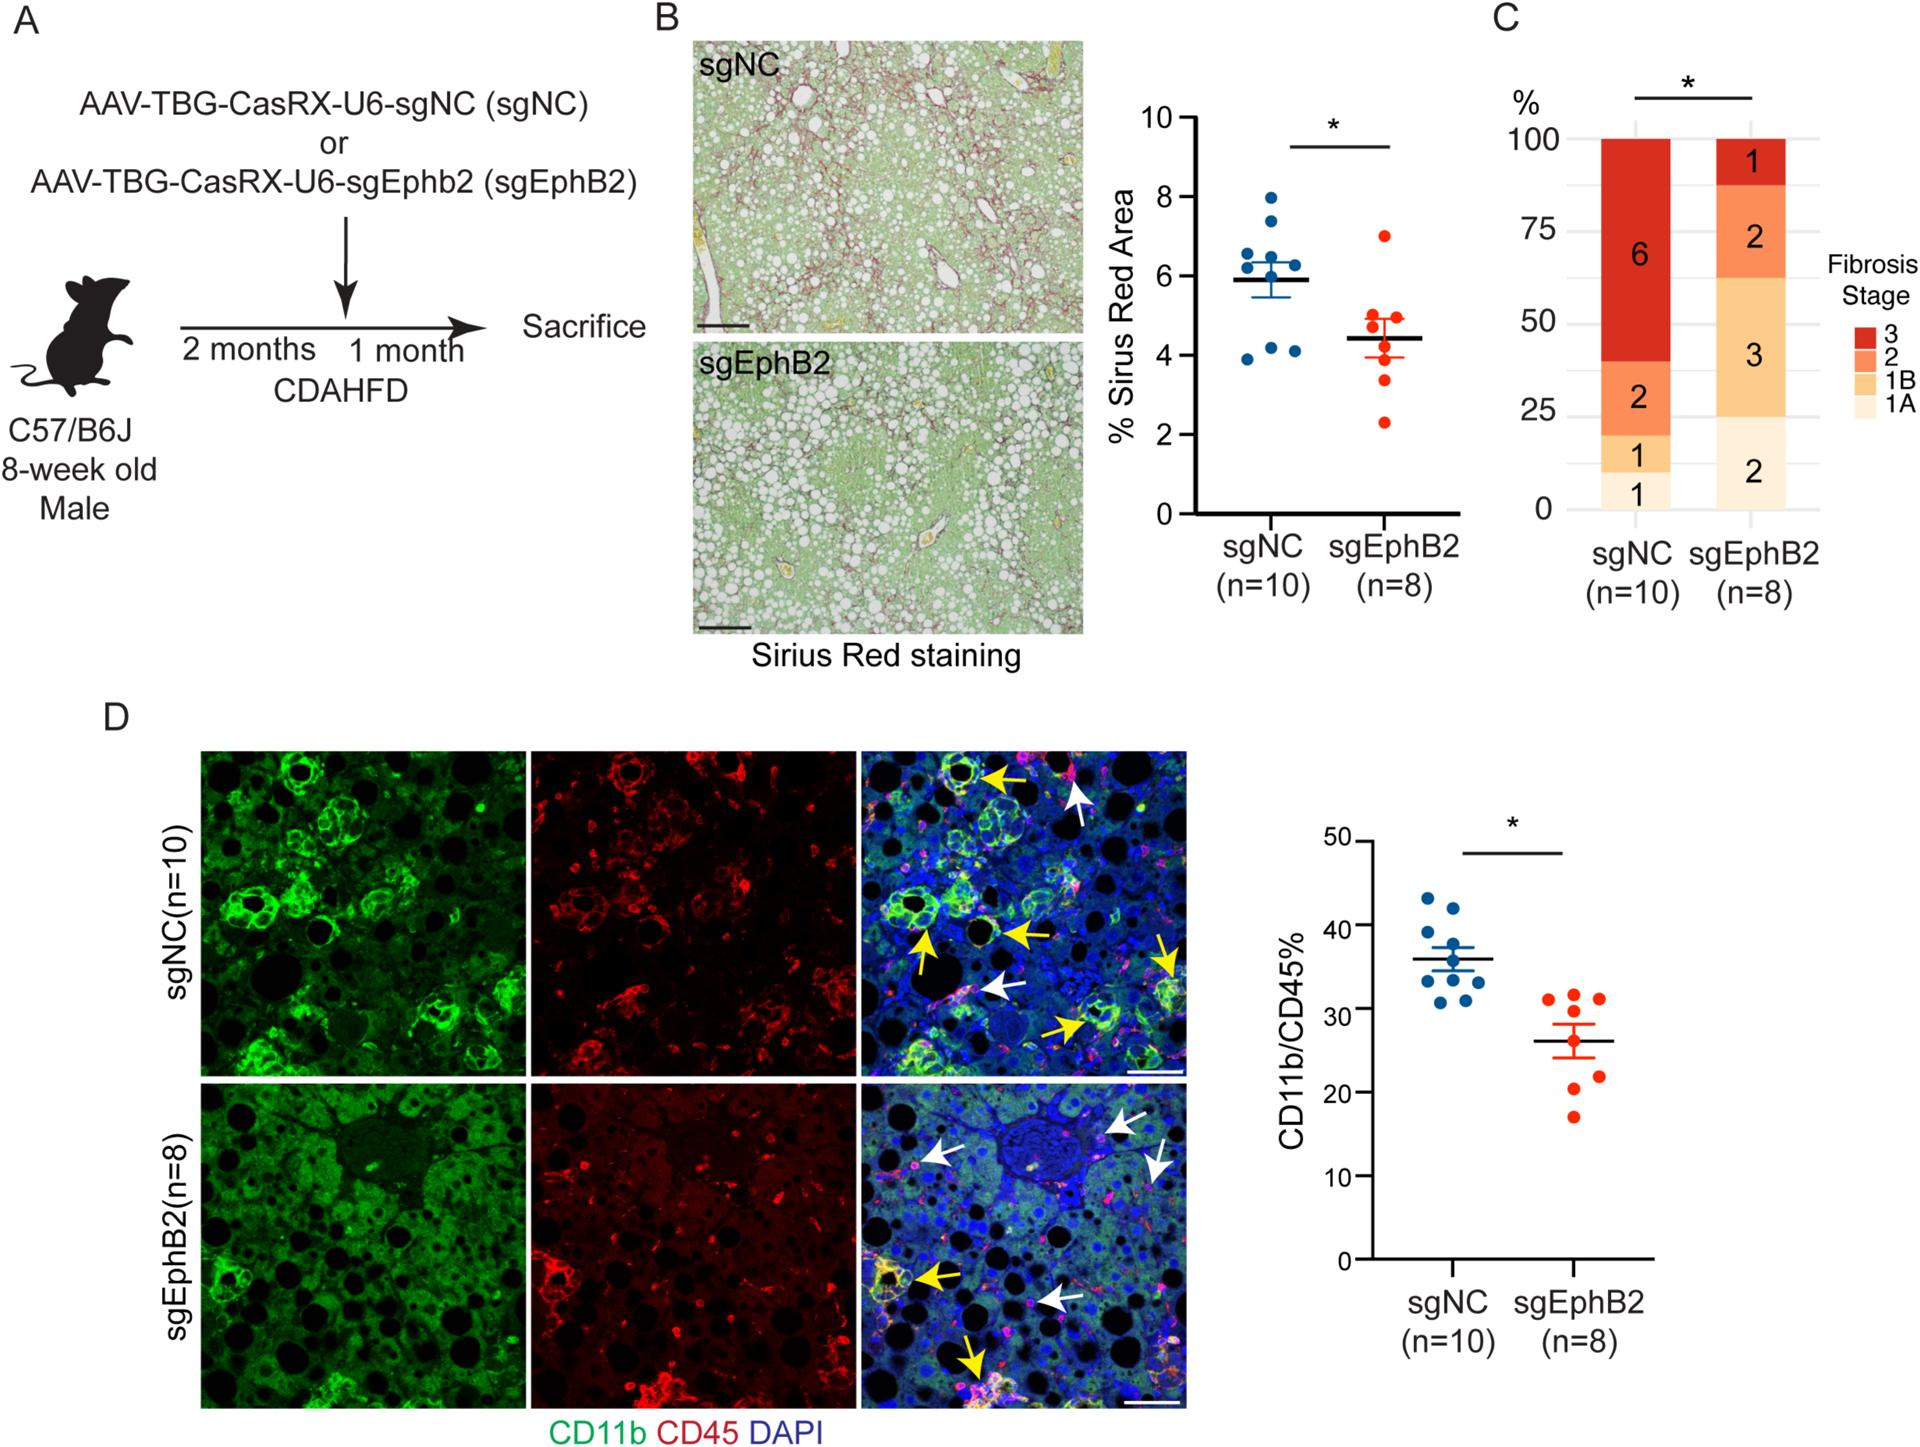
Current therapeutic strategies for treating nonalcoholic steatohepatitis (NASH) have failed to alleviate liver fibrosis, which is a devastating feature leading to hepatic dysfunction. Here, we integrated single-nucleus transcriptomics and epigenomics to characterize all major liver cell types during NASH development in mice and humans. The bifurcation of hepatocyte trajectory with NASH progression was conserved between mice and humans. At the nonalcoholic fatty liver (NAFL) stage, hepatocytes exhibited metabolic adaptation, whereas at the NASH stage, a subset of hepatocytes was enriched for the signatures of cell adhesion and migration, which were mainly demarcated by receptor tyrosine kinase ephrin type B receptor 2 (EphB2). EphB2, acting as a downstream effector of Notch signaling in hepatocytes, was sufficient to induce cell-autonomous inflammation. Knockdown of Ephb2 in hepatocytes ameliorated inflammation and fibrosis in a mouse model of NASH. Thus, EphB2-expressing hepatocytes contribute to NASH progression and may serve as a potential therapeutic target.


Conflict of interest statement

Competing interests:

M.A.L. is an advisory board member and has received research support from Pfizer Inc. He is also a scientific co-founder and advisory board member of Flare Therapeutics, and consultant to Madrigal Pharmaceuticals. The remaining authors declare that they have no competing interests.

Figures

Fig. 1.
Fig. 1.. snRNA-seq reveals hepatocyte-switching from macronutrient processing to cell adhesion and migration during murine NASH.
(A) Experimental scheme of snRNA-seq in profiling transcriptomic changes in all major liver cells during NASH progression in mice. (B) UMAP plot visualization of the unsupervised cell clusters containing 28,308 nuclei from livers of mice with four feeding paradigms including 3moNC,3moALIOS,9moNC, and 9moALIOS. Hep: hepatocytes; Mac: macrophages; EC: endothelial cells; Meso.cells: mesothelial cells. (C-D) Heatmap (C) and GO analysis (D) of top enriched genes in mNASH-Hep1/2 (Odds ratio indicated after each term). (E) Pseudotime analysis by Monocle2 revealed hepatocyte trajectory bifurcation during NASH progression, color coded by condition groups (left) and composition of the condition groups of mNAFL and mNASH branches (right). (F) Pseudotime analysis by Monocle2 revealed hepatocyte trajectory bifurcation during NASH progression color coded by Monocle2 pseudotime value. (G) Heatmap of the 1981 genes (q value < 1e-20) that determined hepatocyte trajectory bifurcation using branched expression analysis modeling (BEAM) in Monocle2. These genes are clustered into 6 different modules based on their gene expression pattern across Monocle2 pseudotime. Left: gene expression patterns from basal state to NAFL state (upper branch in Fig. 1E); Right: gene expression patterns from basal state to NASH state (lower branch in Fig. 1E). (H-J) GO analysis of gene modules that determined hepatocyte trajectory bifurcation (Odds ratio indicated after each term). (K) Example genes of gene module 1/2 and 3/4 (the gene module color is consistent with Fig. 1H,J and the Monocle2 pseudotime color is consistent with Fig. 1F).
Fig. 2.
Fig. 2.. snRNA-seq uncovers bifurcation of hepatocyte trajectory in human patients with NASH.
(A) UMAP plot visualization of the unsupervised cell clusters containing 54,847 nuclei from livers of “healthy” and NASH human livers. Hep: hepatocytes; Mono/Mac: monocytes/macrophages; EC: endothelial cells; VSMC: vascular smooth muscle cells. (B) Violin plot shown differential gene expression across 4 hepatocyte clusters. (C) Pseudotime analysis by Monocle2 reveals hepatocyte trajectory bifurcation during NASH progression. From left to right, the color code indicates the condition groups and hepatocyte clusters. (D) The composition of hepatocyte clusters in hNASH branch1 and hNASH branch2. (E) Heatmap of the 765 genes (q value < 1e-20) that determined hepatocyte trajectory bifurcation at NodeZ in Fig. 2C using branched expression analysis modeling (BEAM) in Monocle2. These genes are clustered into 4 different modules based on their gene expression pattern across Monocle2 pseudotime. (F-H) GO analysis of gene modules which determined hNASH branch1 and 2 (Odds ratio indicated after each term).
Fig. 3.
Fig. 3.. A subset of hepatocytes from mouse and human NASH livers exhibit enhanced EphB2 activity.
(A) Top signaling pathways mediated intercellular communication between mNASH-Hep1 and mNASH-Stellate. (B) 119 common genes including EPHB2 between mouse and human were identified as contributing to mNASH branch/hNASH branch2. (C) UMAP plot of snRNA-seq showing mNASH-Hep1/2 Ephb2 RNA expression. (D) Elevated transcript abundance of Ephb2 in hepatocytes from 9moALIOS liver was validated by RNAscope (white arrows pointing to the hepatocyte nuclei labelled by Hnf4a, scale bar=20μm, n=3 in each group). (E) UMAP plot of snRNA-seq shown Grip1 was prominently elevated in mNASH-Hep1/2. (F) Subclustering of hepatocytes from 9moALIOS liver based on Ephb2 transcript abundance and expression pattern of zonation landmarks Aldh3a2 and Gls2 in EphB2-positive and EphB2-negative clusters. (G) Co-staining Ephb2 with zonation landmarks using RNAscope validated that Ephb2-expressing hepatocytes mostly localized in pericentral zone (scale bar=25μm, n=3 in each group). (H) EPHB2 expression across different hepatocyte clusters in human snRNA-seq and differential expression of EPHB2 and GRIP1 between “healthy” and NASH conditions within the hNASH-Hep cluster. (I) RNA in situ hybridization using RNAscope showed increased EPHB2 expression (green, white arrows) in hepatocyte nuclei stained with HNF4A (red) in livers from human patients with NASH (n=12) compared with “healthy” donor livers (n=5) (*p<0.05, Mann-Whitney U test, scale bar=25μm).
Fig. 4.
Fig. 4.. Notch induces EphB2 expression in hepatocytes.
(A) Left: UMAP plot of snATAC-seq of mouse livers colored by sample identity. Right: UMAP plot of snATAC-seq colored by clusters (Hep: hepatocytes; EC: endothelial cells; MAC: macrophages). (B) Using ChromVAR motif-cell z-score matrix as input, STREAM pesudotime density plot uncovered a bifurcation of hepatocyte TF motif trajectory during NASH progression. NAFL branch and NASH branch were assigned based on the experimental group composition in the corresponding branch. (C) UMAP plot of snATAC-seq demonstrated that mNASH Hep1/2 acquired elevated gene activity of EphB2 (orange circle). (D) snATAC-seq peak tracks across different hepatocyte clusters at Ephb2 locus. Peak to gene links were calculated based on the correlations between peak accessibility in snATAC-seq and gene expression in snRNA-seq. Two cis-elements (regions highlighted in yellow as Peak1 and Peak2) were predicted to positively control Ephb2 expression in hepatocytes. (E) Top: experimental scheme of forced activation of NICD and Myc in hepatocytes. Bottom: NICD but not Myc in hepatocytes up-regulated Ephb2 expression. Data are expressed as mean ± SEM, *p<0.05, Mann-Whitney U test. (F) NICD promoted luciferase activity through the two cis-regulatory elements at Ephb2 locus identified by the integration of snRNA-seq and snATAC-seq. Data are expressed as mean ± SD, n=3 in each group, * p<0.05 Mann-Whitney U test.
Fig. 5.
Fig. 5.. Hepatocyte-specific EphB2 activation in mice fed NC diet induces cell-autonomous inflammation
(A) Experimental scheme of RNA-seq of whole livers from the mice with forced expression of EphB2 (Hep-EphB2, n=3) or GFP (Hep-GFP, n=3). (B) Volcano plot of the differentially expressed genes (shown as red dots with cutoff padj<0.1 and abs(log2FC) > 0.5) between Hep-EphB2 and Hep-GFP (Ephb2 is not shown on this plot). (C) GO analysis demonstrated enrichment of metabolic processes, interferon response pathways, oxidative stress pathways, and Keap1-Nrf2 in up-regulated genes (Odds ratio indicated after each term). (D) IF staining (IFIT3) and RNA-scope (Ly6d and Cxcl9) showing induced inflammatory response in hepatocytes with ectopic expression of EphB2 (white arrows). GFP and Flag antibodies stained the transduced hepatocytes from AAV-GFP and AAV-EphB2-Flag tail-vein injected mouse livers respectively. Data are expressed as mean ± SD, n=3 in each group, *p<0.05, Mann-Whitney U test, scale bar=25μm. (E) IF staining (IFIT3) and RNA-scope (Ly6d and Cxcl9) in hepatocytes from mice treated with ALIOS diet for 9 months (white arrows). Antibody against Hnf4α or RNAscope probe detecting Hnf4a was used to label hepatocytes. Ifit3 and Cxcl9 were also detected in the non-hepatocytes in 9moALIOS livers (yellow arrows, scale bar=25μm). (F) Correlation analysis of snRNA-seq demonstrated Ifit2, Ly6d, Cxcl9, and Ccl2 positively correlated with Ephb2 expression in hepatocytes. (G-H) Flow cytometry showing an increased percentage of CXCR3 and CXCR3+ B cells in Hep-Ephb2 livers. Data are expressed as mean ± SEM, n=4/5 in each group, *p<0.05. (I) Activation of EPHB2 in hiPSC-HLC induced inflammatory response and the effect was largely EphrinA5-independent. Data are expressed as mean ± SD, n=3 in each group, * p<0.05, Mann–Whitney U test.
Fig. 6.
Fig. 6.. Hepatocyte-specific EphB2 knockdown ameliorates NASH progression.
(A) Experimental scheme of inactivating EphB2 in hepatocytes in mice fed CDAHFD. (B) Representative images and quantification of Sirius red stained area in sgEphB2 and sgNC livers. Data are expressed as mean ± SEM, *p<0.05, Mann–Whitney U test, scale bar=100μm. (C) NASH fibrosis stage in sgEphB2 mice and sgNC control mice by blinded pathology evaluation (number labelled on the bar graph represented animal numbers in each category, *p<0.05, Mann–Whitney U test). (D) Reduced CD11b inflammatory cell infiltration in sgEphB2 visualized by IF. Yellow arrows pointed to CD11b+ CD45+ cells and white arrows pointed to Cd45+ cells. Data are expressed as mean ± SEM, *p<0.05, Mann–Whitney U test, scale bar=25μm.

References

    1. Golabi P, Paik JM, AlQahtani S, Younossi Y, Tuncer G, Younossi ZM, Burden of non-alcoholic fatty liver disease in Asia, the Middle East and North Africa: Data from Global Burden of Disease 2009–2019. J Hepatol 75, 795–809 (2021). - PubMed
    1. Albhaisi SAM, Sanyal AJ, New drugs for NASH. Liver Int 41 Suppl 1, 112–118 (2021). - PubMed
    1. Vuppalanchi R, Noureddin M, Alkhouri N, Sanyal AJ, Therapeutic pipeline in non-alcoholic steatohepatitis. Nat Rev Gastroenterol Hepatol 18, 373–392 (2021). - PubMed
    1. Sanyal AJ, Anstee QM, Trauner M, Lawitz EJ, Abdelmalek MF, Ding D, Han L, Jia C, Huss RS, Chung C, Wong VW, Okanoue T, Romero-Gomez M, Muir AJ, Afdhal NH, Bosch J, Goodman Z, Harrison SA, Younossi ZM, Myers RP, Cirrhosis Regression is Associated with Improved Clinical Outcomes in Patients with Nonalcoholic Steatohepatitis. Hepatology, (2021). - PMC - PubMed
    1. Deczkowska A, David E, Ramadori P, Pfister D, Safran M, At The B, Giladi A, Jaitin DA, Barboy O, Cohen M, Yofe I, Gur C, Shlomi-Loubaton S, Henri S, Suhail Y, Qiu M, Kam S, Hermon H, Lahat E, Ben Yakov G, Cohen-Ezra O, Davidov Y, Likhter M, Goitein D, Roth S, Weber A, Malissen B, Weiner A, Ben-Ari Z, Heikenwälder M, Elinav E, Amit I, XCR1(+) type 1 conventional dendritic cells drive liver pathology in non-alcoholic steatohepatitis. Nat Med 27, 1043–1054 (2021). - PubMed

Publication types